| Param | Original file | Final file |
|---|---|---|
| Filename | modeM0/AS1T03_262T01_9000003988_27710cztM0_level2.evt | modeM0/AS1T03_262T01_9000003988_27710cztM0_level2_quad_clean.evt |
| Size (bytes) | 509,483,520 | 88,822,080 |
| Size | 485.9 MB | 84.7 MB |
| Events in quadrant A | 3,595,397 | 547,992 |
| Events in quadrant B | 3,861,634 | 549,549 |
| Events in quadrant C | 3,731,614 | 535,307 |
| Events in quadrant D | 3,721,931 | 525,360 |
| Mode M0 | |||
|---|---|---|---|
| Quadrant | BADHDUFLAG | Total packets | Discarded packets |
| A | 0 | 15747 | 0 |
| B | 0 | 16241 | 0 |
| C | 0 | 15932 | 0 |
| D | 0 | 16520 | 0 |
| Mode M9 | |||
|---|---|---|---|
| Quadrant | BADHDUFLAG | Total packets | Discarded packets |
| A | 0 | 2 | 0 |
| B | 0 | 2 | 0 |
| C | 0 | 2 | 0 |
| D | 0 | 2 | 0 |
| Quadrant | Total seconds | Saturated seconds | Saturation percentage |
|---|---|---|---|
| A | 7639 | 155 | 2.029061% |
| B | 7640 | 189 | 2.473822% |
| C | 7640 | 185 | 2.421466% |
| D | 7640 | 122 | 1.596859% |
Noise dominated data is calculated using 1-second bins in cleaned event files. If a bin has >2000 counts, and if more than 50% of those come from <1% of pixels, then it is considered to be noise-dominated and hence unusable.
| Quadrant | # 1 sec bins | Bins with >0 counts | Bins with >2000 counts | High rate bins dominated by noise | Noise dominated (total time) | Noise dominated (detector-on time) | Marked lightcurve |
|---|---|---|---|---|---|---|---|
| A | 7819 | 7639 | 1 | 1 | 0.01% | 0.01% | 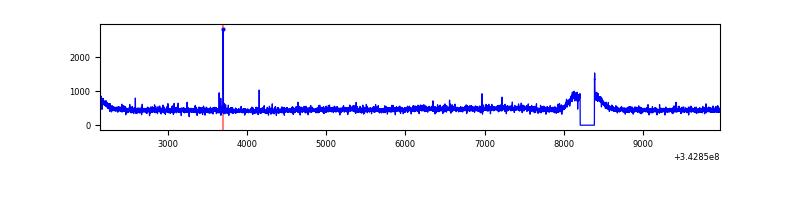 |
| B | 7820 | 7640 | 0 | 0 | 0.00% | 0.00% | 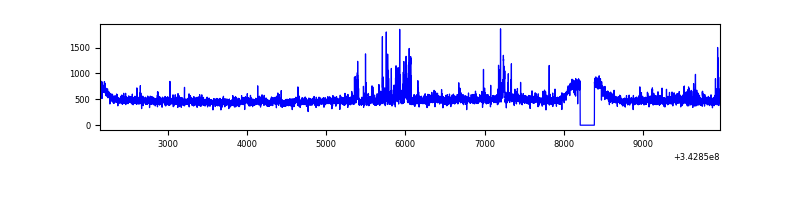 |
| C | 7820 | 7640 | 3 | 3 | 0.04% | 0.04% | 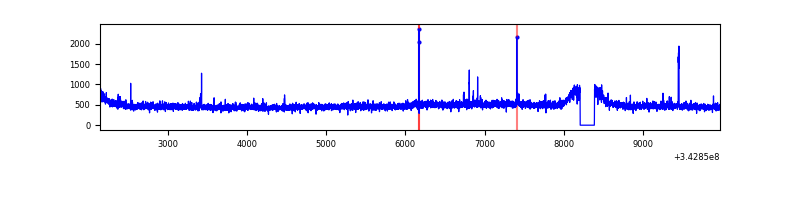 |
| D | 7820 | 7640 | 19 | 19 | 0.24% | 0.25% | 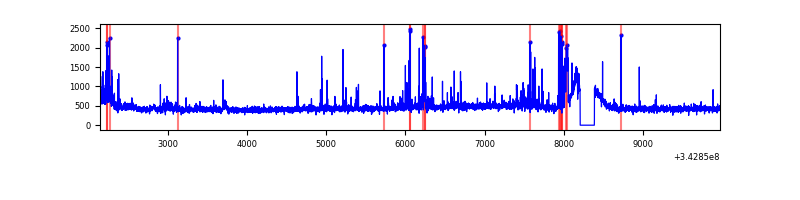 |
Top three noisy pixels from each quadrant. If the there are fewer than three noisy pixels in the level2.evt file, extra rows are filled as -1
| Pixel properties | Quadrant properties | ||||||
|---|---|---|---|---|---|---|---|
| Quadrant | DetID | PixID | Counts | Sigma | Mean | Median | Sigma |
| A | 6 | 16 | 12524 | 61.55 | 927 | 905 | 188.8 |
| A | 13 | 254 | 12348 | 60.62 | 927 | 905 | 188.8 |
| A | 3 | 137 | 9120 | 43.52 | 927 | 905 | 188.8 |
| B | 0 | 230 | 113977 | 631.27 | 923 | 898 | 179.1 |
| B | 3 | 112 | 88140 | 487.03 | 923 | 898 | 179.1 |
| B | 12 | 111 | 22731 | 121.88 | 923 | 898 | 179.1 |
| C | 14 | 238 | 143375 | 674.2 | 896 | 900 | 211.3 |
| C | 3 | 233 | 55928 | 260.4 | 896 | 900 | 211.3 |
| C | 15 | 208 | 28056 | 128.5 | 896 | 900 | 211.3 |
| D | 1 | 52 | 156402 | 716.56 | 897 | 870 | 217.1 |
| D | 2 | 250 | 136556 | 625.13 | 897 | 870 | 217.1 |
| D | 2 | 234 | 29909 | 133.79 | 897 | 870 | 217.1 |
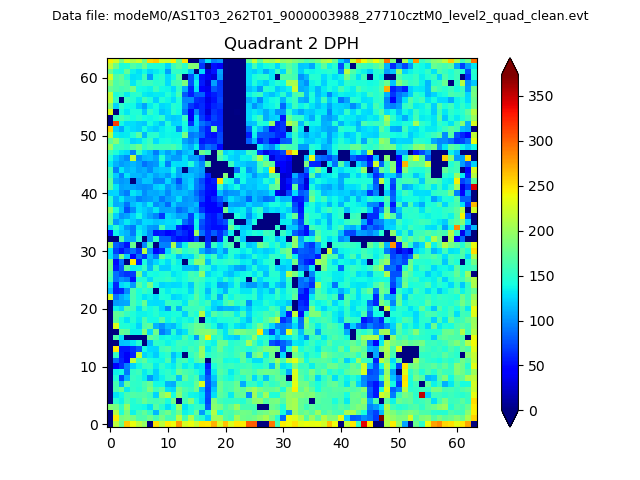
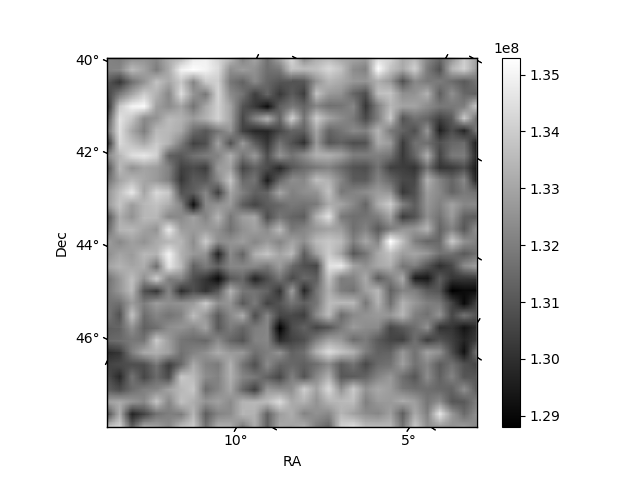
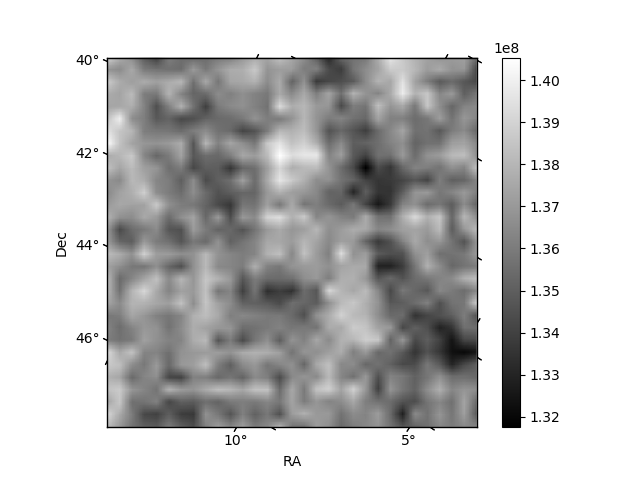
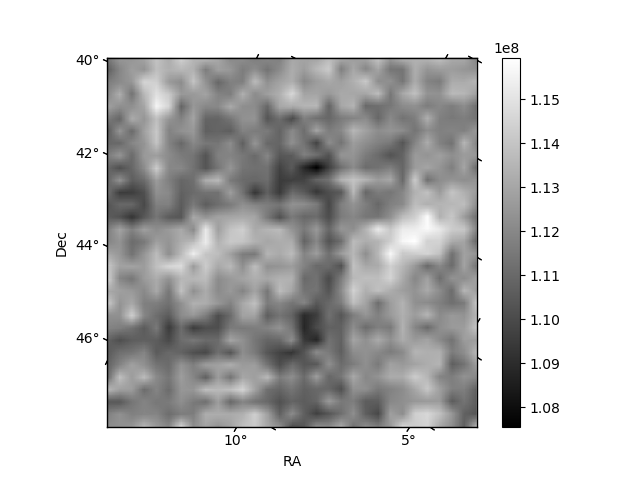
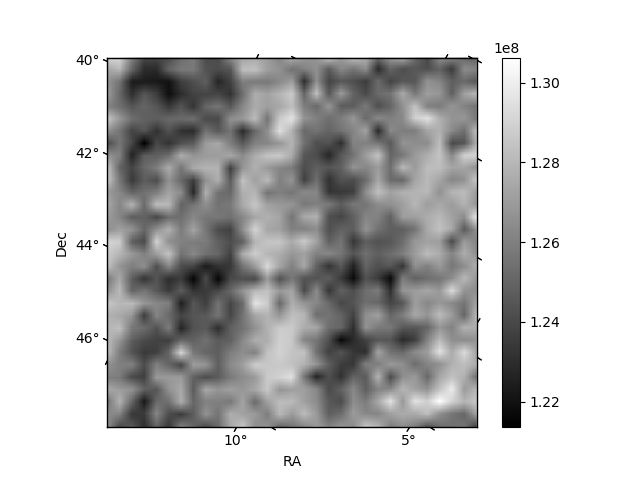
Histogram calculated using DETX and DETY for each event in the final _common_clean file
| Quadrant A | 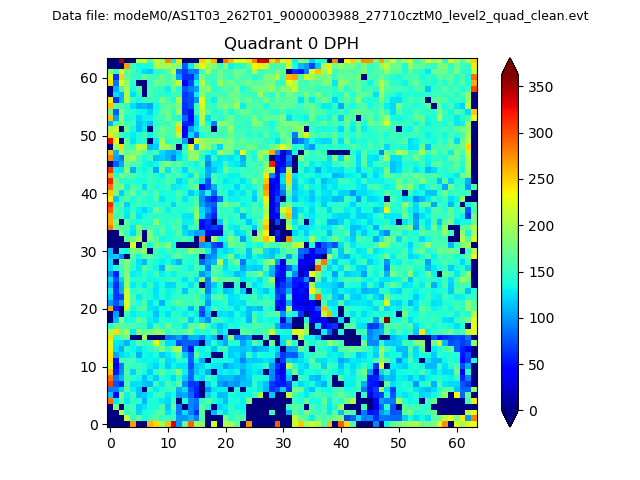 |
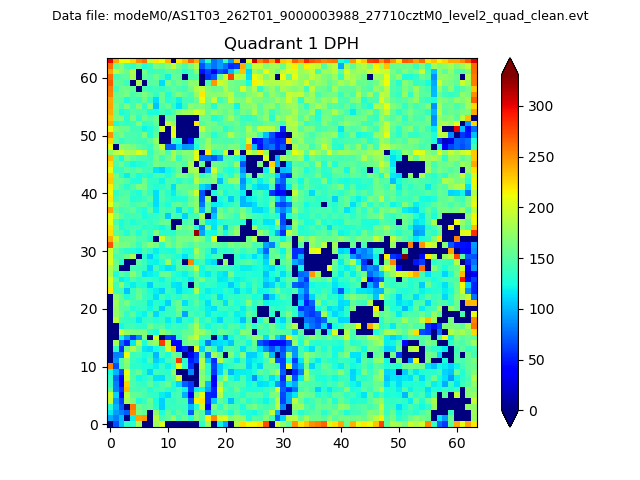 |
Quadrant B |
|---|---|---|---|
| Quadrant D | 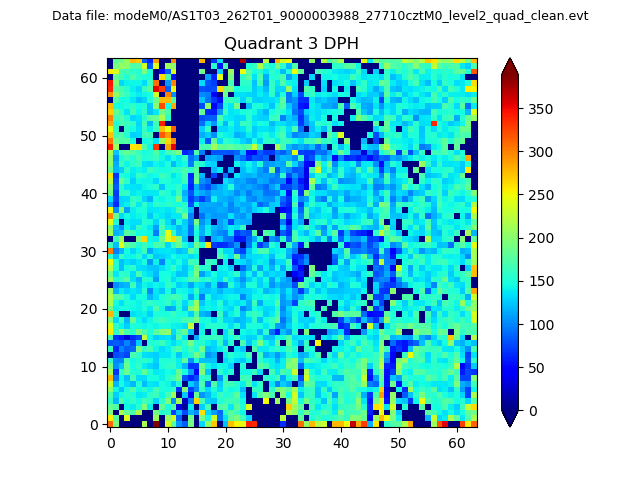 |
 |
Quadrant C |
| Plot type | Count rate plots | Images |
|---|---|---|
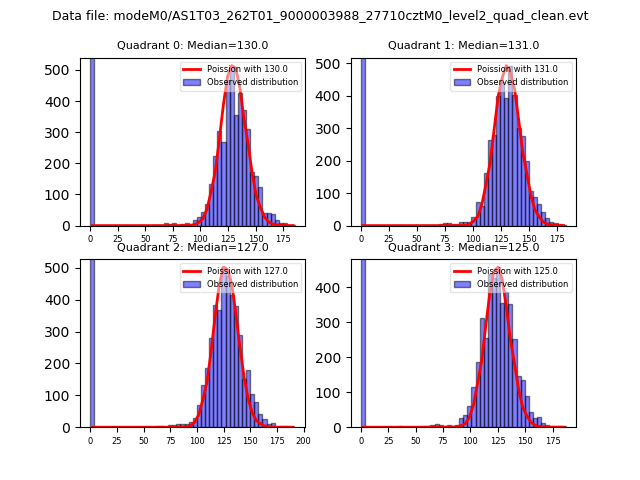
| Comparison with Poisson distribution Blue bars denote a histogram of data divided into 1 sec bins. Red curve is a Poisson curve with rate = median count rate of data. |
 |
 |
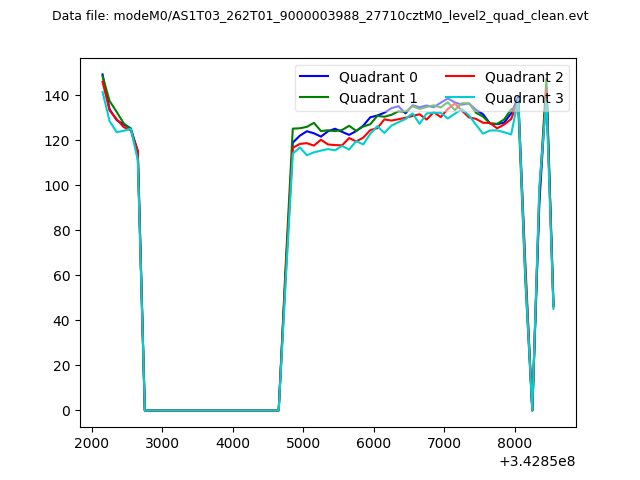
| Quadrant-wise count rates Data is divided into 100 sec bins |
 |
|
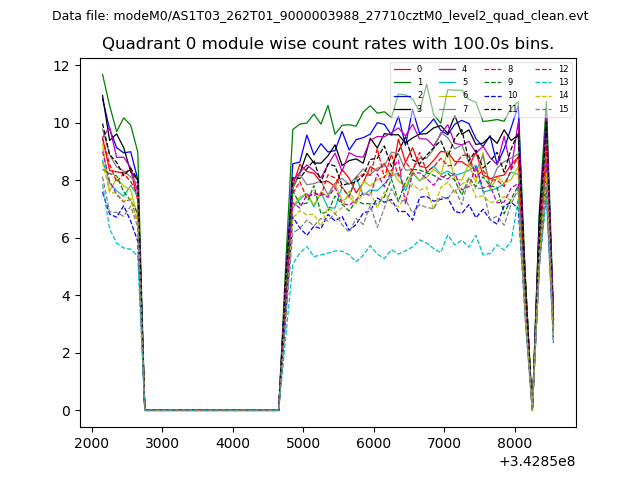
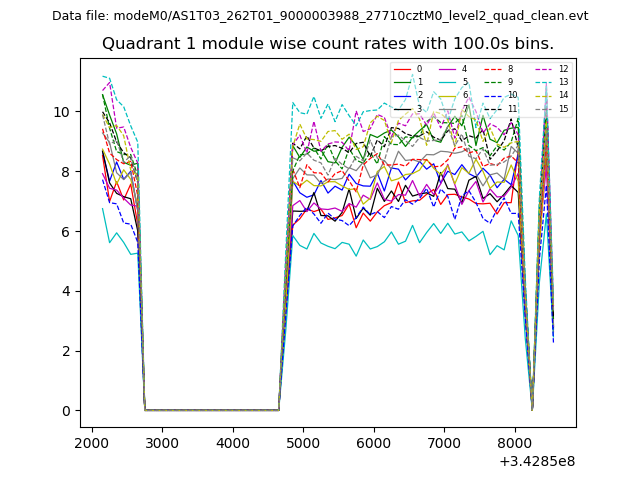
| Module-wise count rates for Quadrant A Data is divided into 100 sec bins |
 |
 |
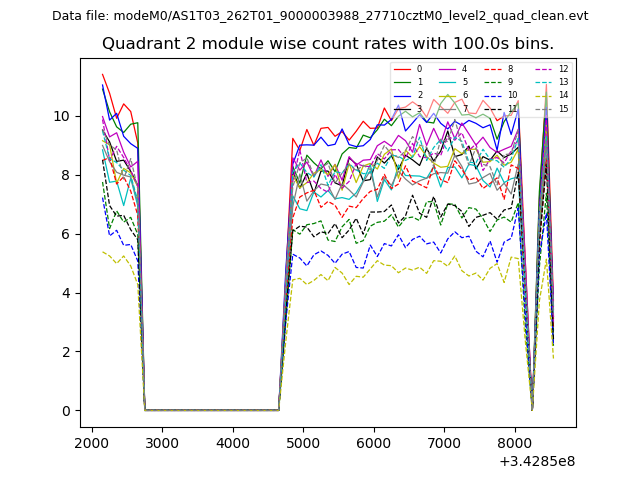
| Module-wise count rates for Quadrant B Data is divided into 100 sec bins |
 |
 |
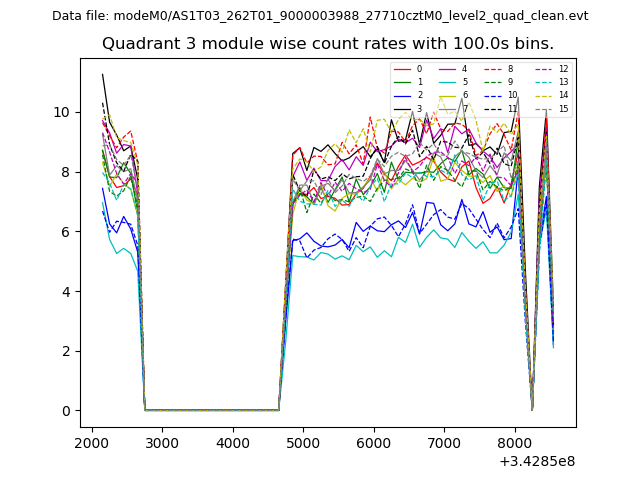
| Module-wise count rates for Quadrant C Data is divided into 100 sec bins |
 |
 |
| Module-wise count rates for Quadrant D Data is divided into 100 sec bins |
 |
 |
| Parameter | Plot |
|---|---|
| CZT HV Monitor | 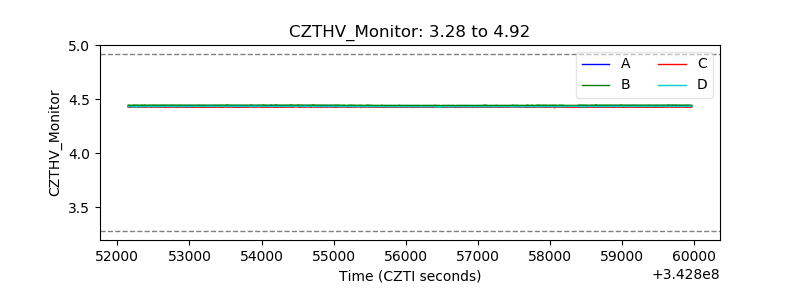 |
| D_VDD | 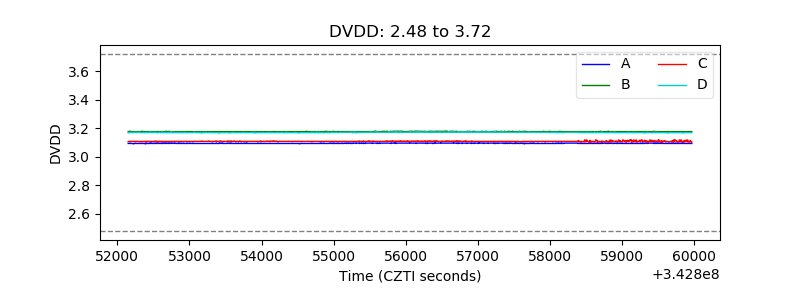 |
| Temperature 1 | 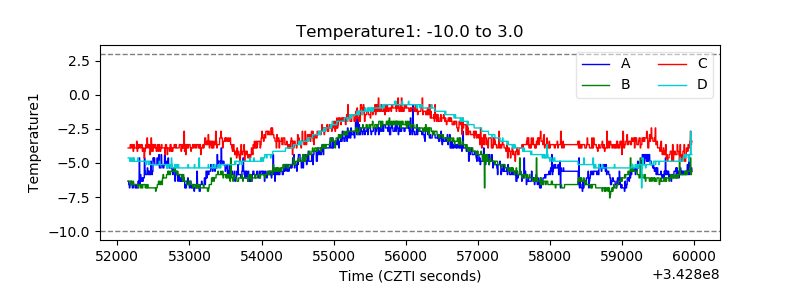 |
| Veto HV Monitor | 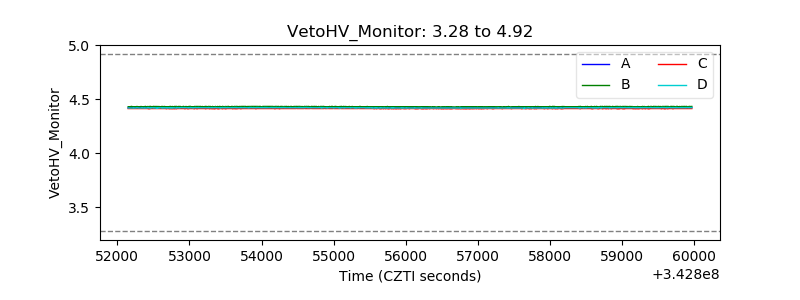 |
| Veto LLD | 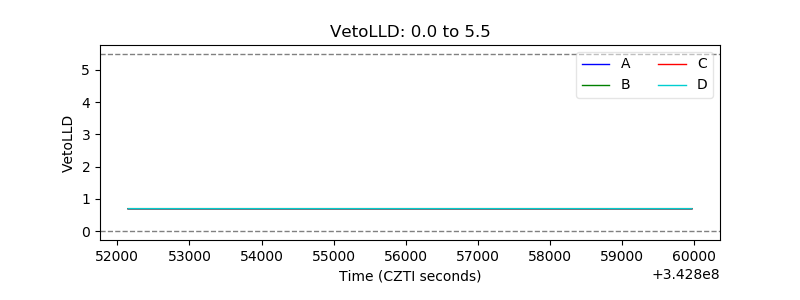 |
| Alpha Counter | 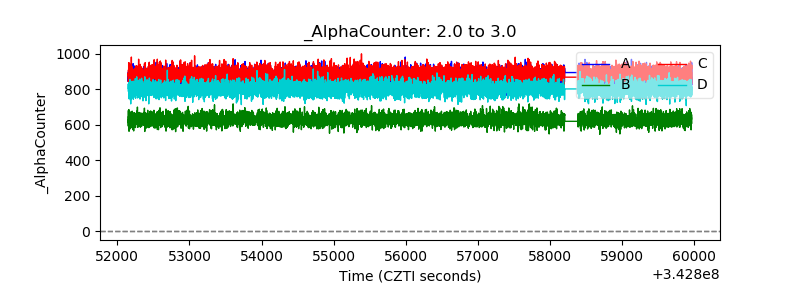 |
| _CPM_Rate | 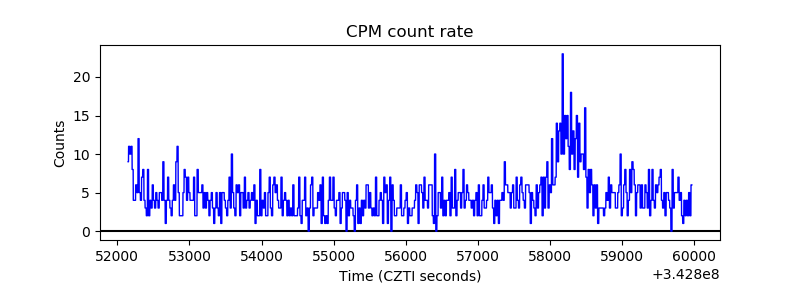 |
| CZT Counter | 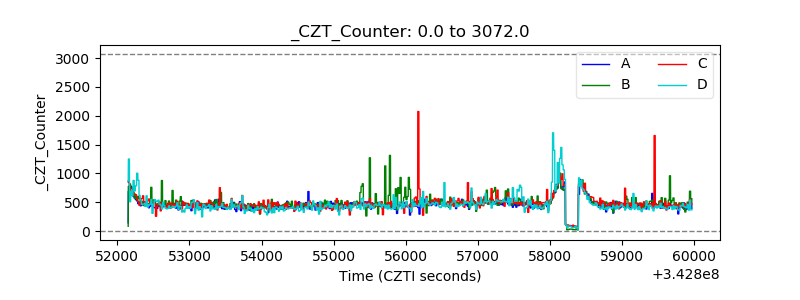 |
| +2.5 Volts monitor |  |
| +5 Volts monitor |  |
| _ROLL_ROT | 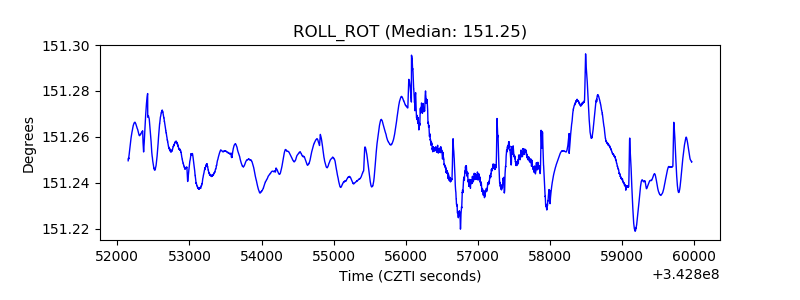 |
| _Roll_DEC | 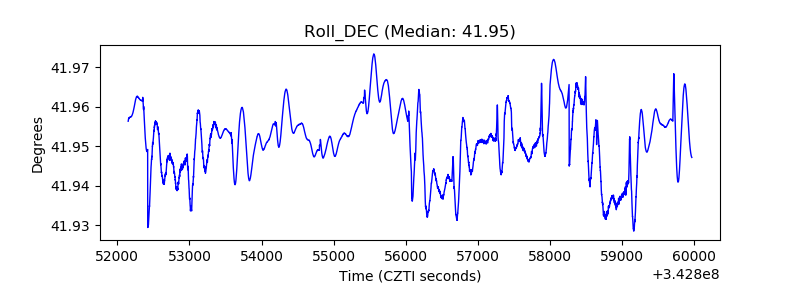 |
| _Roll_RA | 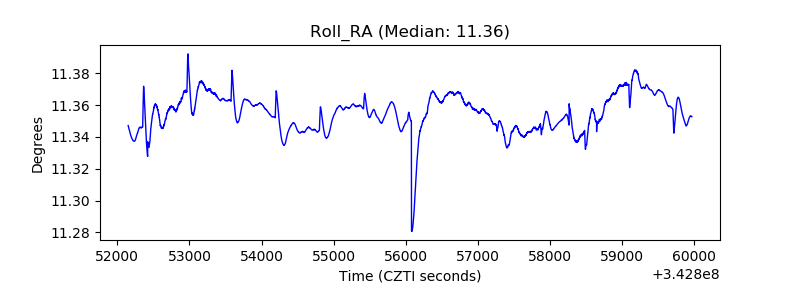 |
| Veto Counter | 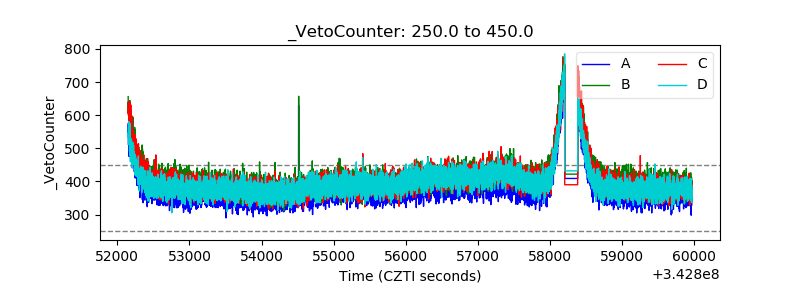 |