| Param | Original file | Final file |
|---|---|---|
| Filename | modeM0/AS1T03_262T01_9000003988_27713cztM0_level2.evt | modeM0/AS1T03_262T01_9000003988_27713cztM0_level2_quad_clean.evt |
| Size (bytes) | 1,288,270,080 | 240,543,360 |
| Size | 1.2 GB | 229.4 MB |
| Events in quadrant A | 8,777,289 | 1,531,770 |
| Events in quadrant B | 9,255,574 | 1,538,491 |
| Events in quadrant C | 9,109,071 | 1,484,193 |
| Events in quadrant D | 10,601,026 | 1,434,787 |
| Mode M0 | |||
|---|---|---|---|
| Quadrant | BADHDUFLAG | Total packets | Discarded packets |
| A | 0 | 38263 | 0 |
| B | 0 | 39084 | 0 |
| C | 0 | 38652 | 0 |
| D | 0 | 44394 | 0 |
| Mode M9 | |||
|---|---|---|---|
| Quadrant | BADHDUFLAG | Total packets | Discarded packets |
| A | 0 | 15 | 0 |
| B | 0 | 15 | 0 |
| C | 0 | 15 | 0 |
| D | 0 | 15 | 0 |
| Quadrant | Total seconds | Saturated seconds | Saturation percentage |
|---|---|---|---|
| A | 18805 | 281 | 1.494283% |
| B | 18805 | 326 | 1.733581% |
| C | 18805 | 370 | 1.967562% |
| D | 18805 | 569 | 3.025791% |
Noise dominated data is calculated using 1-second bins in cleaned event files. If a bin has >2000 counts, and if more than 50% of those come from <1% of pixels, then it is considered to be noise-dominated and hence unusable.
| Quadrant | # 1 sec bins | Bins with >0 counts | Bins with >2000 counts | High rate bins dominated by noise | Noise dominated (total time) | Noise dominated (detector-on time) | Marked lightcurve |
|---|---|---|---|---|---|---|---|
| A | 20400 | 18805 | 0 | 0 | 0.00% | 0.00% | 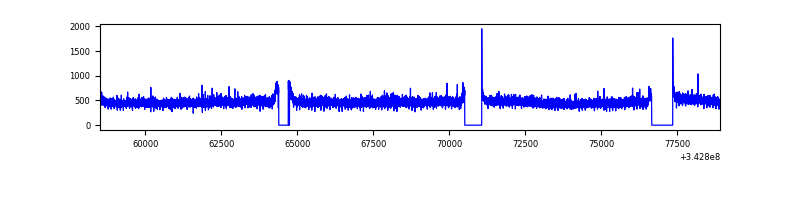 |
| B | 20400 | 18805 | 12 | 12 | 0.06% | 0.06% | 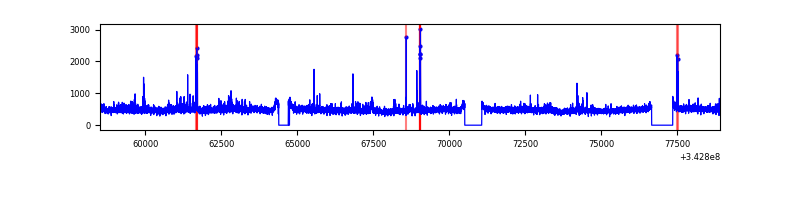 |
| C | 20400 | 18805 | 0 | 0 | 0.00% | 0.00% |  |
| D | 20400 | 18805 | 353 | 353 | 1.73% | 1.88% | 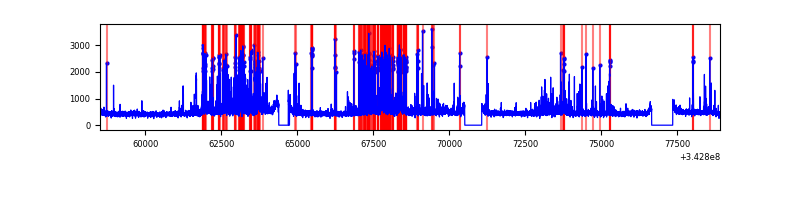 |
Top three noisy pixels from each quadrant. If the there are fewer than three noisy pixels in the level2.evt file, extra rows are filled as -1
| Pixel properties | Quadrant properties | ||||||
|---|---|---|---|---|---|---|---|
| Quadrant | DetID | PixID | Counts | Sigma | Mean | Median | Sigma |
| A | 6 | 16 | 45616 | 95.71 | 2260 | 2208 | 453.6 |
| A | 13 | 254 | 28322 | 57.58 | 2260 | 2208 | 453.6 |
| A | 3 | 137 | 22750 | 45.29 | 2260 | 2208 | 453.6 |
| B | 3 | 112 | 173076 | 398.65 | 2240 | 2181 | 428.7 |
| B | 15 | 32 | 98869 | 225.55 | 2240 | 2181 | 428.7 |
| B | 0 | 230 | 77167 | 174.92 | 2240 | 2181 | 428.7 |
| C | 14 | 238 | 344693 | 672.76 | 2174 | 2181 | 509.1 |
| C | 3 | 233 | 190705 | 370.3 | 2174 | 2181 | 509.1 |
| C | 15 | 208 | 45526 | 85.14 | 2174 | 2181 | 509.1 |
| D | 1 | 52 | 1734027 | 3322.34 | 2177 | 2114 | 521.3 |
| D | 11 | 176 | 331419 | 631.71 | 2177 | 2114 | 521.3 |
| D | 2 | 250 | 221346 | 420.55 | 2177 | 2114 | 521.3 |
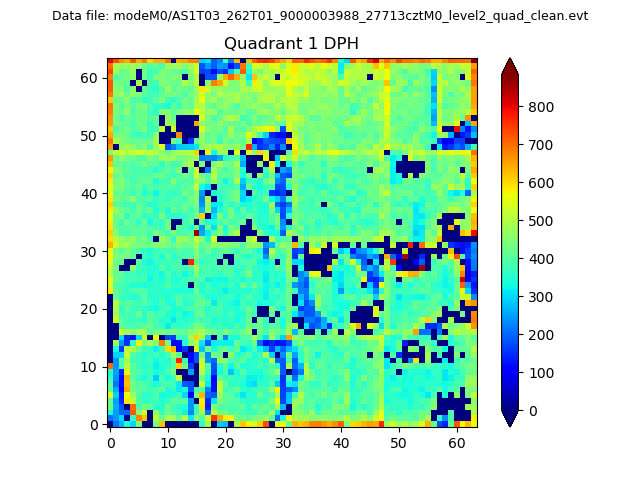
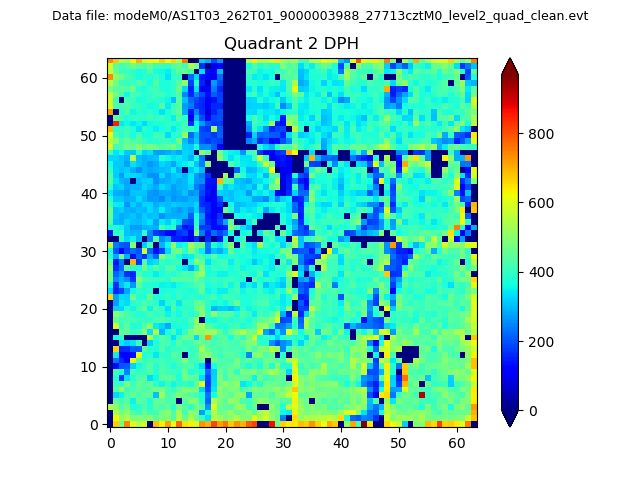
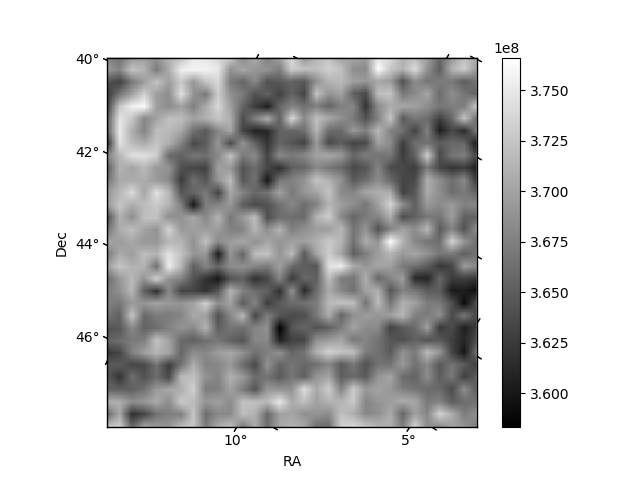
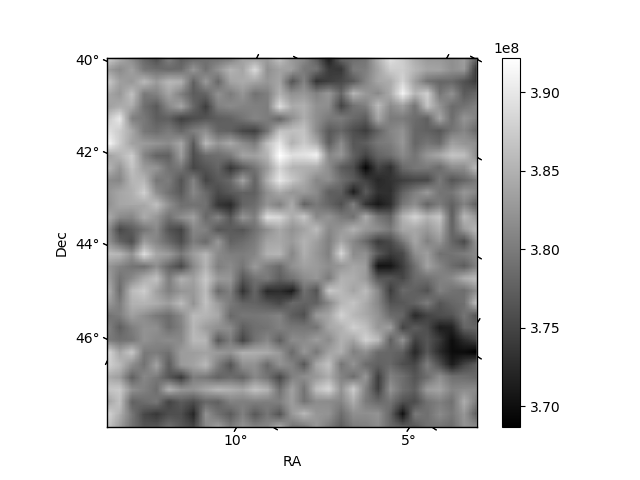
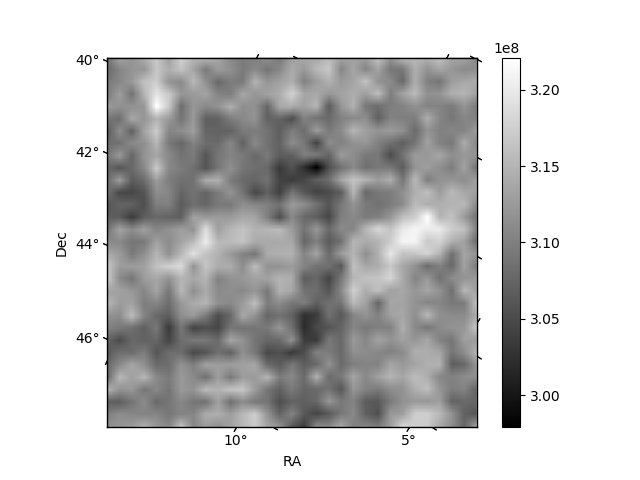
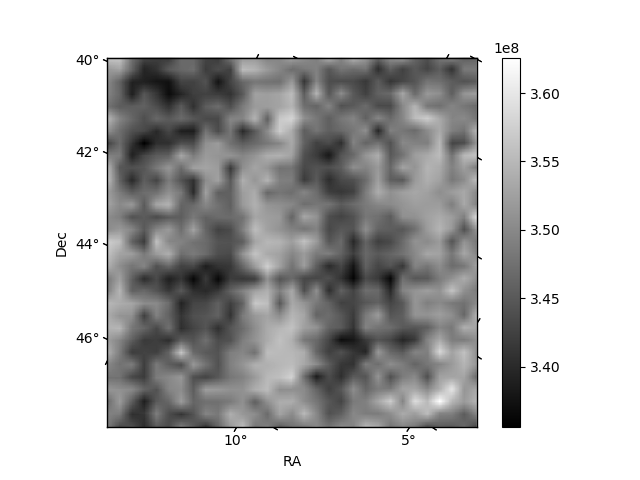
Histogram calculated using DETX and DETY for each event in the final _common_clean file
| Quadrant A |  |
 |
Quadrant B |
|---|---|---|---|
| Quadrant D | 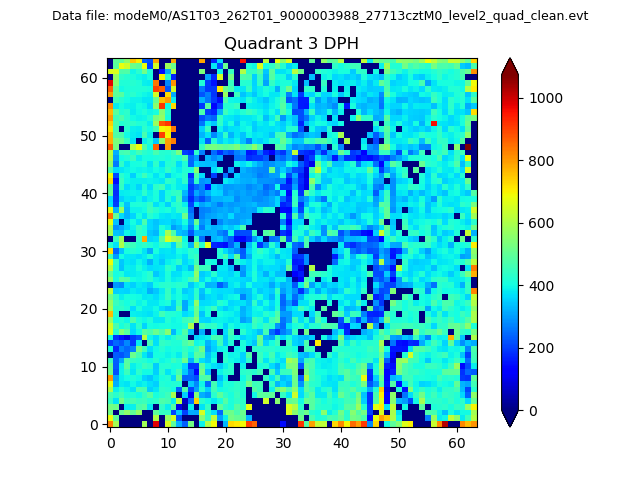 |
 |
Quadrant C |
| Plot type | Count rate plots | Images |
|---|---|---|
| Comparison with Poisson distribution Blue bars denote a histogram of data divided into 1 sec bins. Red curve is a Poisson curve with rate = median count rate of data. |
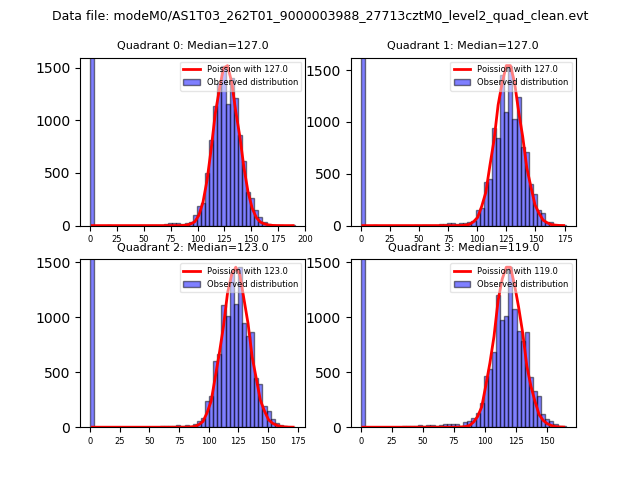 |
 |
| Quadrant-wise count rates Data is divided into 100 sec bins |
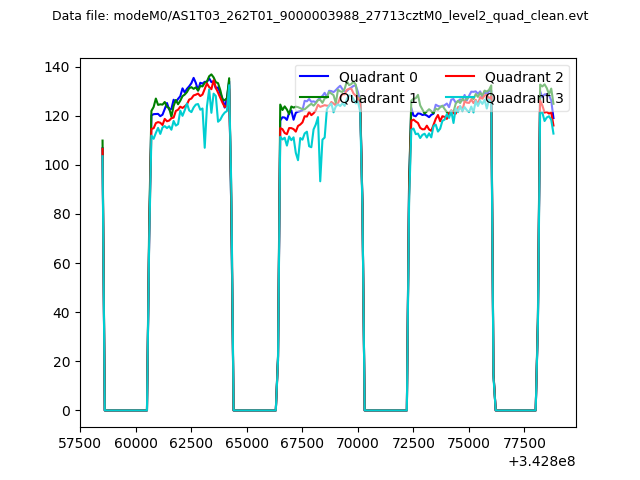 |
|
| Module-wise count rates for Quadrant A Data is divided into 100 sec bins |
 |
 |
| Module-wise count rates for Quadrant B Data is divided into 100 sec bins |
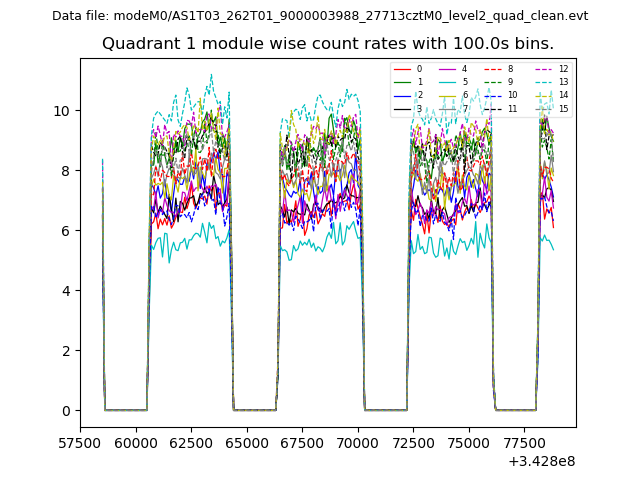 |
 |
| Module-wise count rates for Quadrant C Data is divided into 100 sec bins |
 |
 |
| Module-wise count rates for Quadrant D Data is divided into 100 sec bins |
 |
 |
| Parameter | Plot |
|---|---|
| CZT HV Monitor | 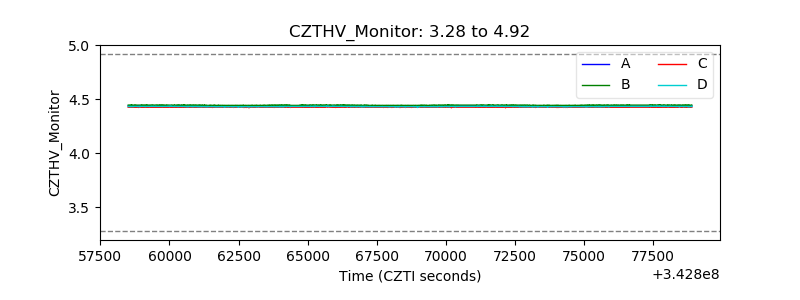 |
| D_VDD | 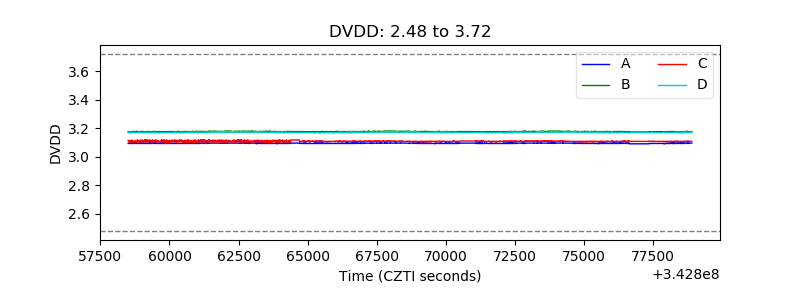 |
| Temperature 1 | 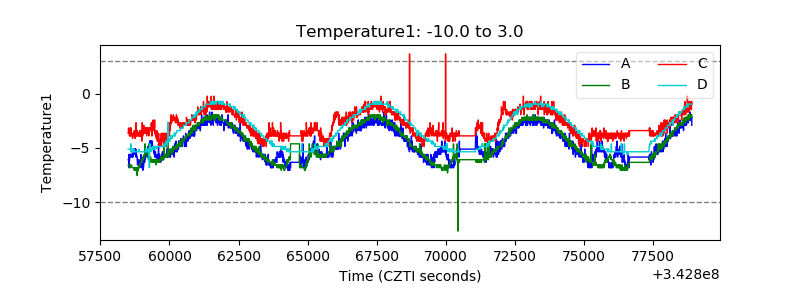 |
| Veto HV Monitor | 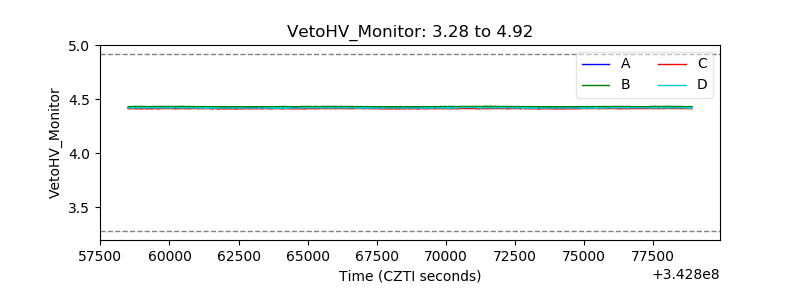 |
| Veto LLD | 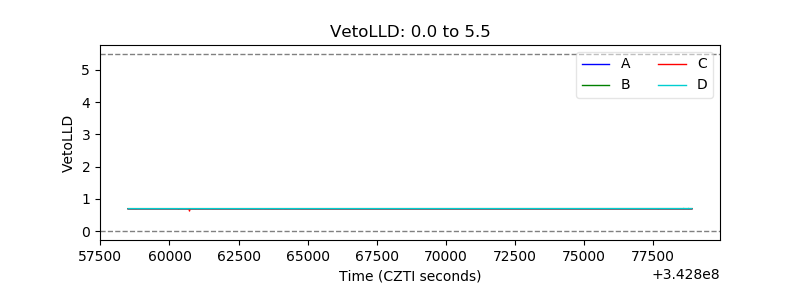 |
| Alpha Counter | 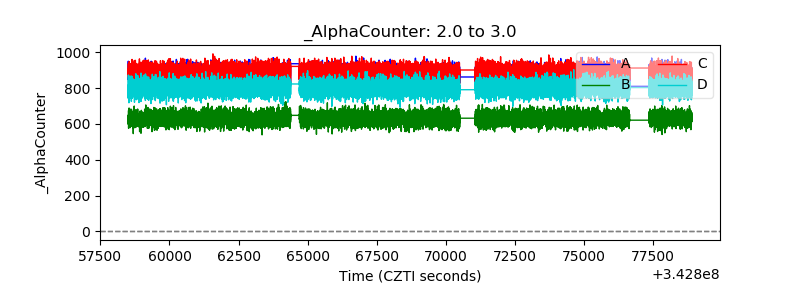 |
| _CPM_Rate | 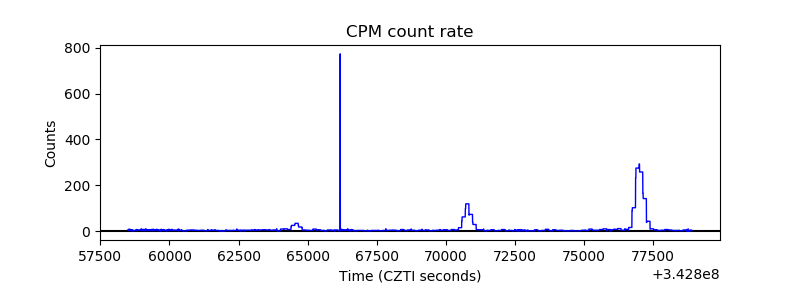 |
| CZT Counter | 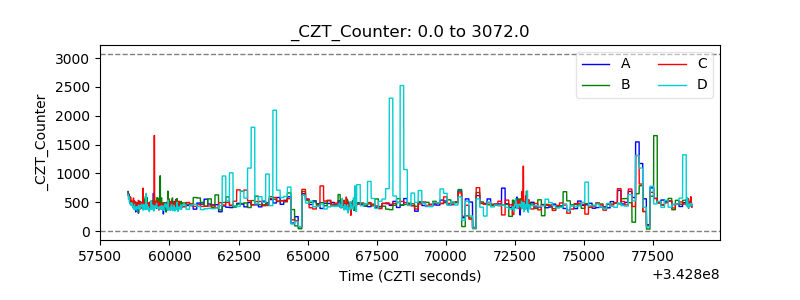 |
| +2.5 Volts monitor |  |
| +5 Volts monitor |  |
| _ROLL_ROT | 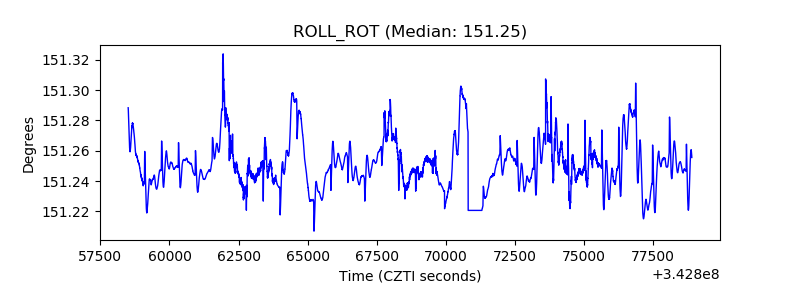 |
| _Roll_DEC | 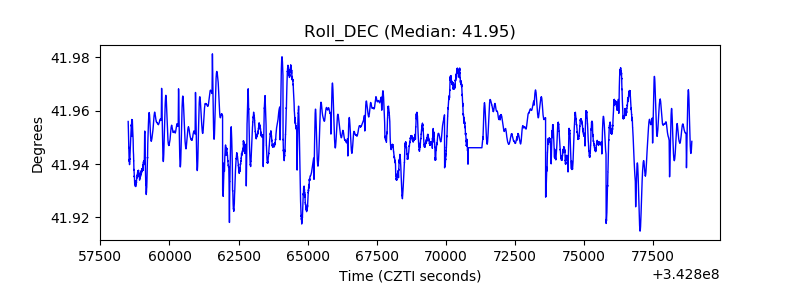 |
| _Roll_RA | 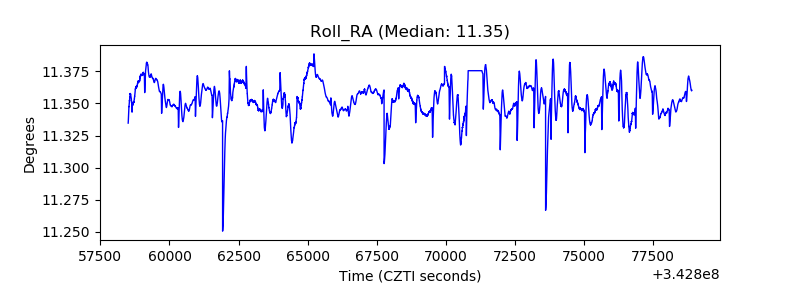 |
| Veto Counter | 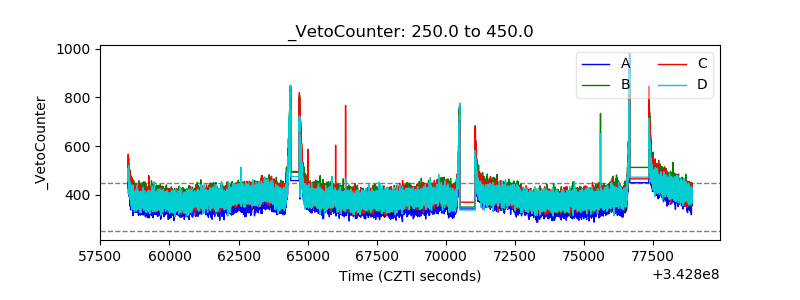 |