| Param | Original file | Final file |
|---|---|---|
| Filename | modeM0/AS1T03_262T01_9000003988_27714cztM0_level2.evt | modeM0/AS1T03_262T01_9000003988_27714cztM0_level2_quad_clean.evt |
| Size (bytes) | 428,535,360 | 96,154,560 |
| Size | 408.7 MB | 91.7 MB |
| Events in quadrant A | 2,987,083 | 631,406 |
| Events in quadrant B | 3,102,928 | 636,216 |
| Events in quadrant C | 3,044,495 | 608,648 |
| Events in quadrant D | 3,415,579 | 596,384 |
| Mode M0 | |||
|---|---|---|---|
| Quadrant | BADHDUFLAG | Total packets | Discarded packets |
| A | 0 | 12985 | 0 |
| B | 0 | 13156 | 0 |
| C | 0 | 12896 | 0 |
| D | 0 | 14473 | 0 |
| Mode M9 | |||
|---|---|---|---|
| Quadrant | BADHDUFLAG | Total packets | Discarded packets |
| A | 0 | 10 | 0 |
| B | 0 | 10 | 0 |
| C | 0 | 10 | 0 |
| D | 0 | 10 | 0 |
| Quadrant | Total seconds | Saturated seconds | Saturation percentage |
|---|---|---|---|
| A | 6303 | 44 | 0.698080% |
| B | 6304 | 39 | 0.618655% |
| C | 6303 | 73 | 1.158179% |
| D | 6303 | 127 | 2.014914% |
Noise dominated data is calculated using 1-second bins in cleaned event files. If a bin has >2000 counts, and if more than 50% of those come from <1% of pixels, then it is considered to be noise-dominated and hence unusable.
| Quadrant | # 1 sec bins | Bins with >0 counts | Bins with >2000 counts | High rate bins dominated by noise | Noise dominated (total time) | Noise dominated (detector-on time) | Marked lightcurve |
|---|---|---|---|---|---|---|---|
| A | 7228 | 6303 | 1 | 1 | 0.01% | 0.02% | 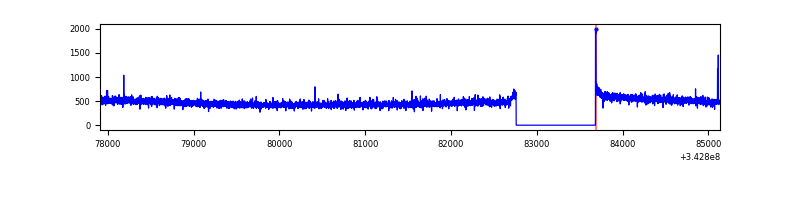 |
| B | 7229 | 6304 | 0 | 0 | 0.00% | 0.00% | 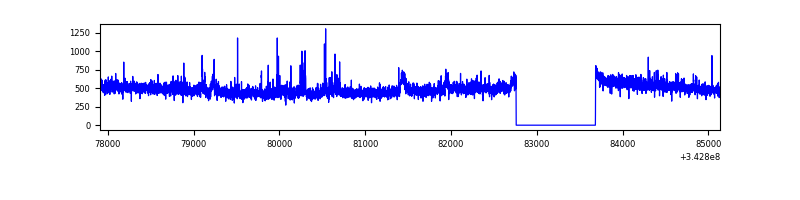 |
| C | 7228 | 6303 | 0 | 0 | 0.00% | 0.00% | 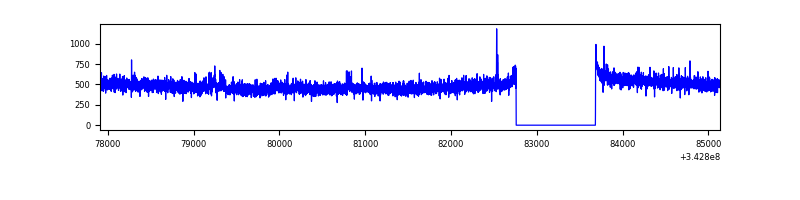 |
| D | 7228 | 6303 | 92 | 92 | 1.27% | 1.46% | 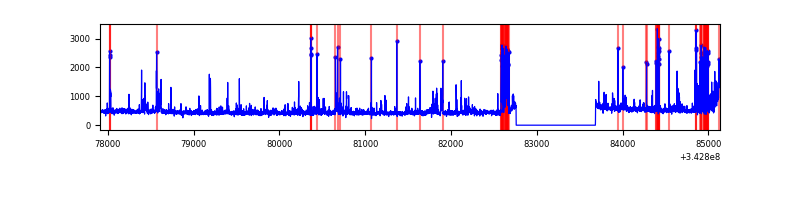 |
Top three noisy pixels from each quadrant. If the there are fewer than three noisy pixels in the level2.evt file, extra rows are filled as -1
| Pixel properties | Quadrant properties | ||||||
|---|---|---|---|---|---|---|---|
| Quadrant | DetID | PixID | Counts | Sigma | Mean | Median | Sigma |
| A | 13 | 254 | 8655 | 51.03 | 769 | 753 | 154.9 |
| A | 3 | 137 | 7526 | 43.74 | 769 | 753 | 154.9 |
| A | 8 | 192 | 7381 | 42.8 | 769 | 753 | 154.9 |
| B | 5 | 255 | 48541 | 328.65 | 759 | 740 | 145.4 |
| B | 12 | 111 | 18199 | 120.04 | 759 | 740 | 145.4 |
| B | 0 | 230 | 17646 | 116.24 | 759 | 740 | 145.4 |
| C | 14 | 238 | 118616 | 683.3 | 736 | 740 | 172.5 |
| C | 3 | 233 | 45272 | 258.14 | 736 | 740 | 172.5 |
| C | 15 | 208 | 6967 | 36.1 | 736 | 740 | 172.5 |
| D | 1 | 52 | 404985 | 2327.34 | 739 | 720 | 173.7 |
| D | 11 | 176 | 148416 | 850.28 | 739 | 720 | 173.7 |
| D | 2 | 250 | 37656 | 212.64 | 739 | 720 | 173.7 |
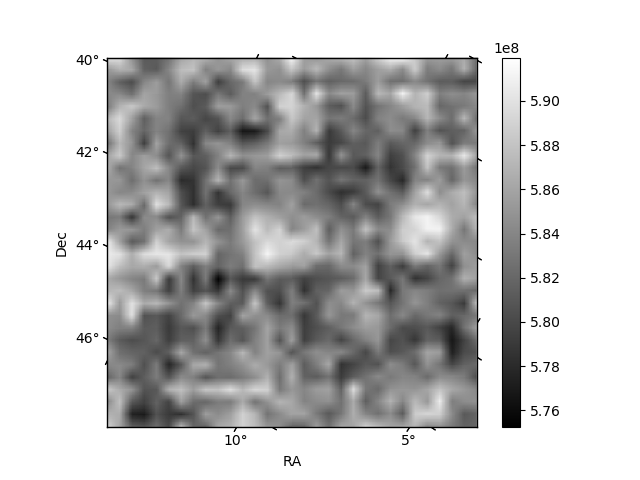
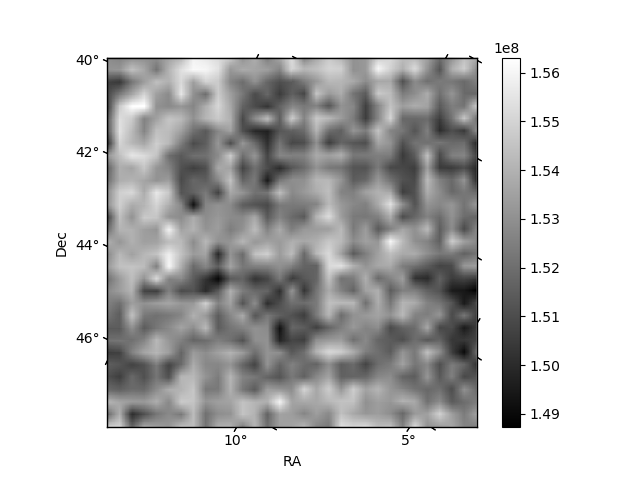
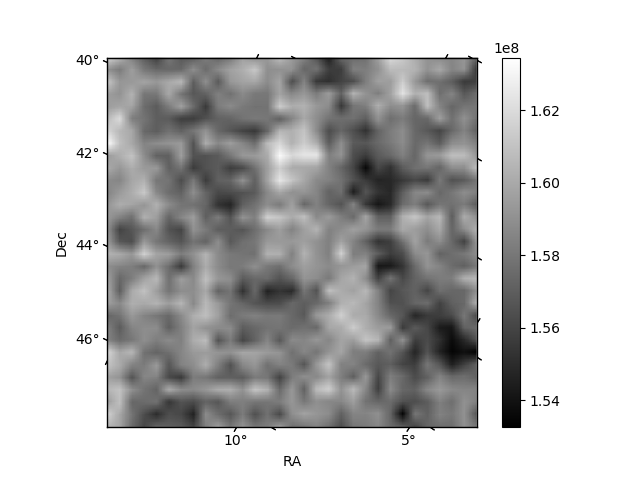
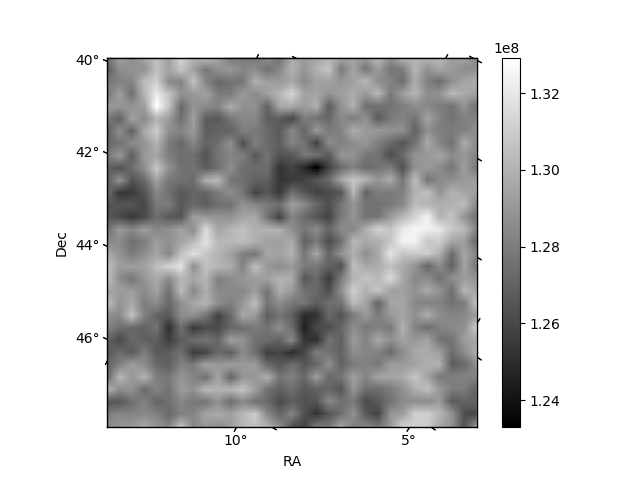
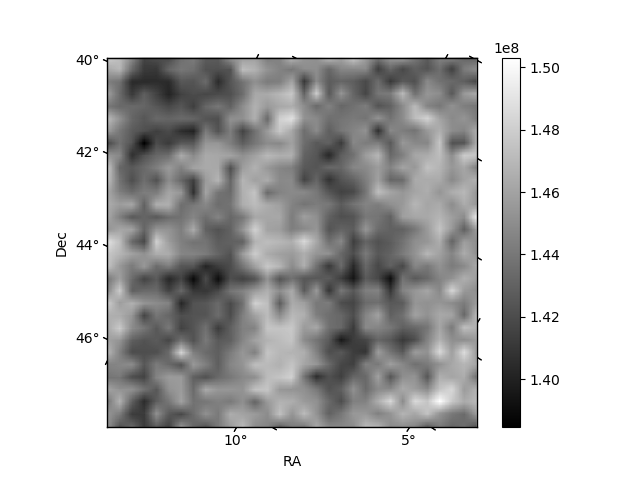
Histogram calculated using DETX and DETY for each event in the final _common_clean file
| Quadrant A |  |
 |
Quadrant B |
|---|---|---|---|
| Quadrant D |  |
 |
Quadrant C |
| Plot type | Count rate plots | Images |
|---|---|---|
| Comparison with Poisson distribution Blue bars denote a histogram of data divided into 1 sec bins. Red curve is a Poisson curve with rate = median count rate of data. |
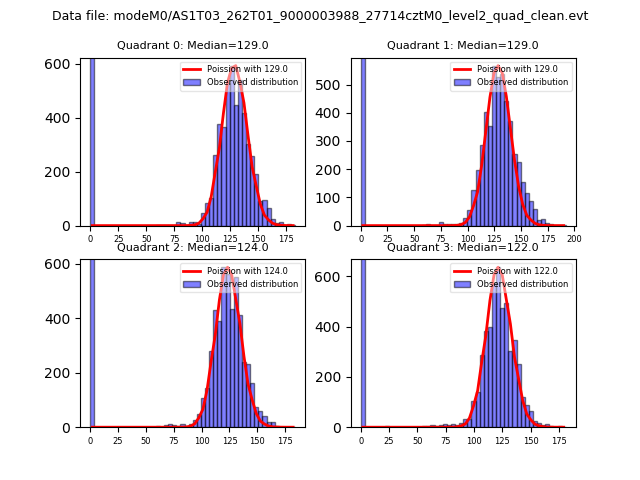 |
 |
| Quadrant-wise count rates Data is divided into 100 sec bins |
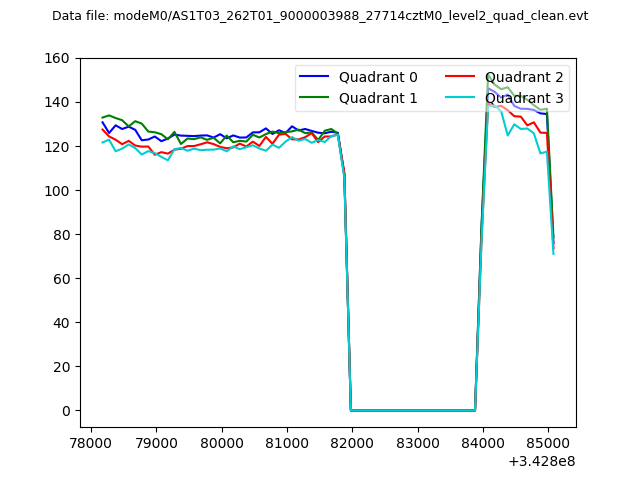 |
|
| Module-wise count rates for Quadrant A Data is divided into 100 sec bins |
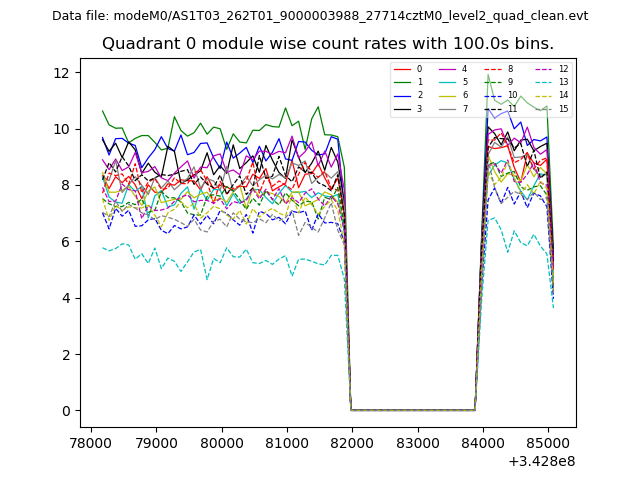 |
 |
| Module-wise count rates for Quadrant B Data is divided into 100 sec bins |
 |
 |
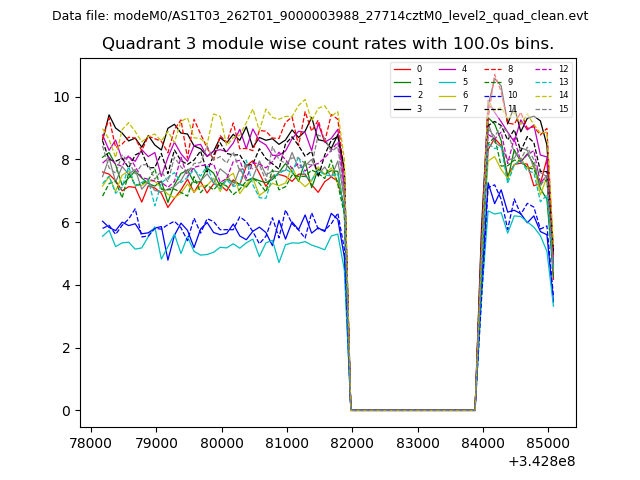
| Module-wise count rates for Quadrant C Data is divided into 100 sec bins |
 |
 |
| Module-wise count rates for Quadrant D Data is divided into 100 sec bins |
 |
 |
| Parameter | Plot |
|---|---|
| CZT HV Monitor |  |
| D_VDD | 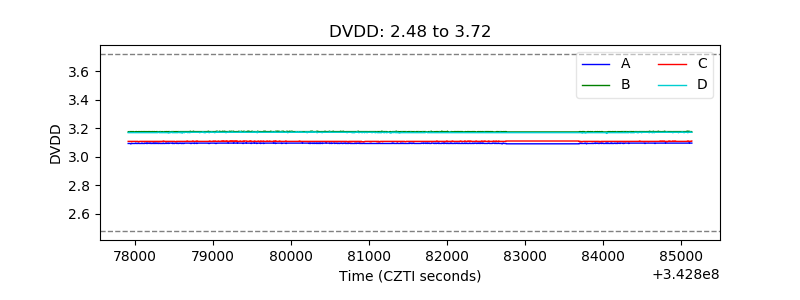 |
| Temperature 1 | 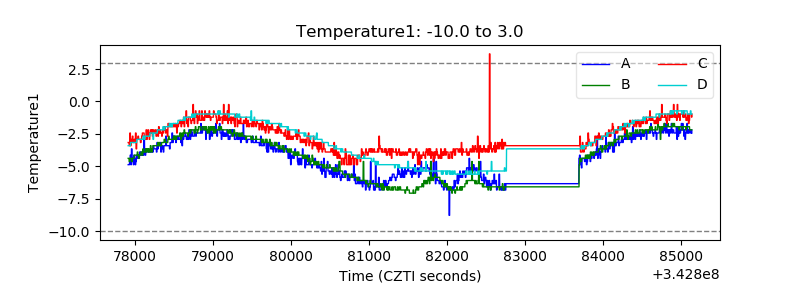 |
| Veto HV Monitor | 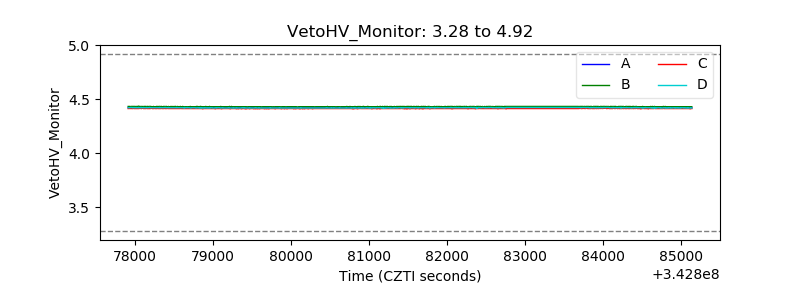 |
| Veto LLD | 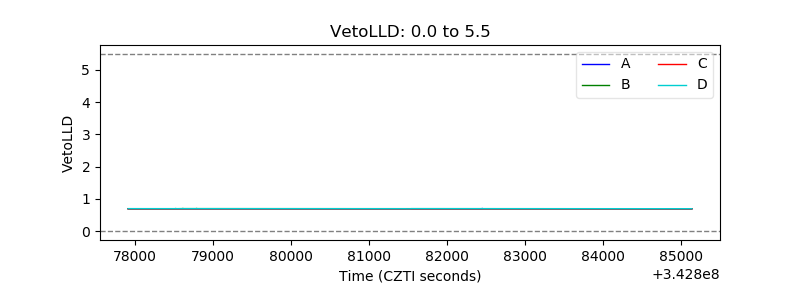 |
| Alpha Counter | 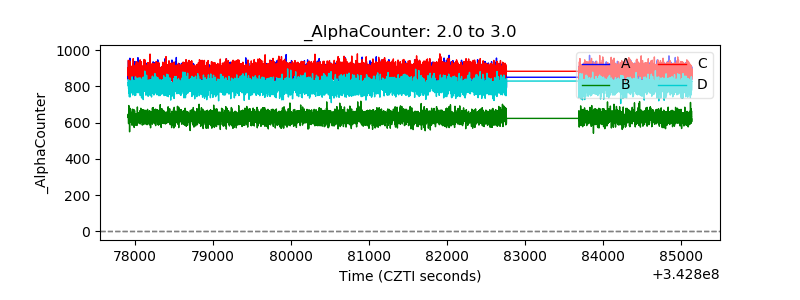 |
| _CPM_Rate | 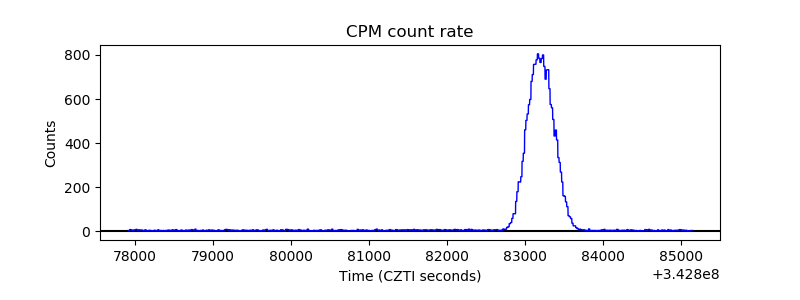 |
| CZT Counter | 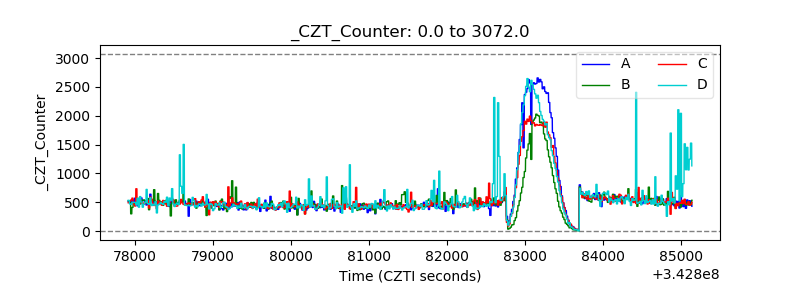 |
| +2.5 Volts monitor |  |
| +5 Volts monitor | 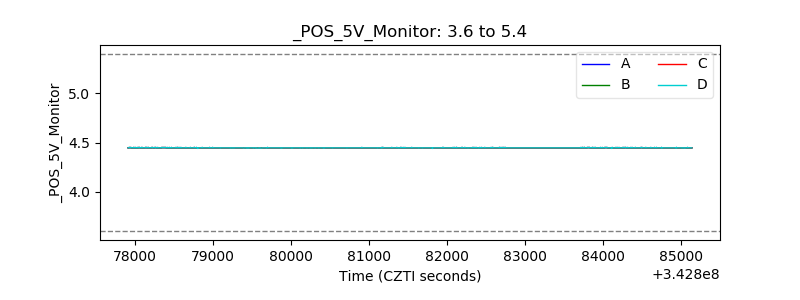 |
| _ROLL_ROT | 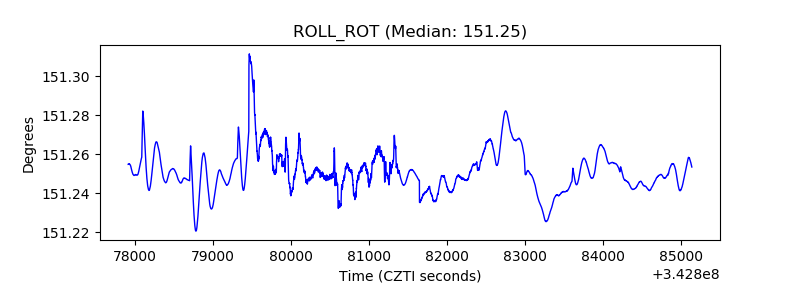 |
| _Roll_DEC | 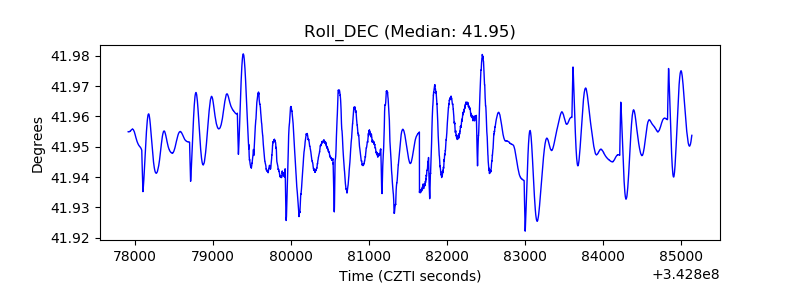 |
| _Roll_RA | 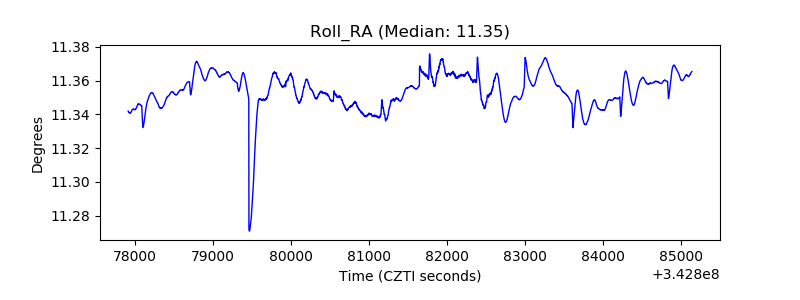 |
| Veto Counter | 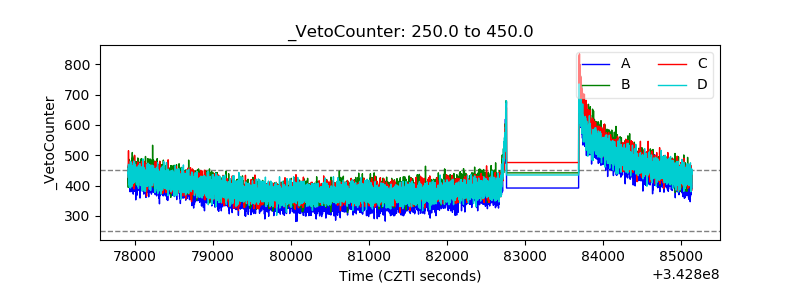 |