| Param | Original file | Final file |
|---|---|---|
| Filename | modeM0/AS1T03_262T01_9000003988_27717cztM0_level2.evt | modeM0/AS1T03_262T01_9000003988_27717cztM0_level2_quad_clean.evt |
| Size (bytes) | 512,225,280 | 114,177,600 |
| Size | 488.5 MB | 108.9 MB |
| Events in quadrant A | 3,340,076 | 774,989 |
| Events in quadrant B | 3,500,633 | 773,598 |
| Events in quadrant C | 3,446,424 | 744,753 |
| Events in quadrant D | 4,786,075 | 712,640 |
| Mode M0 | |||
|---|---|---|---|
| Quadrant | BADHDUFLAG | Total packets | Discarded packets |
| A | 0 | 14257 | 0 |
| B | 0 | 14671 | 0 |
| C | 0 | 14394 | 0 |
| D | 0 | 18879 | 0 |
| Mode M9 | |||
|---|---|---|---|
| Quadrant | BADHDUFLAG | Total packets | Discarded packets |
| A | 0 | 13 | 0 |
| B | 0 | 14 | 0 |
| C | 0 | 14 | 0 |
| D | 0 | 14 | 0 |
| Quadrant | Total seconds | Saturated seconds | Saturation percentage |
|---|---|---|---|
| A | 6479 | 68 | 1.049545% |
| B | 6479 | 81 | 1.250193% |
| C | 6479 | 130 | 2.006482% |
| D | 6479 | 260 | 4.012965% |
Noise dominated data is calculated using 1-second bins in cleaned event files. If a bin has >2000 counts, and if more than 50% of those come from <1% of pixels, then it is considered to be noise-dominated and hence unusable.
| Quadrant | # 1 sec bins | Bins with >0 counts | Bins with >2000 counts | High rate bins dominated by noise | Noise dominated (total time) | Noise dominated (detector-on time) | Marked lightcurve |
|---|---|---|---|---|---|---|---|
| A | 7644 | 6479 | 2 | 2 | 0.03% | 0.03% | 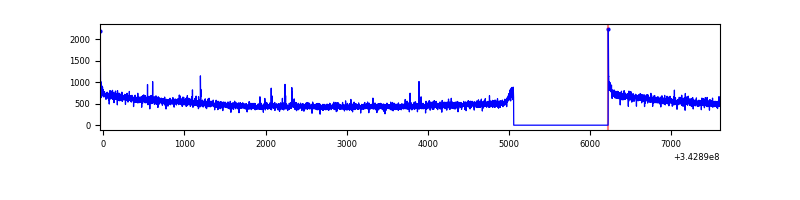 |
| B | 7644 | 6479 | 14 | 14 | 0.18% | 0.22% | 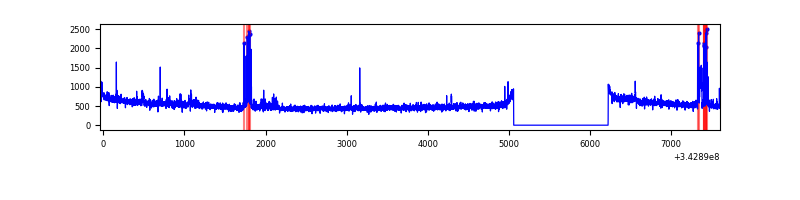 |
| C | 7644 | 6479 | 13 | 13 | 0.17% | 0.20% | 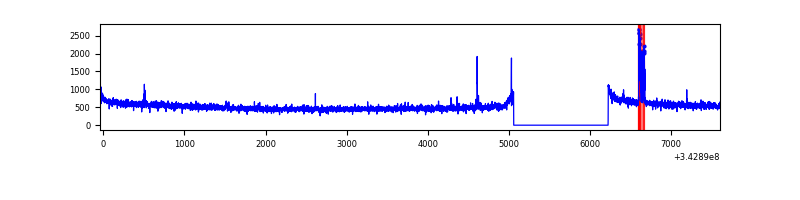 |
| D | 7644 | 6479 | 213 | 213 | 2.79% | 3.29% | 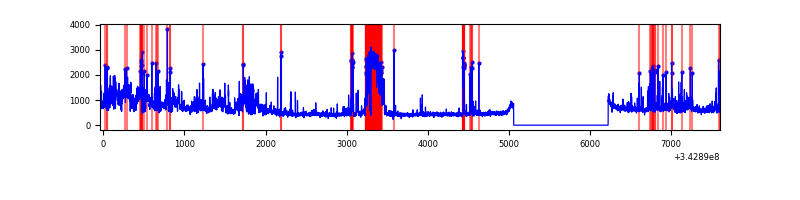 |
Top three noisy pixels from each quadrant. If the there are fewer than three noisy pixels in the level2.evt file, extra rows are filled as -1
| Pixel properties | Quadrant properties | ||||||
|---|---|---|---|---|---|---|---|
| Quadrant | DetID | PixID | Counts | Sigma | Mean | Median | Sigma |
| A | 6 | 16 | 23154 | 131.73 | 854 | 838 | 169.4 |
| A | 8 | 192 | 12626 | 69.59 | 854 | 838 | 169.4 |
| A | 0 | 13 | 11577 | 63.39 | 854 | 838 | 169.4 |
| B | 3 | 64 | 85197 | 542.5 | 839 | 820 | 155.5 |
| B | 0 | 230 | 83288 | 530.22 | 839 | 820 | 155.5 |
| B | 12 | 111 | 18534 | 113.89 | 839 | 820 | 155.5 |
| C | 14 | 238 | 129783 | 681.95 | 819 | 824 | 189.1 |
| C | 3 | 233 | 120362 | 632.13 | 819 | 824 | 189.1 |
| C | 15 | 208 | 5900 | 26.84 | 819 | 824 | 189.1 |
| D | 1 | 52 | 843394 | 4356.97 | 820 | 800 | 193.4 |
| D | 11 | 176 | 498874 | 2575.49 | 820 | 800 | 193.4 |
| D | 2 | 250 | 206290 | 1062.57 | 820 | 800 | 193.4 |
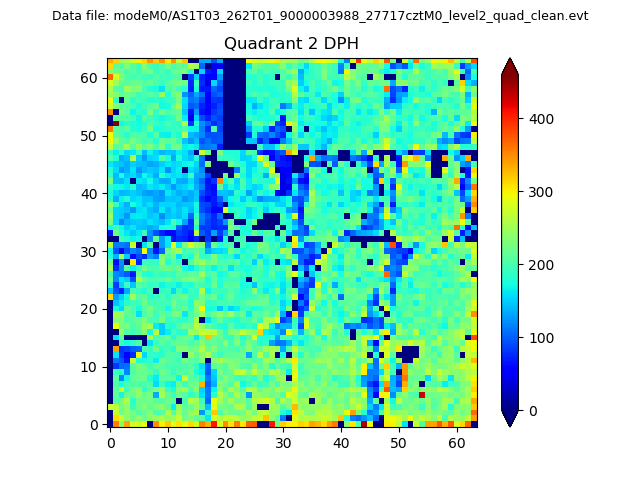
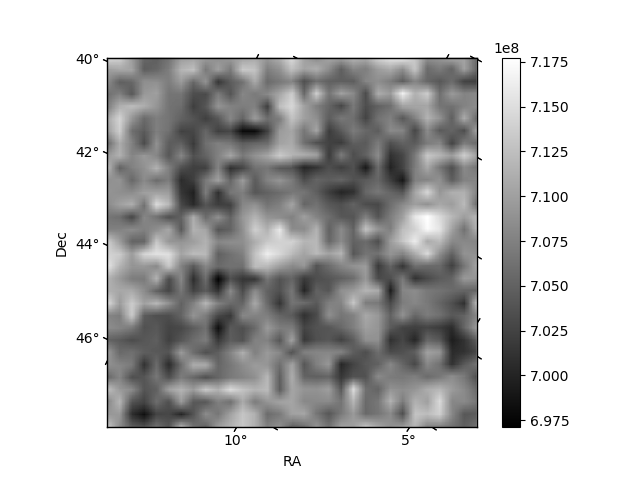
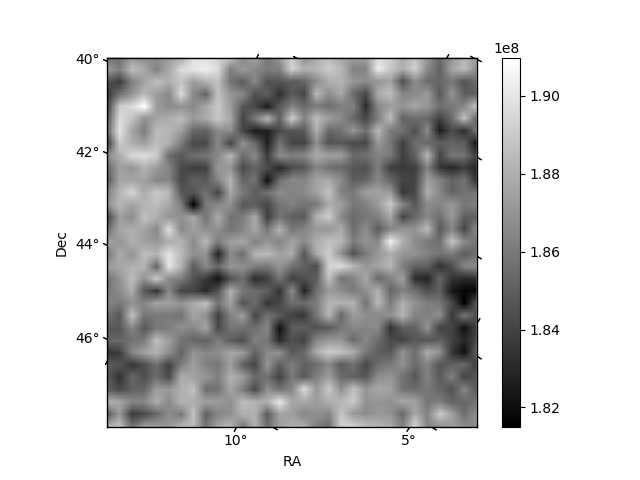
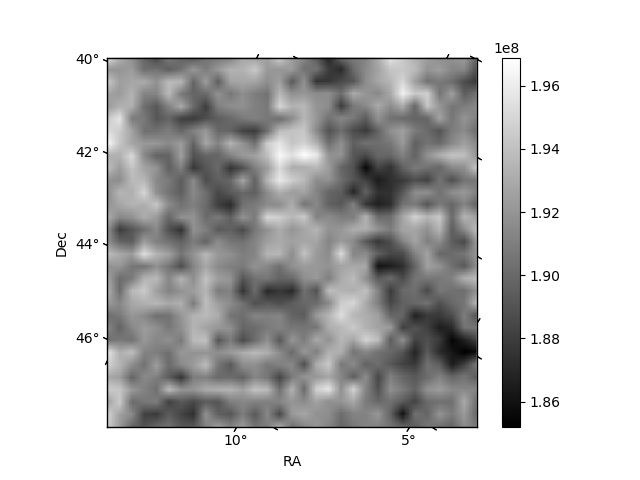
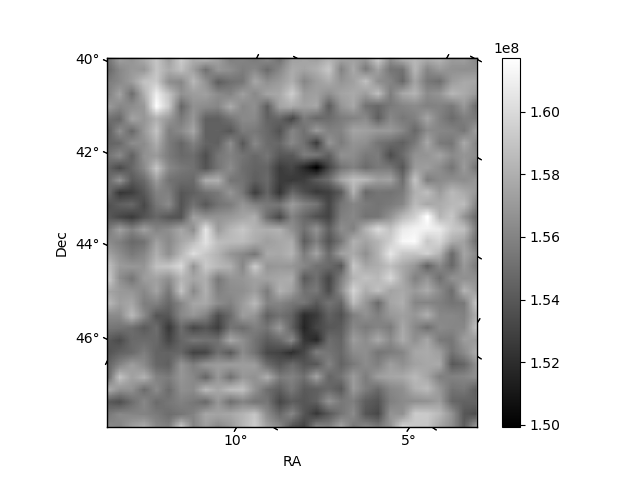
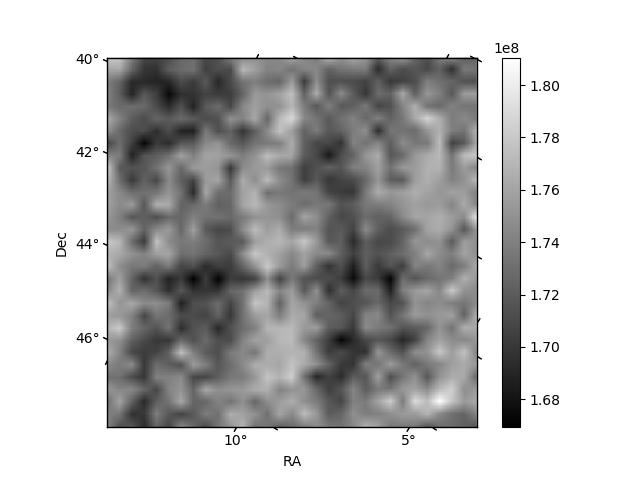
Histogram calculated using DETX and DETY for each event in the final _common_clean file
| Quadrant A | 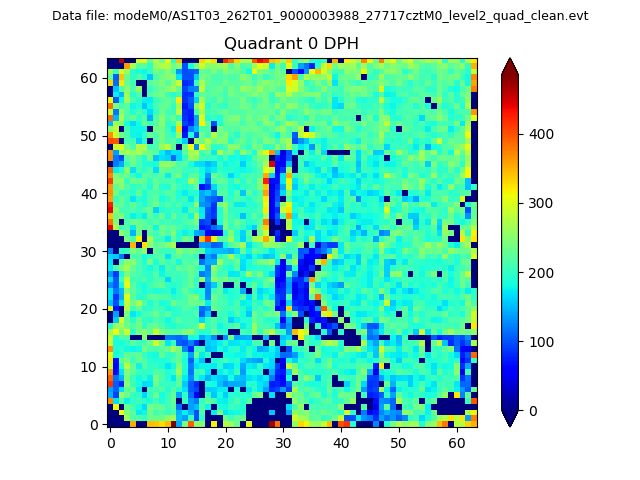 |
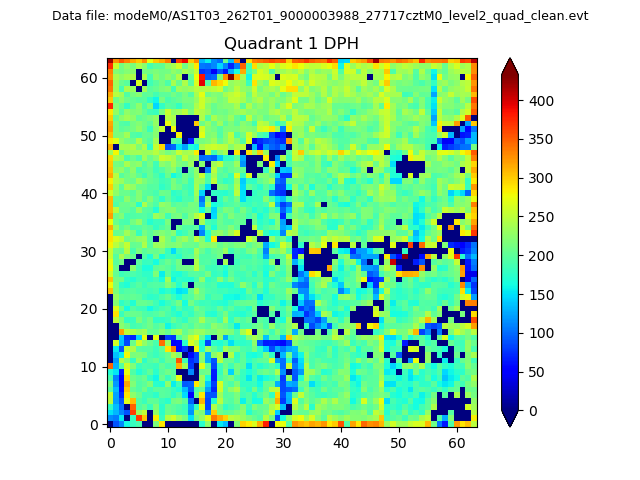 |
Quadrant B |
|---|---|---|---|
| Quadrant D | 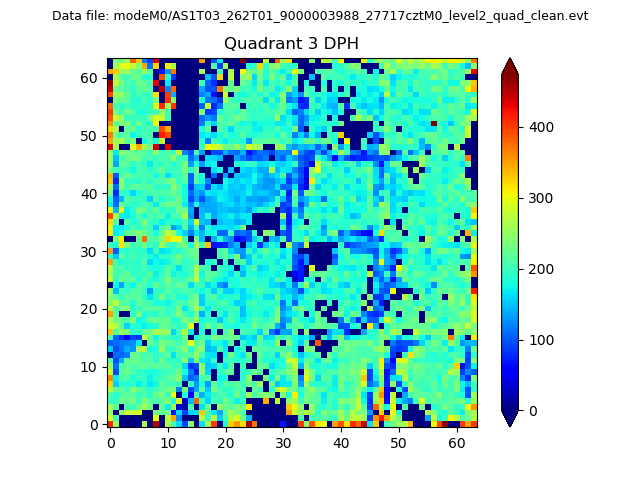 |
 |
Quadrant C |
| Plot type | Count rate plots | Images |
|---|---|---|
| Comparison with Poisson distribution Blue bars denote a histogram of data divided into 1 sec bins. Red curve is a Poisson curve with rate = median count rate of data. |
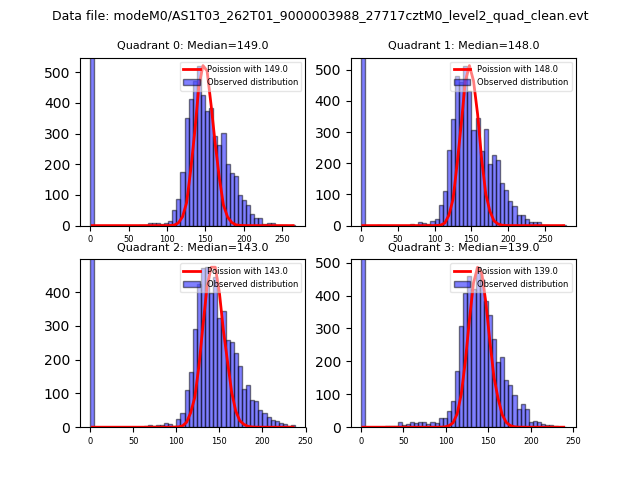 |
 |
| Quadrant-wise count rates Data is divided into 100 sec bins |
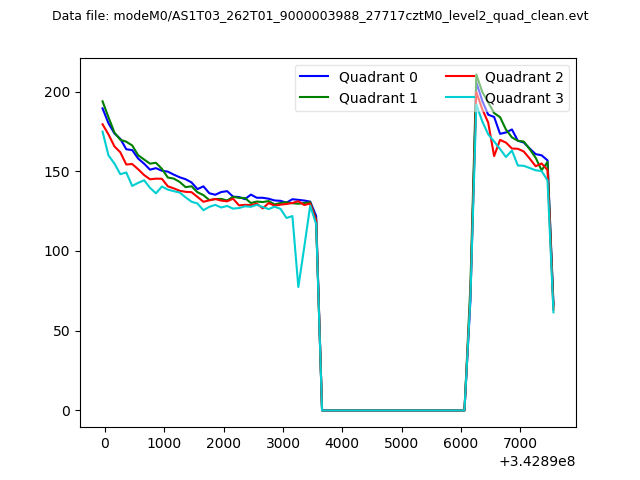 |
|
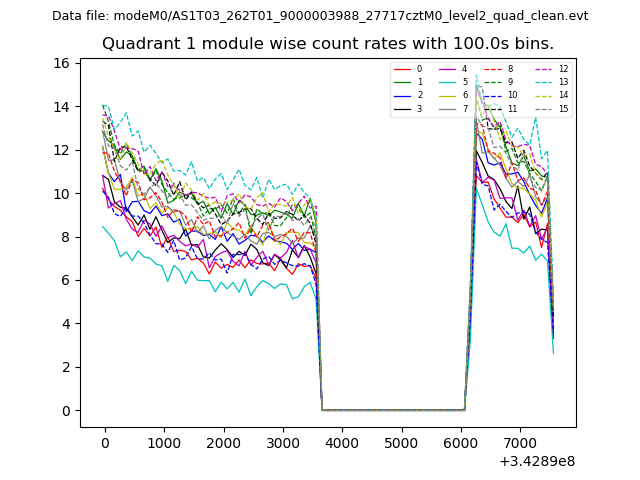
| Module-wise count rates for Quadrant A Data is divided into 100 sec bins |
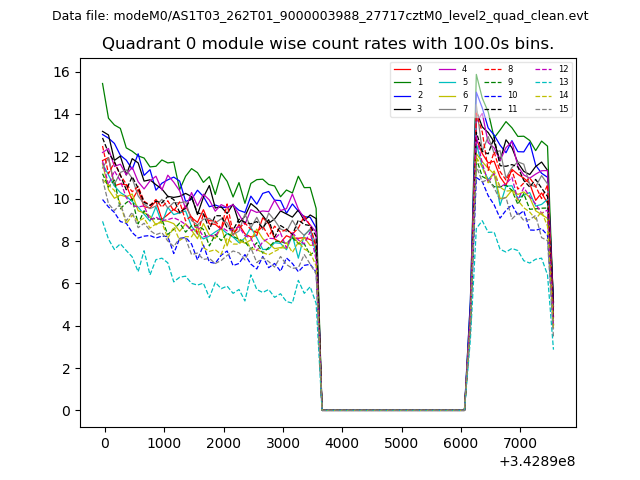 |
 |
| Module-wise count rates for Quadrant B Data is divided into 100 sec bins |
 |
 |
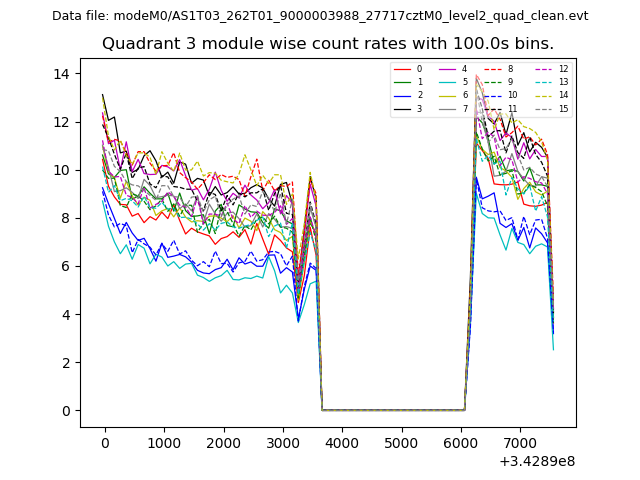
| Module-wise count rates for Quadrant C Data is divided into 100 sec bins |
 |
 |
| Module-wise count rates for Quadrant D Data is divided into 100 sec bins |
 |
 |
| Parameter | Plot |
|---|---|
| CZT HV Monitor | 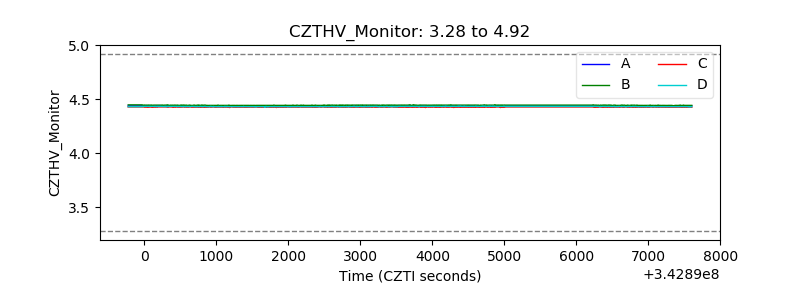 |
| D_VDD | 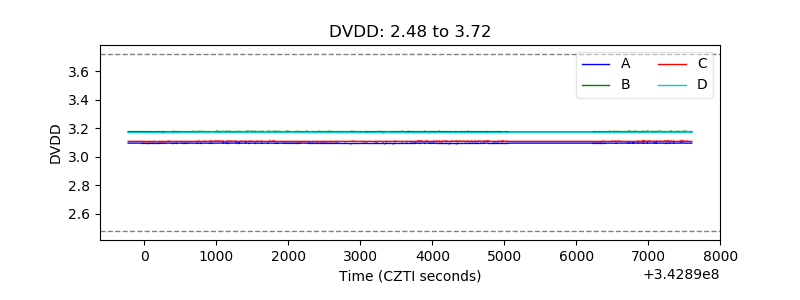 |
| Temperature 1 | 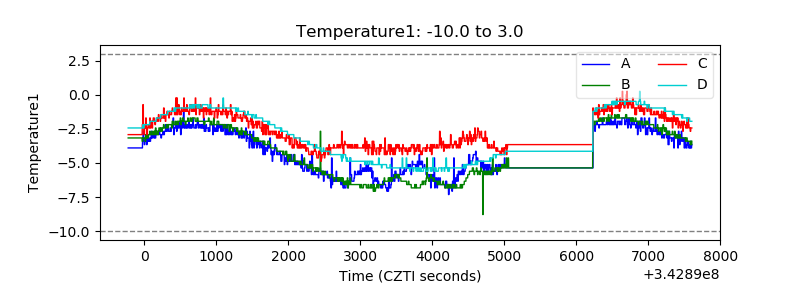 |
| Veto HV Monitor | 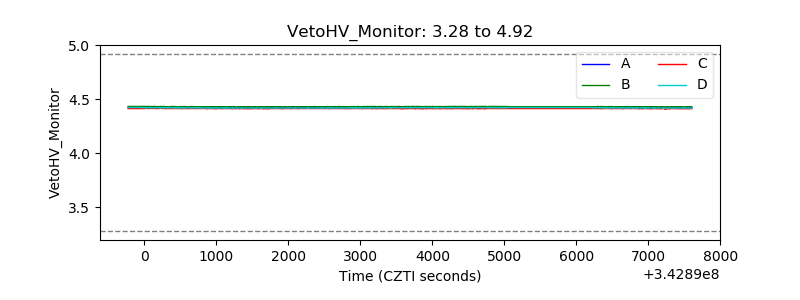 |
| Veto LLD | 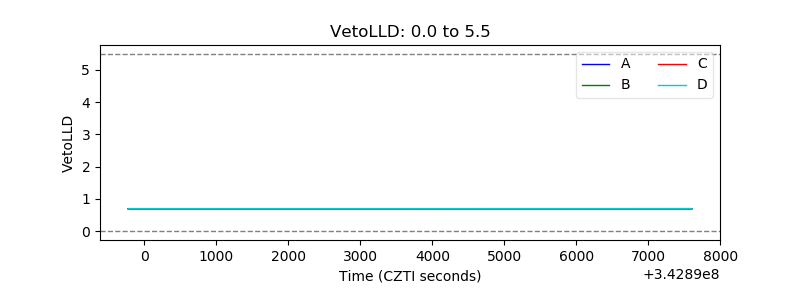 |
| Alpha Counter | 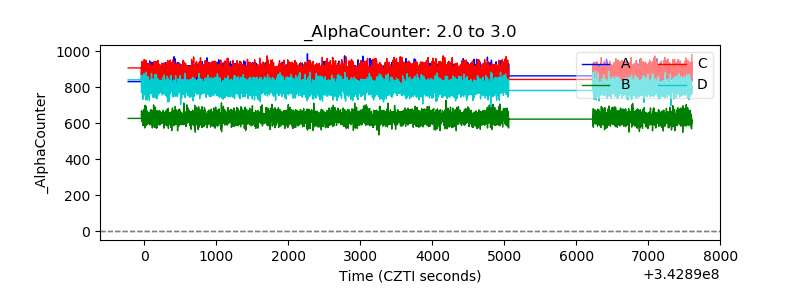 |
| _CPM_Rate | 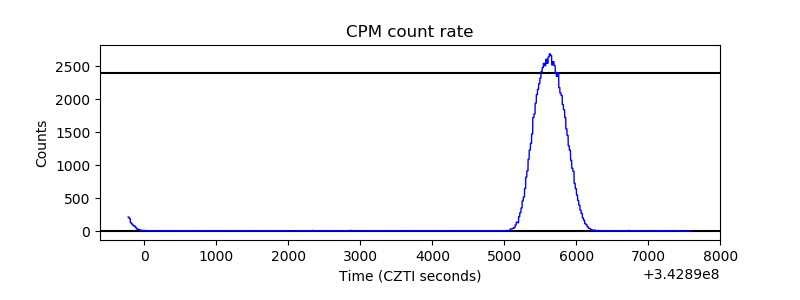 |
| CZT Counter | 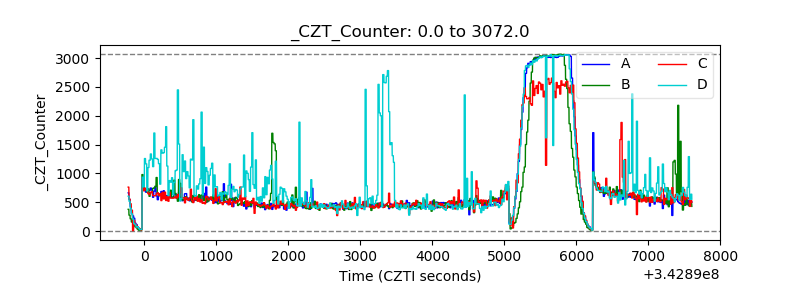 |
| +2.5 Volts monitor | 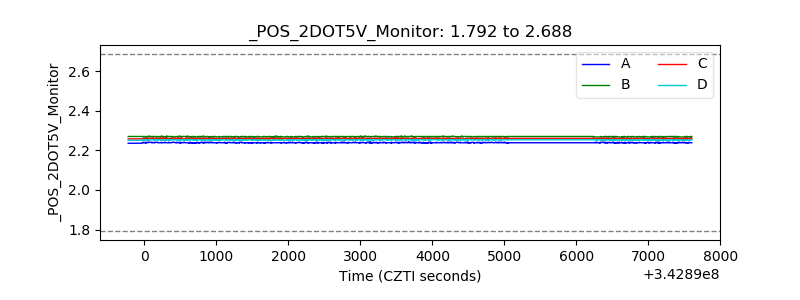 |
| +5 Volts monitor |  |
| _ROLL_ROT | 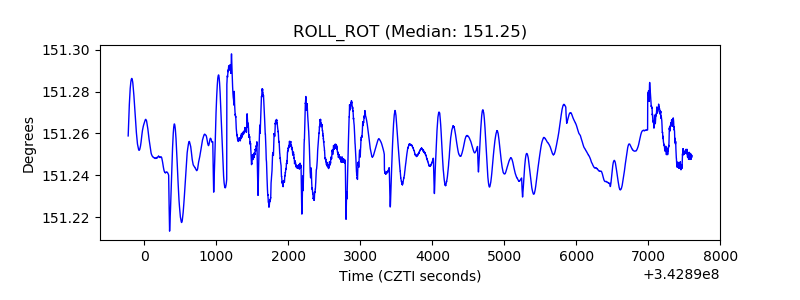 |
| _Roll_DEC | 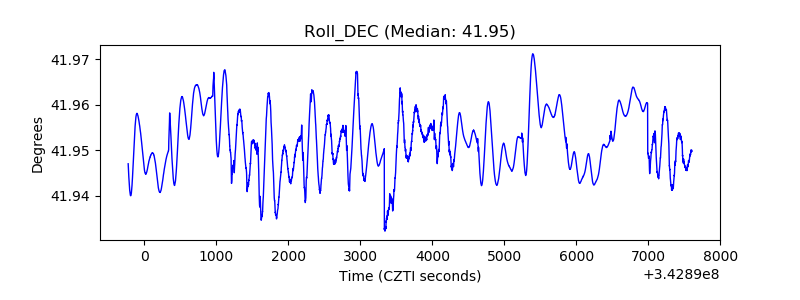 |
| _Roll_RA |  |
| Veto Counter | 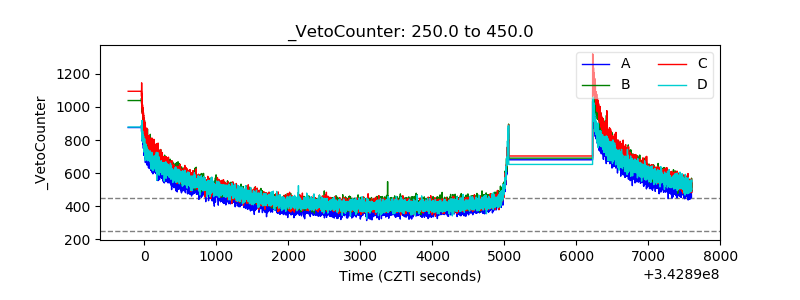 |