| Param | Original file | Final file |
|---|---|---|
| Filename | modeM0/AS1T03_262T01_9000003988_27719cztM0_level2.evt | modeM0/AS1T03_262T01_9000003988_27719cztM0_level2_quad_clean.evt |
| Size (bytes) | 415,071,360 | 93,352,320 |
| Size | 395.8 MB | 89.0 MB |
| Events in quadrant A | 2,906,137 | 624,868 |
| Events in quadrant B | 3,018,011 | 624,788 |
| Events in quadrant C | 3,064,506 | 602,526 |
| Events in quadrant D | 3,202,242 | 584,467 |
| Mode M0 | |||
|---|---|---|---|
| Quadrant | BADHDUFLAG | Total packets | Discarded packets |
| A | 0 | 12370 | 0 |
| B | 0 | 12622 | 0 |
| C | 0 | 12730 | 0 |
| D | 0 | 13464 | 0 |
| Mode M9 | |||
|---|---|---|---|
| Quadrant | BADHDUFLAG | Total packets | Discarded packets |
| A | 0 | 13 | 0 |
| B | 0 | 14 | 0 |
| C | 0 | 14 | 0 |
| D | 0 | 14 | 0 |
| Quadrant | Total seconds | Saturated seconds | Saturation percentage |
|---|---|---|---|
| A | 5581 | 69 | 1.236338% |
| B | 5581 | 66 | 1.182584% |
| C | 5581 | 132 | 2.365168% |
| D | 5581 | 78 | 1.397599% |
Noise dominated data is calculated using 1-second bins in cleaned event files. If a bin has >2000 counts, and if more than 50% of those come from <1% of pixels, then it is considered to be noise-dominated and hence unusable.
| Quadrant | # 1 sec bins | Bins with >0 counts | Bins with >2000 counts | High rate bins dominated by noise | Noise dominated (total time) | Noise dominated (detector-on time) | Marked lightcurve |
|---|---|---|---|---|---|---|---|
| A | 6866 | 5581 | 5 | 5 | 0.07% | 0.09% | 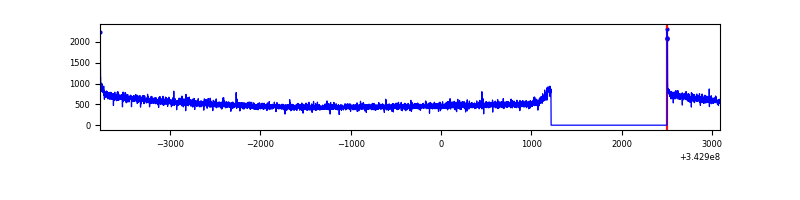 |
| B | 6866 | 5581 | 9 | 9 | 0.13% | 0.16% | 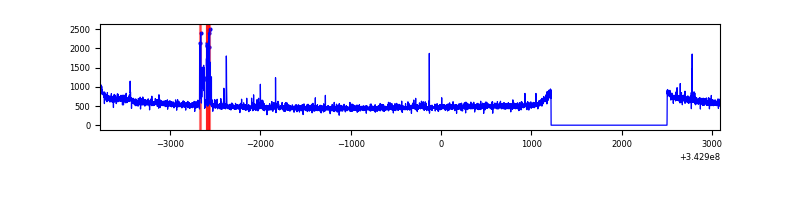 |
| C | 6866 | 5581 | 13 | 13 | 0.19% | 0.23% | 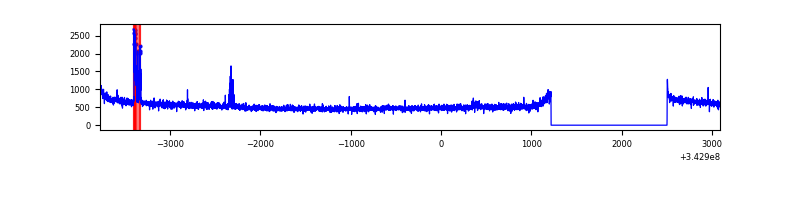 |
| D | 6866 | 5581 | 35 | 35 | 0.51% | 0.63% | 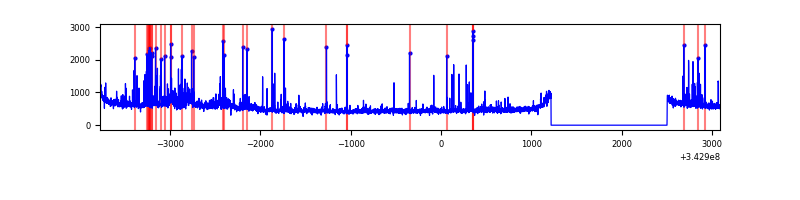 |
Top three noisy pixels from each quadrant. If the there are fewer than three noisy pixels in the level2.evt file, extra rows are filled as -1
| Pixel properties | Quadrant properties | ||||||
|---|---|---|---|---|---|---|---|
| Quadrant | DetID | PixID | Counts | Sigma | Mean | Median | Sigma |
| A | 8 | 192 | 14300 | 91.33 | 748 | 735 | 148.5 |
| A | 13 | 254 | 8773 | 54.12 | 748 | 735 | 148.5 |
| A | 3 | 137 | 6479 | 38.67 | 748 | 735 | 148.5 |
| B | 3 | 64 | 86601 | 624.89 | 738 | 722 | 137.4 |
| B | 12 | 111 | 16021 | 111.32 | 738 | 722 | 137.4 |
| B | 11 | 111 | 14679 | 101.56 | 738 | 722 | 137.4 |
| C | 3 | 233 | 128249 | 761.5 | 723 | 727 | 167.5 |
| C | 14 | 238 | 116654 | 692.26 | 723 | 727 | 167.5 |
| C | 13 | 61 | 4894 | 24.88 | 723 | 727 | 167.5 |
| D | 1 | 52 | 250945 | 1475.62 | 727 | 711 | 169.6 |
| D | 8 | 195 | 90659 | 530.42 | 727 | 711 | 169.6 |
| D | 2 | 250 | 57454 | 334.61 | 727 | 711 | 169.6 |
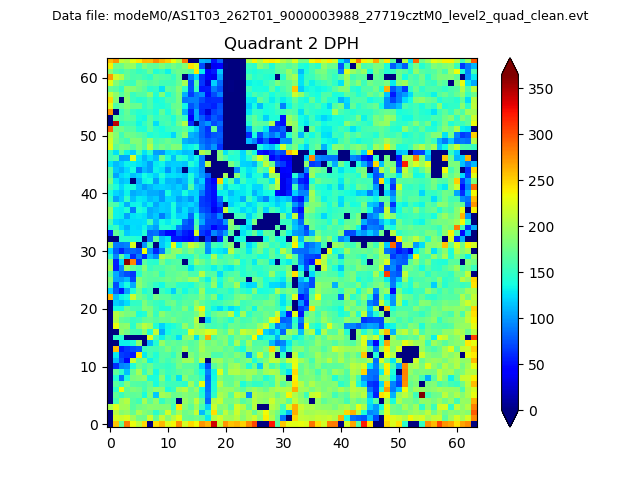
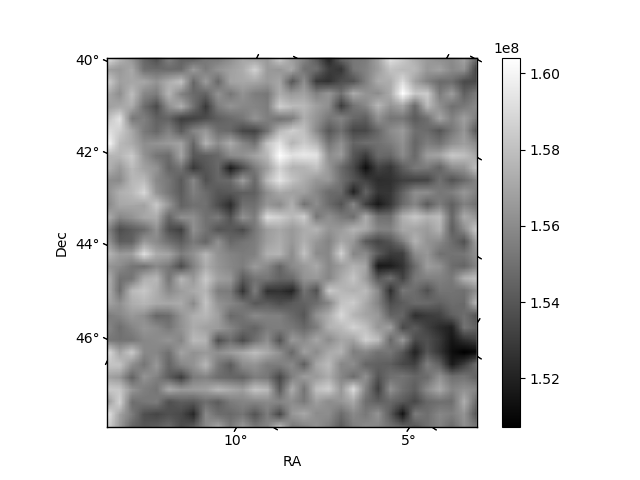
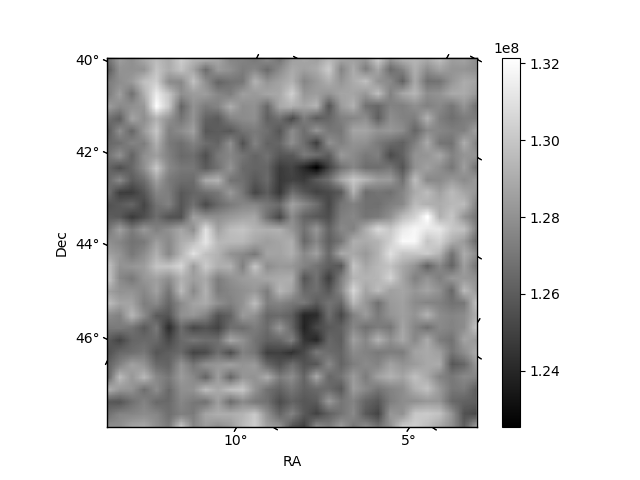
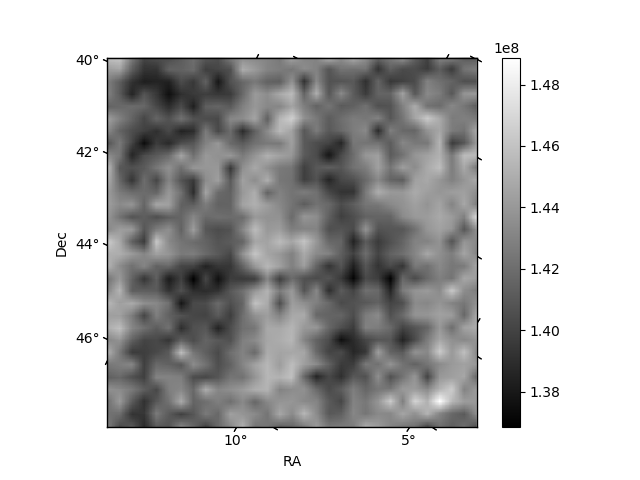
Histogram calculated using DETX and DETY for each event in the final _common_clean file
| Quadrant A |  |
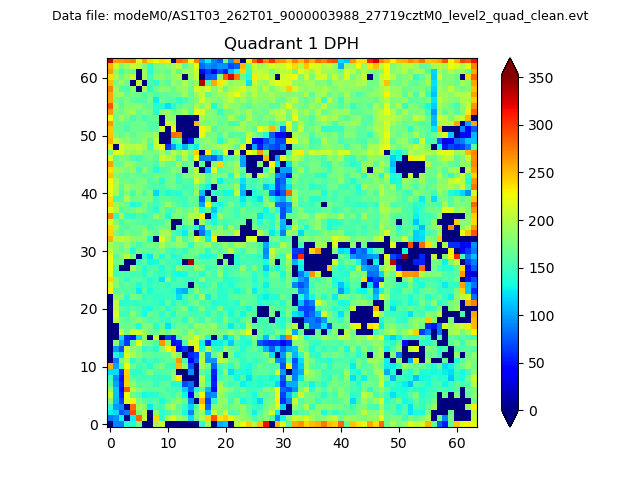 |
Quadrant B |
|---|---|---|---|
| Quadrant D | 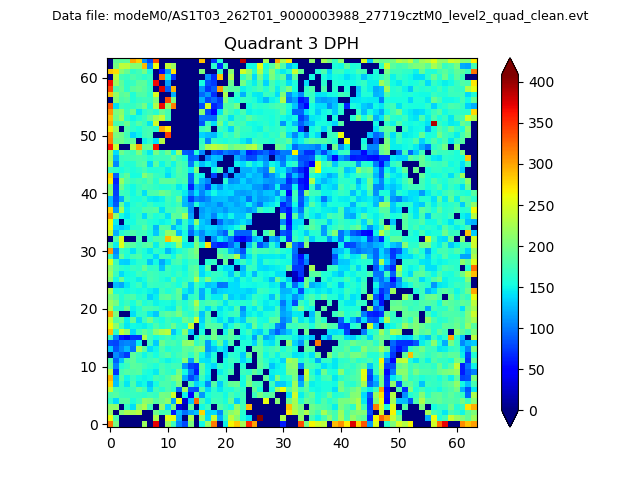 |
 |
Quadrant C |
| Plot type | Count rate plots | Images |
|---|---|---|
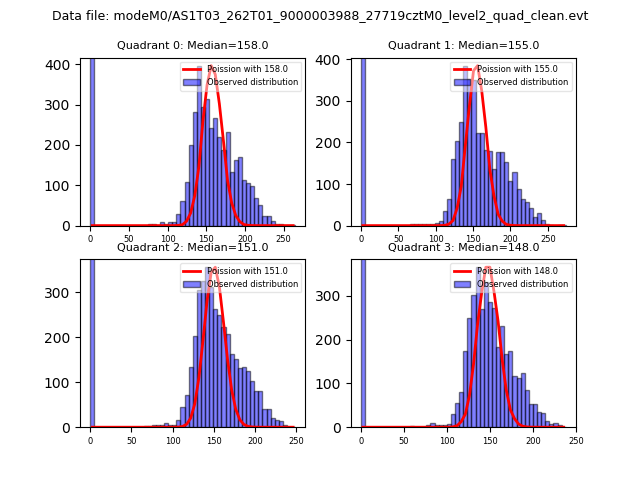
| Comparison with Poisson distribution Blue bars denote a histogram of data divided into 1 sec bins. Red curve is a Poisson curve with rate = median count rate of data. |
 |
 |
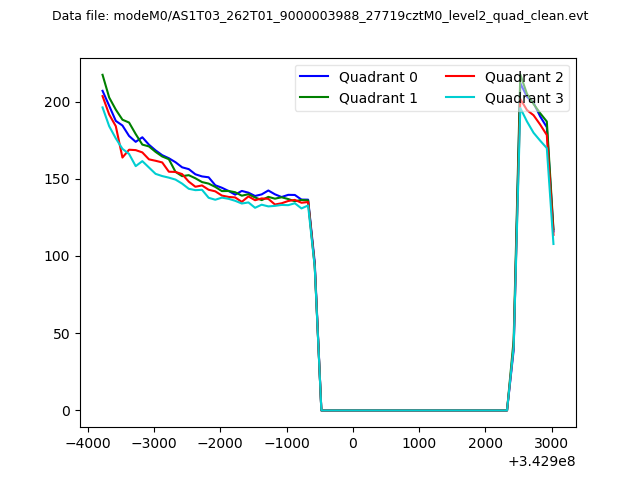
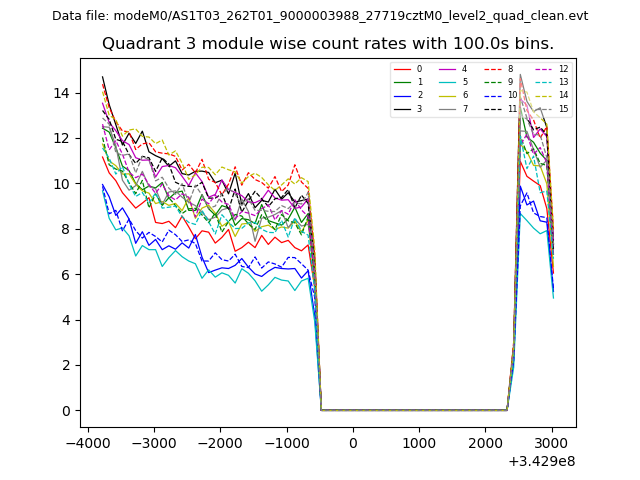
| Quadrant-wise count rates Data is divided into 100 sec bins |
 |
|
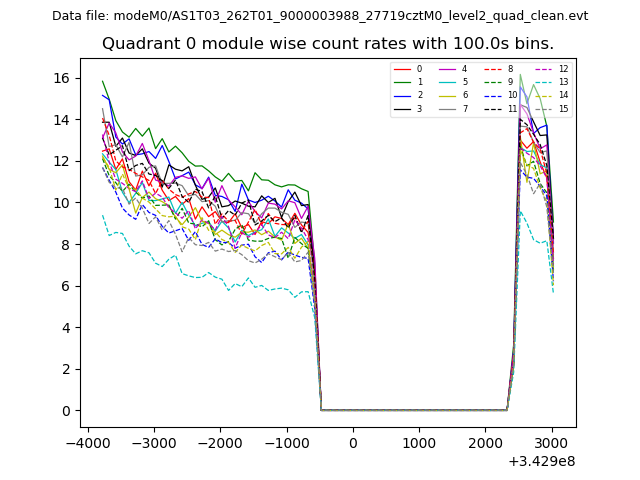
| Module-wise count rates for Quadrant A Data is divided into 100 sec bins |
 |
 |
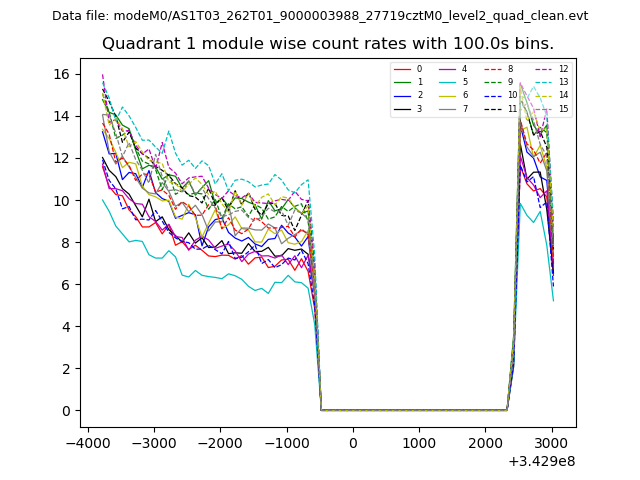
| Module-wise count rates for Quadrant B Data is divided into 100 sec bins |
 |
 |
| Module-wise count rates for Quadrant C Data is divided into 100 sec bins |
 |
 |
| Module-wise count rates for Quadrant D Data is divided into 100 sec bins |
 |
 |
| Parameter | Plot |
|---|---|
| CZT HV Monitor |  |
| D_VDD | 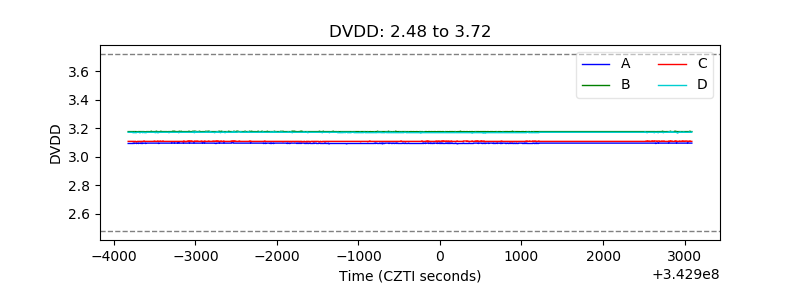 |
| Temperature 1 | 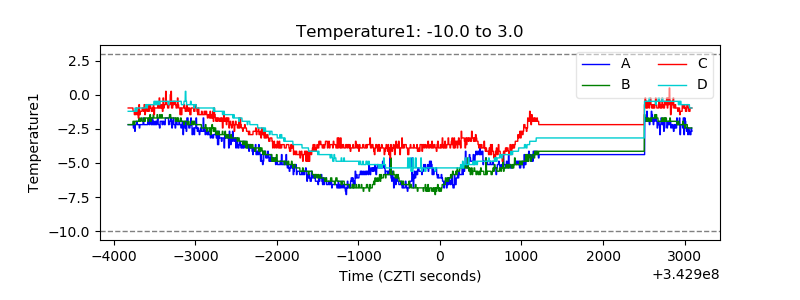 |
| Veto HV Monitor | 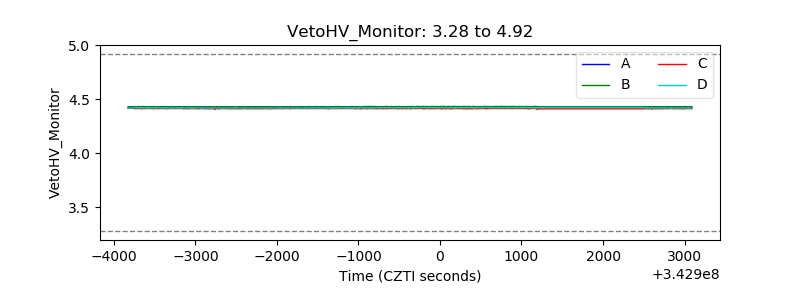 |
| Veto LLD | 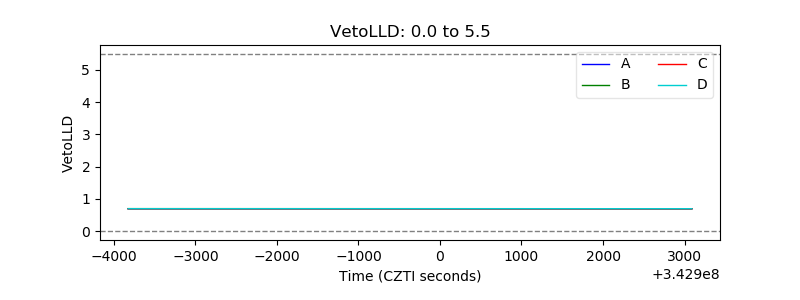 |
| Alpha Counter | 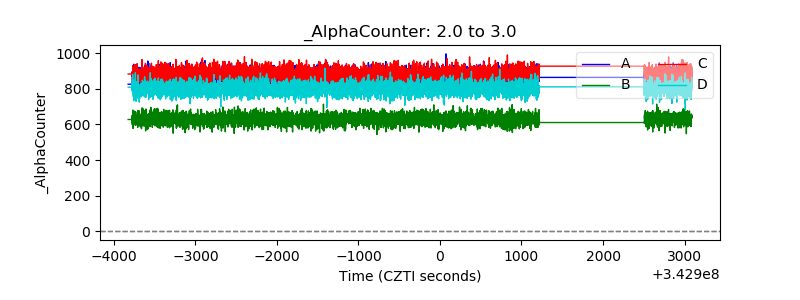 |
| _CPM_Rate | 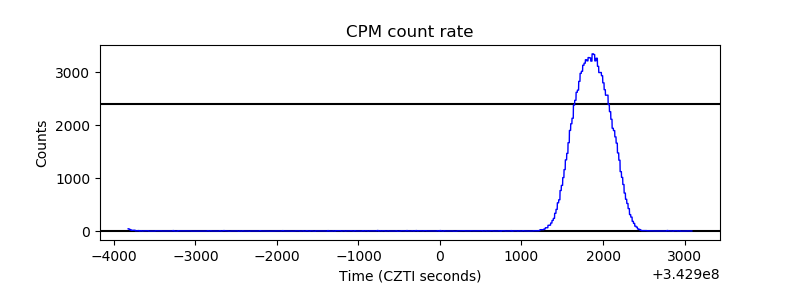 |
| CZT Counter | 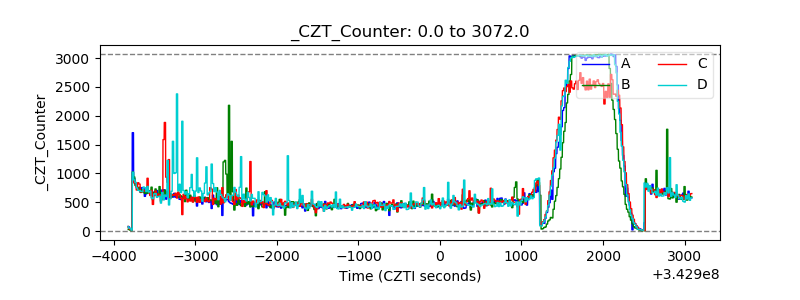 |
| +2.5 Volts monitor |  |
| +5 Volts monitor |  |
| _ROLL_ROT | 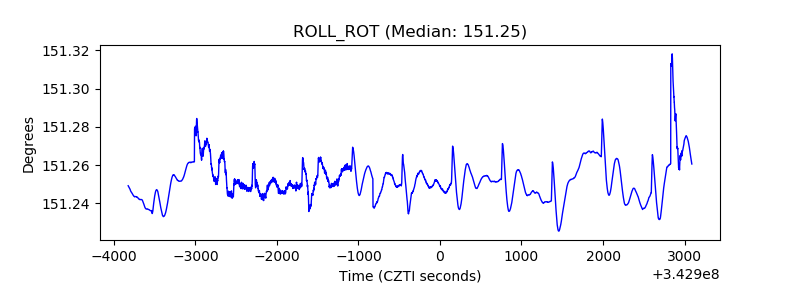 |
| _Roll_DEC | 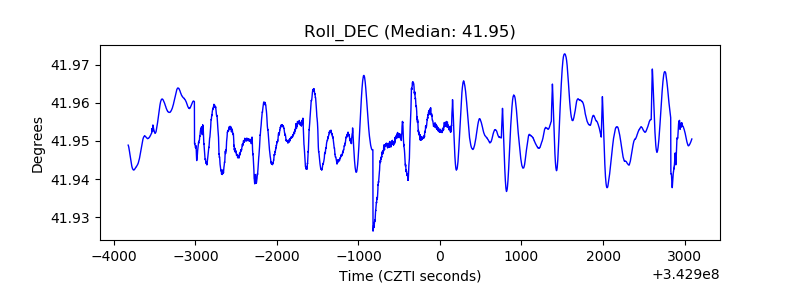 |
| _Roll_RA | 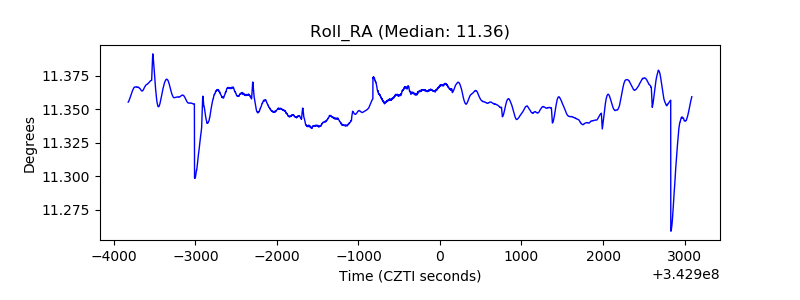 |
| Veto Counter | 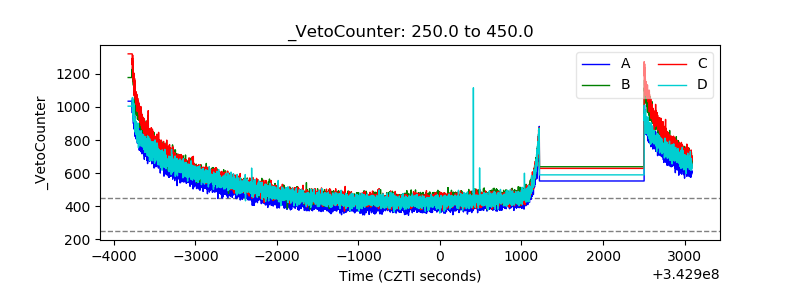 |