| Param | Original file | Final file |
|---|---|---|
| Filename | modeM0/AS1T03_263T01_9000003990cztM0_level2.fits | modeM0/AS1T03_263T01_9000003990cztM0_level2_quad_clean.evt |
| Size (bytes) | 966,971,520 | 1,001,220,480 |
| Size | 922.2 MB | 954.8 MB |
| Events in quadrant A | 6,001,112 | 6,316,383 |
| Events in quadrant B | 5,759,182 | 6,200,128 |
| Events in quadrant C | 5,888,074 | 6,000,491 |
| Events in quadrant D | 5,120,270 | 5,291,718 |
| Mode SS | |||
|---|---|---|---|
| Quadrant | BADHDUFLAG | Total packets | Discarded packets |
| A | 0 | 1938 | 0 |
| B | 0 | 1938 | 0 |
| C | 0 | 1938 | 0 |
| D | 0 | 1938 | 0 |
| Mode M0 | |||
|---|---|---|---|
| Quadrant | BADHDUFLAG | Total packets | Discarded packets |
| A | 0 | 229300 | 0 |
| B | 0 | 224323 | 0 |
| C | 0 | 226107 | 0 |
| D | 0 | 238852 | 0 |
| Mode M9 | |||
|---|---|---|---|
| Quadrant | BADHDUFLAG | Total packets | Discarded packets |
| A | 0 | 165 | 0 |
| B | 0 | 165 | 0 |
| C | 0 | 165 | 0 |
| D | 0 | 165 | 0 |
| Quadrant | Total seconds | Saturated seconds | Saturation percentage |
|---|---|---|---|
| A | 95044 | 1503 | 1.581373% |
| B | 95044 | 3339 | 3.513110% |
| C | 95044 | 2433 | 2.559867% |
| D | 95044 | 3026 | 3.183789% |
Noise dominated data is calculated using 1-second bins in cleaned event files. If a bin has >2000 counts, and if more than 50% of those come from <1% of pixels, then it is considered to be noise-dominated and hence unusable.
| Quadrant | # 1 sec bins | Bins with >0 counts | Bins with >2000 counts | High rate bins dominated by noise | Noise dominated (total time) | Noise dominated (detector-on time) | Marked lightcurve |
|---|---|---|---|---|---|---|---|
| A | 111570 | 95029 | 0 | 0 | 0.00% | 0.00% | 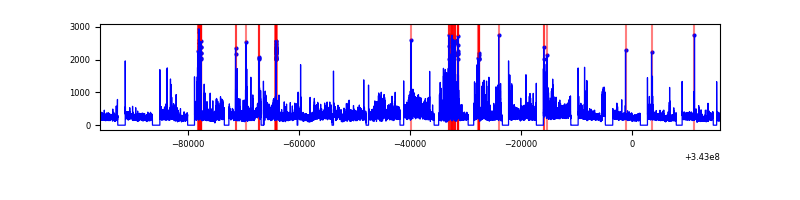 |
| B | 111570 | 94978 | 0 | 0 | 0.00% | 0.00% |  |
| C | 111570 | 95027 | 0 | 0 | 0.00% | 0.00% |  |
| D | 111570 | 94880 | 0 | 0 | 0.00% | 0.00% |  |
Top three noisy pixels from each quadrant. If the there are fewer than three noisy pixels in the level2.evt file, extra rows are filled as -1
| Pixel properties | Quadrant properties | ||||||
|---|---|---|---|---|---|---|---|
| Quadrant | DetID | PixID | Counts | Sigma | Mean | Median | Sigma |
| A | 14 | 188 | 6547 | 13.5 | 1556 | 1463 | 376.6 |
| A | 14 | 204 | 5249 | 10.05 | 1556 | 1463 | 376.6 |
| A | 0 | 29 | 5002 | 9.4 | 1556 | 1463 | 376.6 |
| B | 2 | 9 | 4398 | 9.96 | 1518 | 1449 | 296.2 |
| B | 5 | 128 | 3714 | 7.65 | 1518 | 1449 | 296.2 |
| B | 5 | 232 | 3651 | 7.43 | 1518 | 1449 | 296.2 |
| C | 1 | 81 | 4870 | 8.7 | 1552 | 1458 | 392.3 |
| C | 1 | 80 | 4811 | 8.55 | 1552 | 1458 | 392.3 |
| C | 3 | 202 | 4561 | 7.91 | 1552 | 1458 | 392.3 |
| D | 4 | 246 | 4010 | 6.97 | 1458 | 1333 | 384.3 |
| D | 3 | 14 | 3634 | 5.99 | 1458 | 1333 | 384.3 |
| D | 6 | 38 | 3626 | 5.97 | 1458 | 1333 | 384.3 |
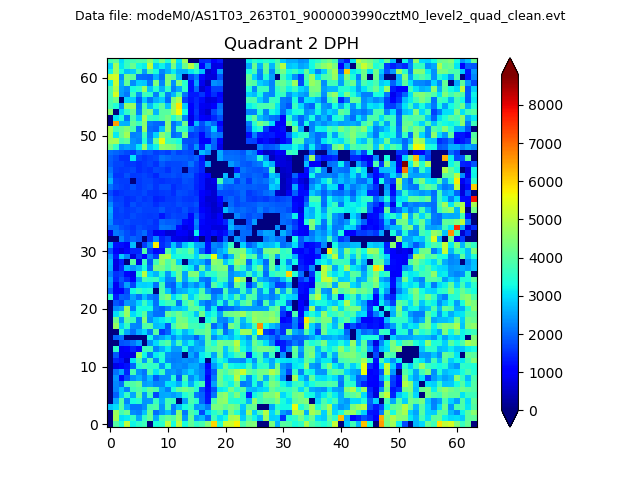
Histogram calculated using DETX and DETY for each event in the final _common_clean file
| Quadrant A | 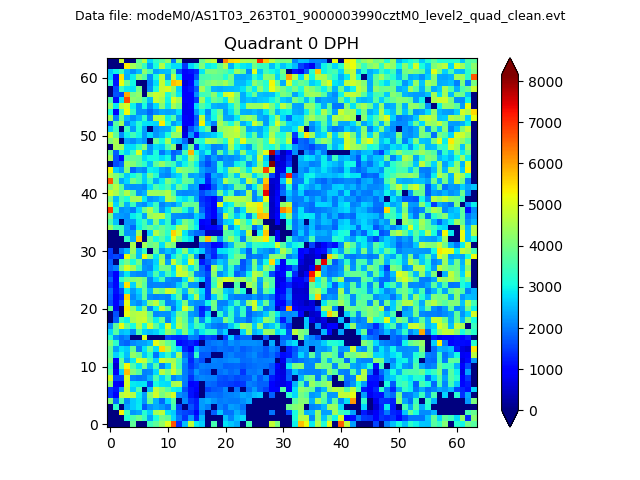 |
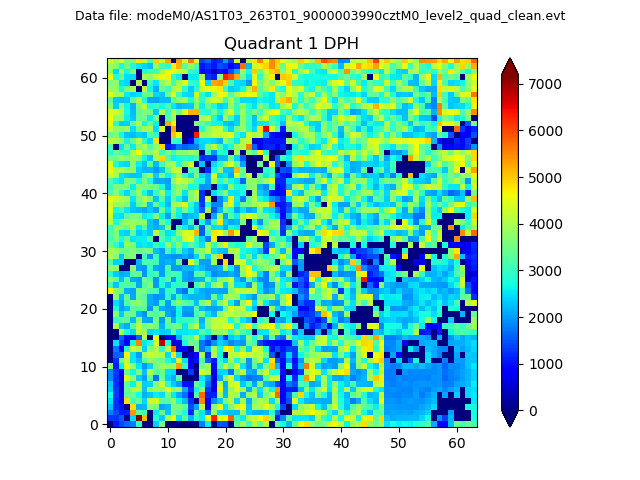 |
Quadrant B |
|---|---|---|---|
| Quadrant D | 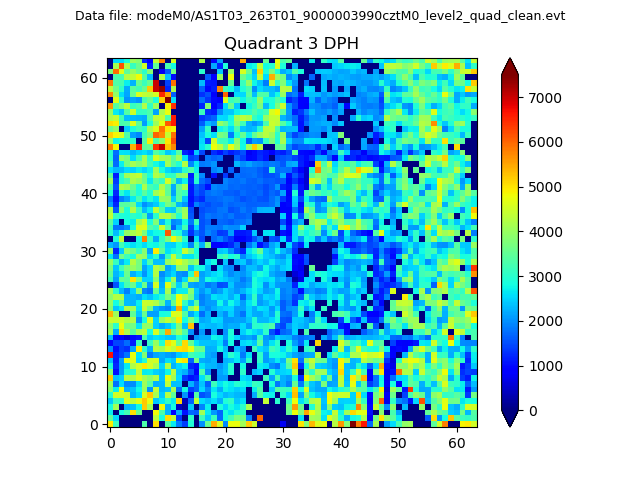 |
 |
Quadrant C |
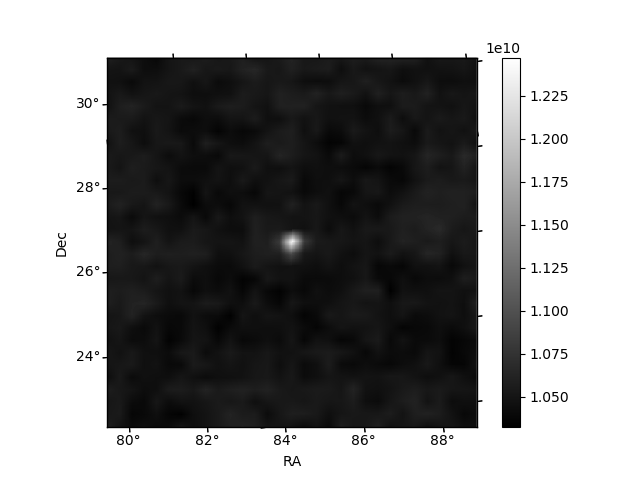
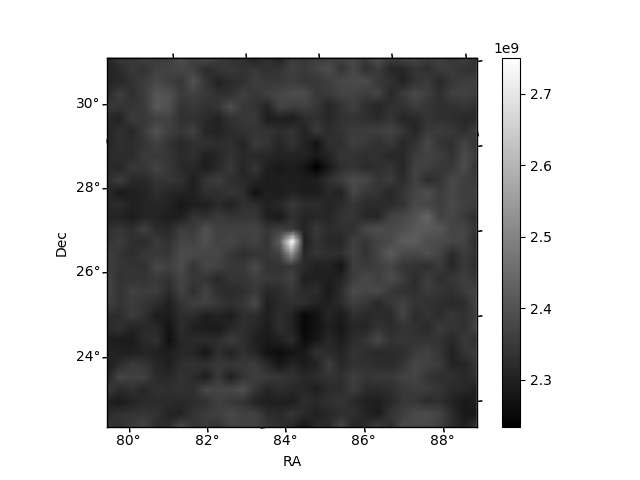
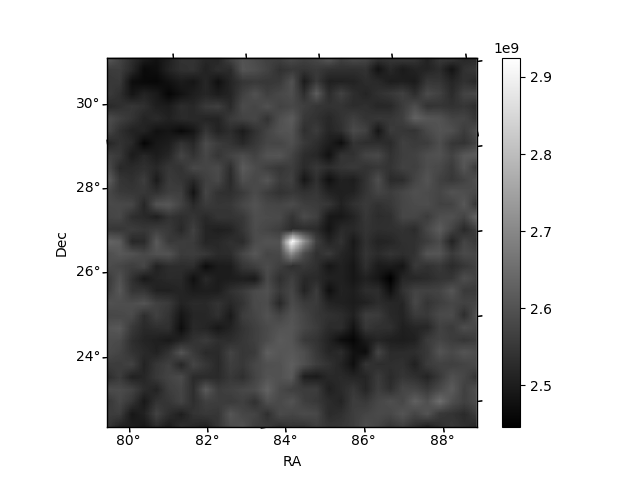
| Plot type | Count rate plots | Images |
|---|---|---|
| Comparison with Poisson distribution Blue bars denote a histogram of data divided into 1 sec bins. Red curve is a Poisson curve with rate = median count rate of data. |
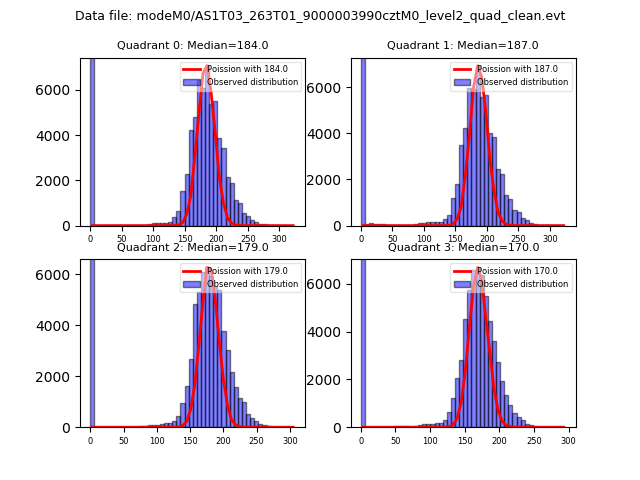 |
 |
| Quadrant-wise count rates Data is divided into 100 sec bins |
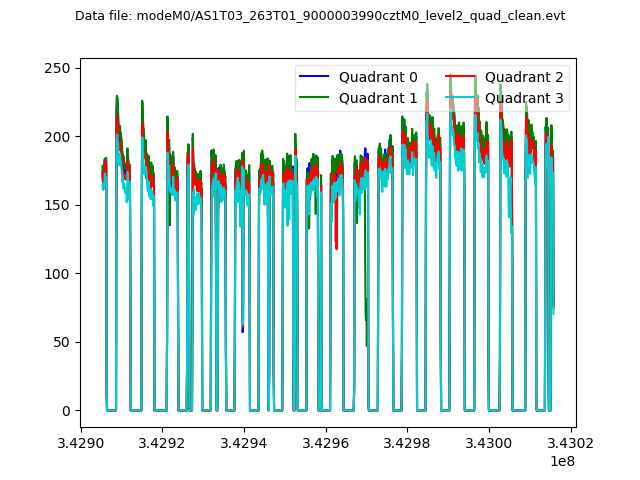 |
|
| Module-wise count rates for Quadrant A Data is divided into 100 sec bins |
 |
 |
| Module-wise count rates for Quadrant B Data is divided into 100 sec bins |
 |
 |
| Module-wise count rates for Quadrant C Data is divided into 100 sec bins |
 |
 |
| Module-wise count rates for Quadrant D Data is divided into 100 sec bins |
 |
 |
| Parameter | Plot |
|---|---|
| CZT HV Monitor |  |
| D_VDD | 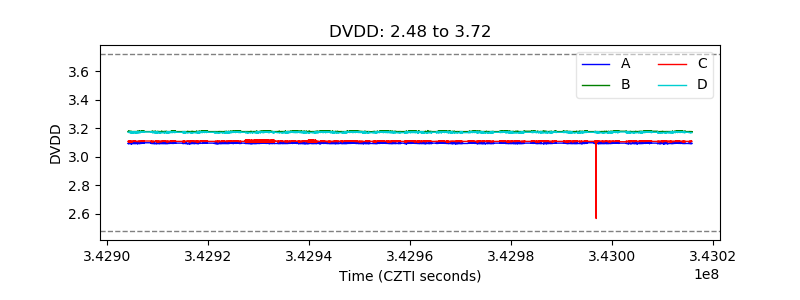 |
| Temperature 1 |  |
| Veto HV Monitor |  |
| Veto LLD | 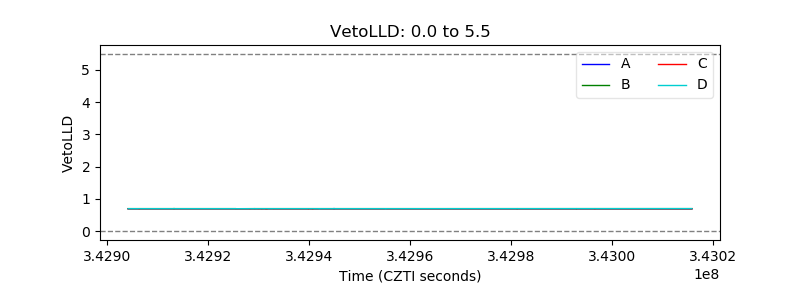 |
| Alpha Counter |  |
| _CPM_Rate |  |
| CZT Counter | 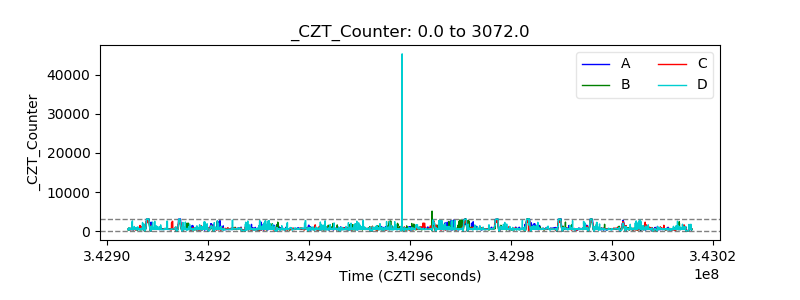 |
| +2.5 Volts monitor |  |
| +5 Volts monitor |  |
| _ROLL_ROT | 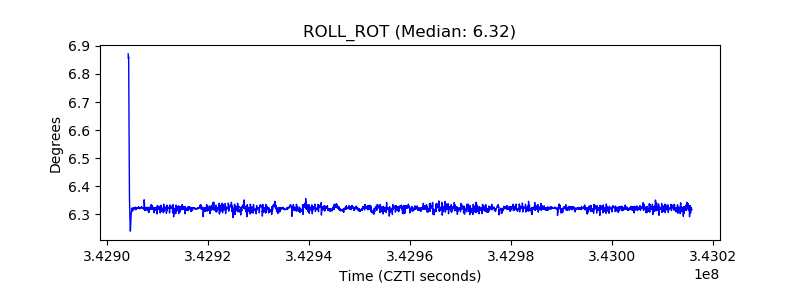 |
| _Roll_DEC | 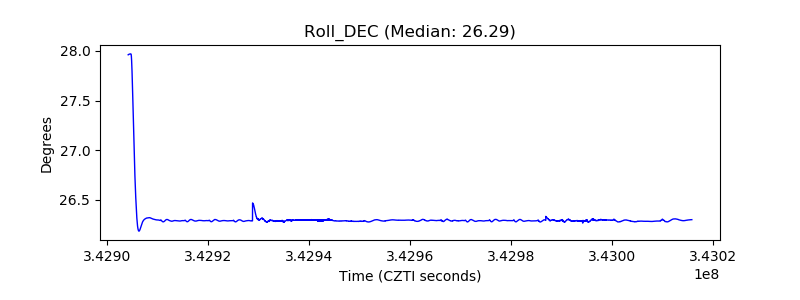 |
| _Roll_RA |  |
| Veto Counter |  |