| Param | Original file | Final file |
|---|---|---|
| Filename | modeM0/AS1T03_263T01_9000003990_27719cztM0_level2.evt | modeM0/AS1T03_263T01_9000003990_27719cztM0_level2_quad_clean.evt |
| Size (bytes) | 353,479,680 | 91,673,280 |
| Size | 337.1 MB | 87.4 MB |
| Events in quadrant A | 2,458,299 | 627,373 |
| Events in quadrant B | 2,521,625 | 639,804 |
| Events in quadrant C | 2,590,784 | 612,805 |
| Events in quadrant D | 2,829,043 | 581,017 |
| Mode M0 | |||
|---|---|---|---|
| Quadrant | BADHDUFLAG | Total packets | Discarded packets |
| A | 0 | 9985 | 0 |
| B | 0 | 10194 | 0 |
| C | 0 | 10453 | 0 |
| D | 0 | 11236 | 0 |
| Mode M9 | |||
|---|---|---|---|
| Quadrant | BADHDUFLAG | Total packets | Discarded packets |
| A | 0 | 13 | 0 |
| B | 0 | 13 | 0 |
| C | 0 | 13 | 0 |
| D | 0 | 13 | 0 |
| Quadrant | Total seconds | Saturated seconds | Saturation percentage |
|---|---|---|---|
| A | 4484 | 43 | 0.958965% |
| B | 4484 | 55 | 1.226583% |
| C | 4484 | 90 | 2.007136% |
| D | 4484 | 130 | 2.899197% |
Noise dominated data is calculated using 1-second bins in cleaned event files. If a bin has >2000 counts, and if more than 50% of those come from <1% of pixels, then it is considered to be noise-dominated and hence unusable.
| Quadrant | # 1 sec bins | Bins with >0 counts | Bins with >2000 counts | High rate bins dominated by noise | Noise dominated (total time) | Noise dominated (detector-on time) | Marked lightcurve |
|---|---|---|---|---|---|---|---|
| A | 5839 | 4484 | 3 | 3 | 0.05% | 0.07% |  |
| B | 5839 | 4484 | 0 | 0 | 0.00% | 0.00% |  |
| C | 5839 | 4484 | 1 | 1 | 0.02% | 0.02% |  |
| D | 5839 | 4484 | 61 | 61 | 1.04% | 1.36% | 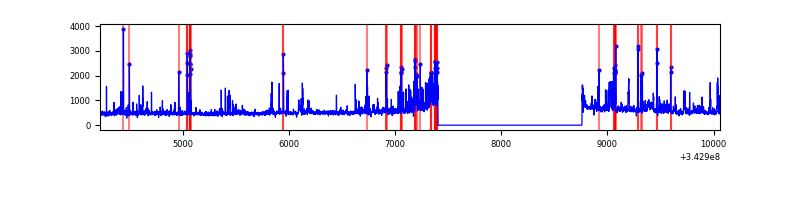 |
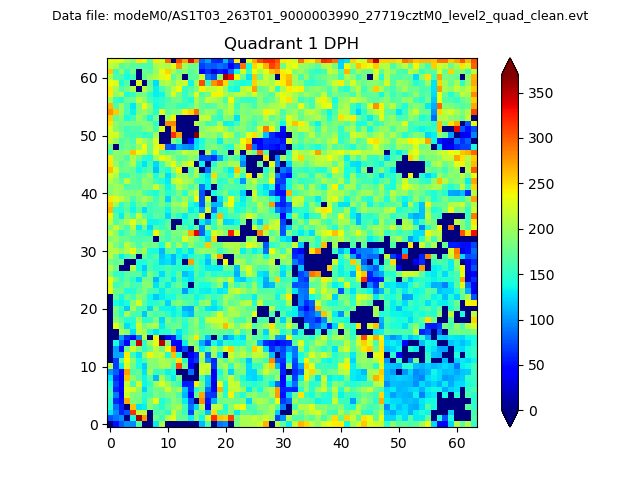
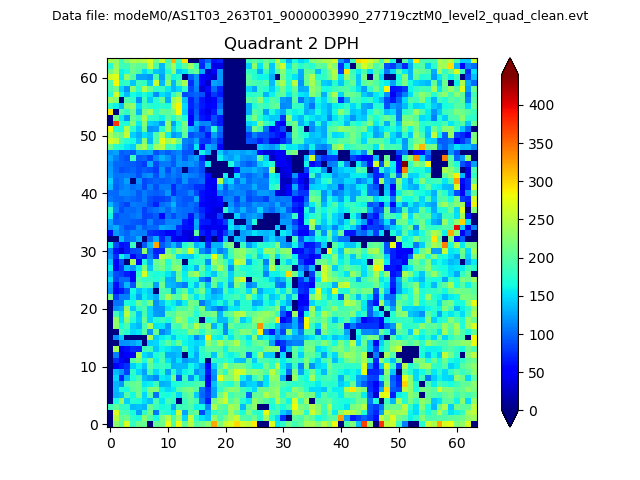
Top three noisy pixels from each quadrant. If the there are fewer than three noisy pixels in the level2.evt file, extra rows are filled as -1
| Pixel properties | Quadrant properties | ||||||
|---|---|---|---|---|---|---|---|
| Quadrant | DetID | PixID | Counts | Sigma | Mean | Median | Sigma |
| A | 6 | 16 | 11490 | 82.92 | 632 | 625 | 131.0 |
| A | 8 | 192 | 7724 | 54.18 | 632 | 625 | 131.0 |
| A | 13 | 254 | 7346 | 51.29 | 632 | 625 | 131.0 |
| B | 0 | 230 | 29519 | 236.34 | 629 | 618 | 122.3 |
| B | 12 | 111 | 12973 | 101.03 | 629 | 618 | 122.3 |
| B | 11 | 111 | 11823 | 91.63 | 629 | 618 | 122.3 |
| C | 3 | 233 | 111720 | 756.45 | 607 | 615 | 146.9 |
| C | 14 | 238 | 100900 | 682.78 | 607 | 615 | 146.9 |
| C | 0 | 207 | 8267 | 52.1 | 607 | 615 | 146.9 |
| D | 1 | 52 | 440929 | 2947.58 | 600 | 588 | 149.4 |
| D | 2 | 250 | 53720 | 355.66 | 600 | 588 | 149.4 |
| D | 11 | 176 | 36372 | 239.53 | 600 | 588 | 149.4 |
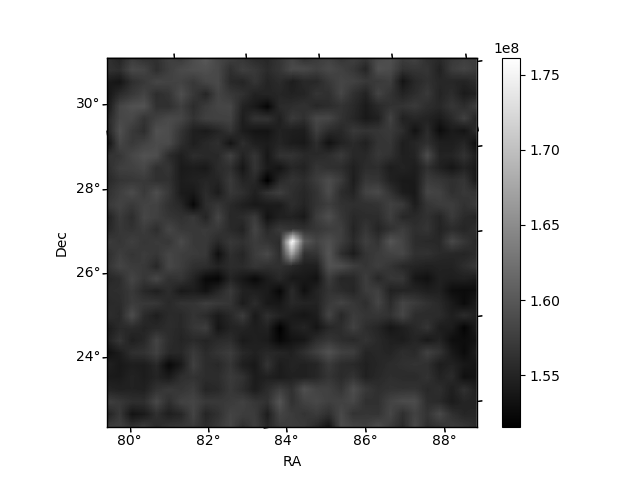
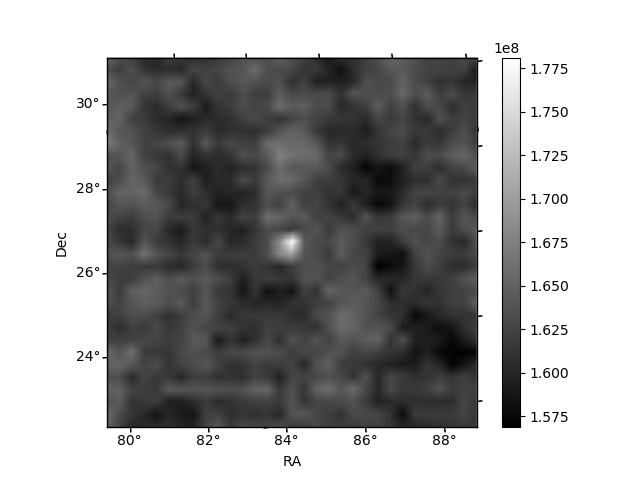
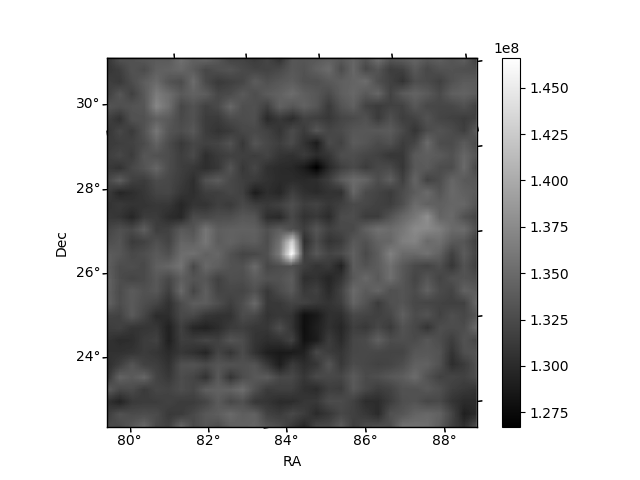
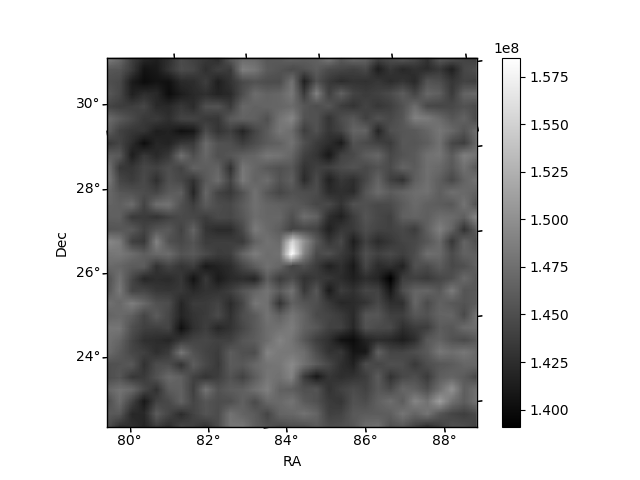
Histogram calculated using DETX and DETY for each event in the final _common_clean file
| Quadrant A | 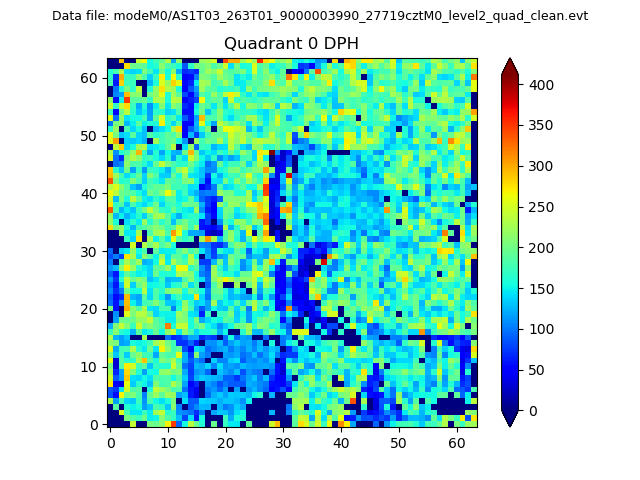 |
 |
Quadrant B |
|---|---|---|---|
| Quadrant D | 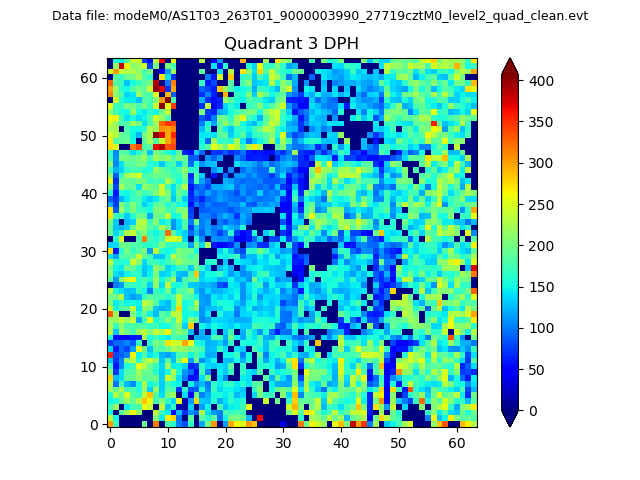 |
 |
Quadrant C |
| Plot type | Count rate plots | Images |
|---|---|---|
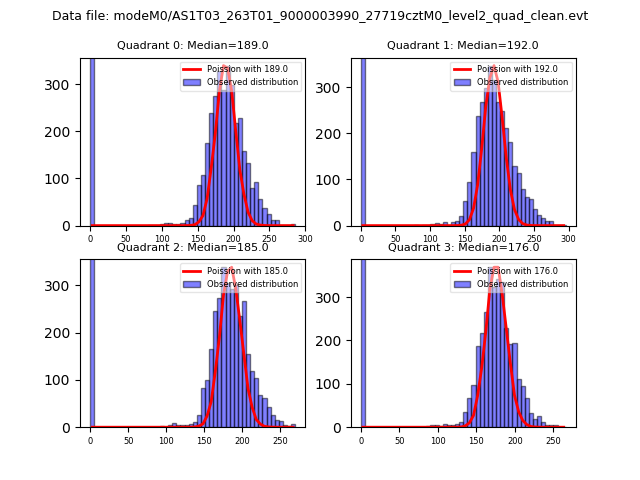
| Comparison with Poisson distribution Blue bars denote a histogram of data divided into 1 sec bins. Red curve is a Poisson curve with rate = median count rate of data. |
 |
 |
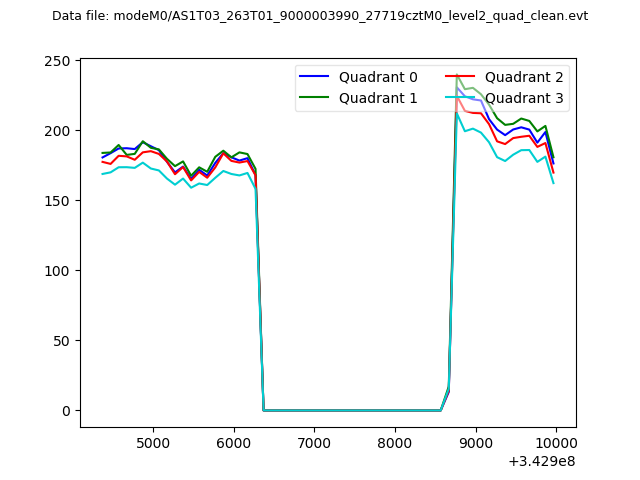
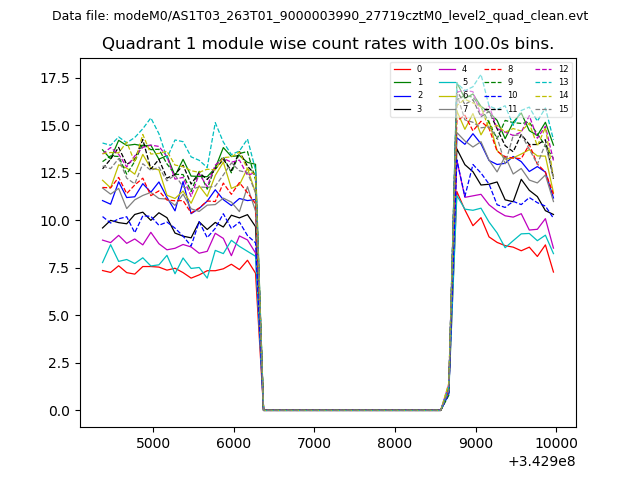
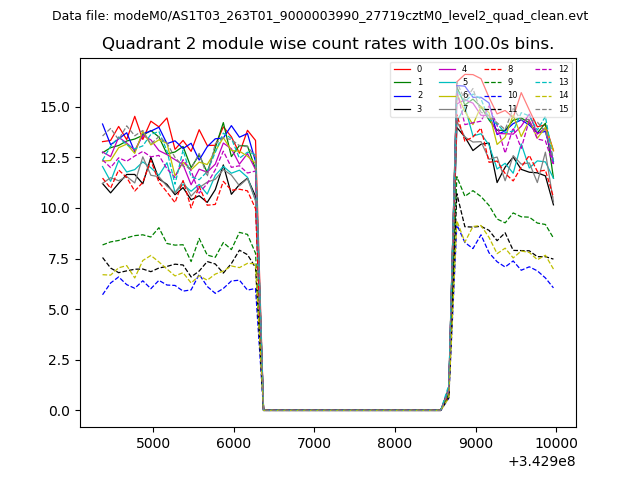
| Quadrant-wise count rates Data is divided into 100 sec bins |
 |
|
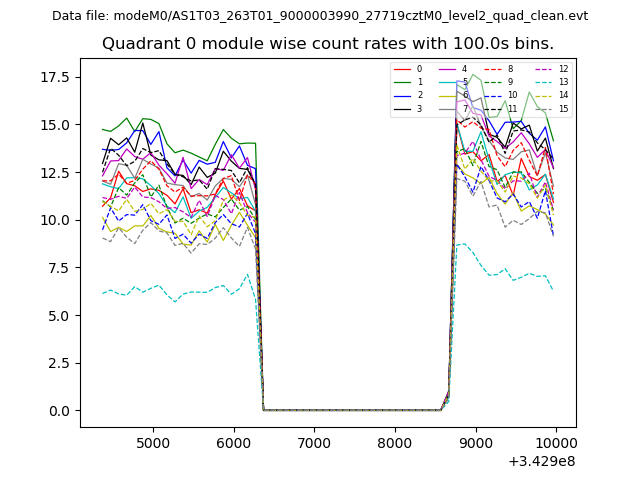
| Module-wise count rates for Quadrant A Data is divided into 100 sec bins |
 |
 |
| Module-wise count rates for Quadrant B Data is divided into 100 sec bins |
 |
 |
| Module-wise count rates for Quadrant C Data is divided into 100 sec bins |
 |
 |
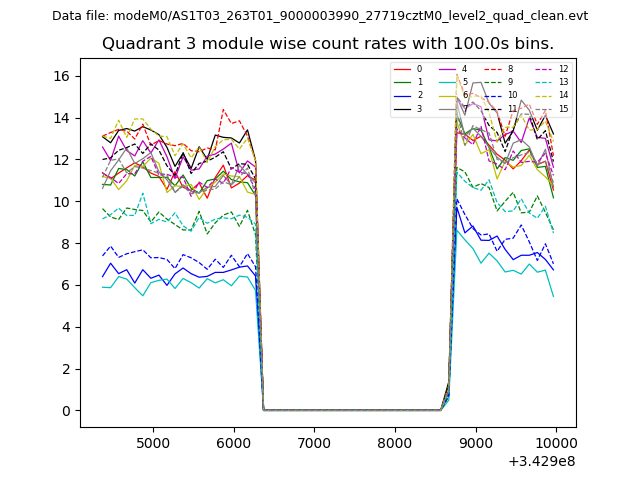
| Module-wise count rates for Quadrant D Data is divided into 100 sec bins |
 |
 |
| Parameter | Plot |
|---|---|
| CZT HV Monitor | 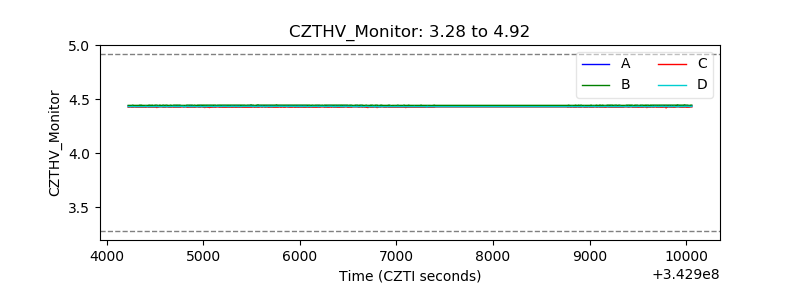 |
| D_VDD | 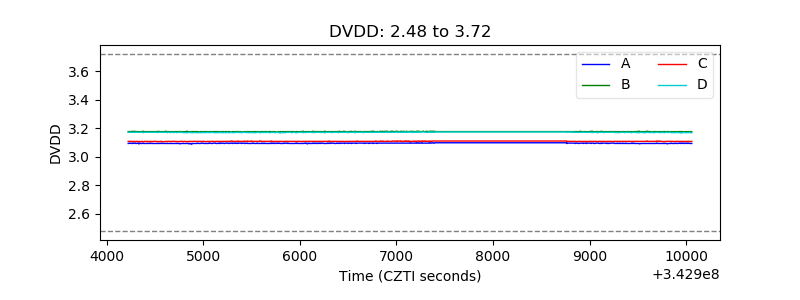 |
| Temperature 1 | 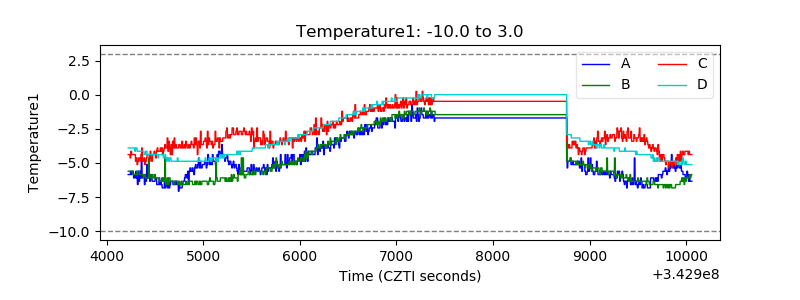 |
| Veto HV Monitor | 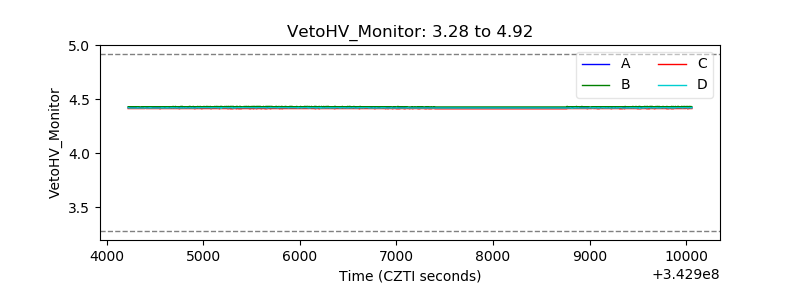 |
| Veto LLD | 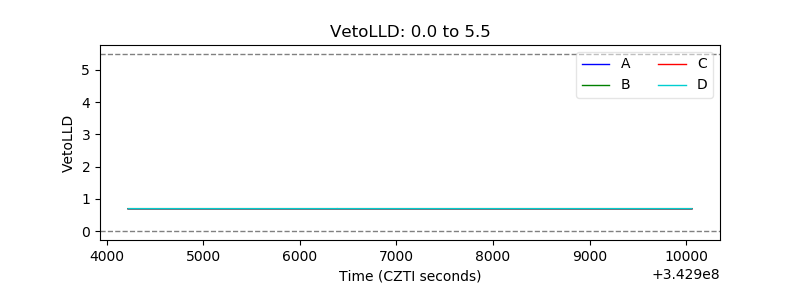 |
| Alpha Counter | 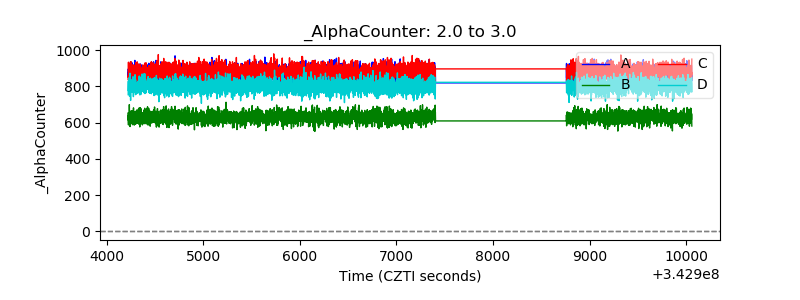 |
| _CPM_Rate | 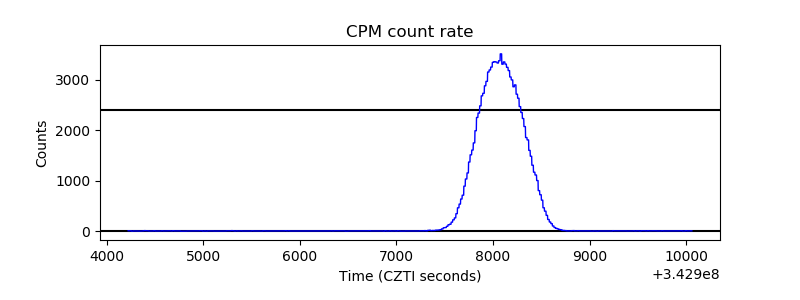 |
| CZT Counter | 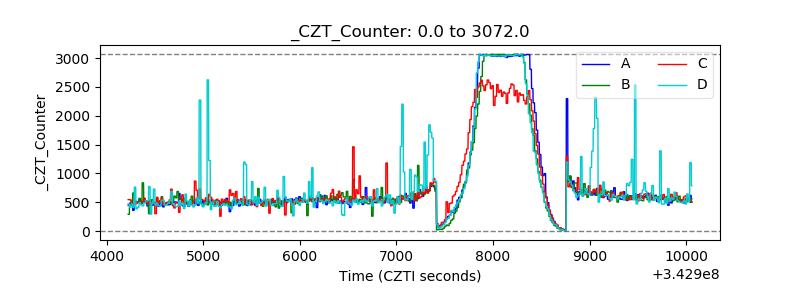 |
| +2.5 Volts monitor |  |
| +5 Volts monitor |  |
| _ROLL_ROT | 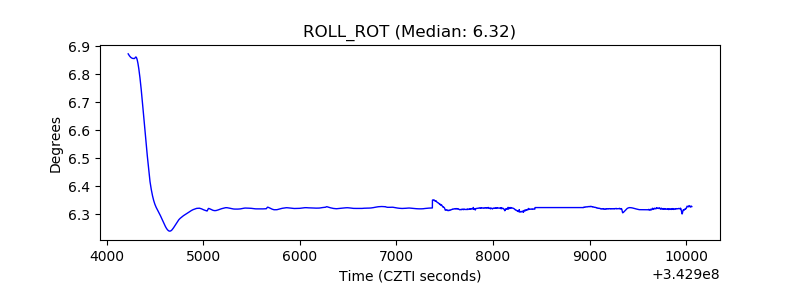 |
| _Roll_DEC | 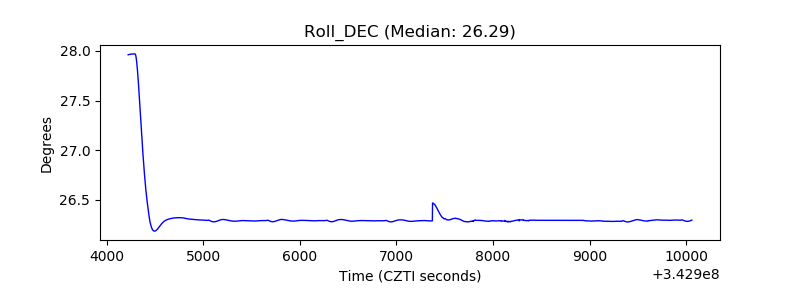 |
| _Roll_RA | 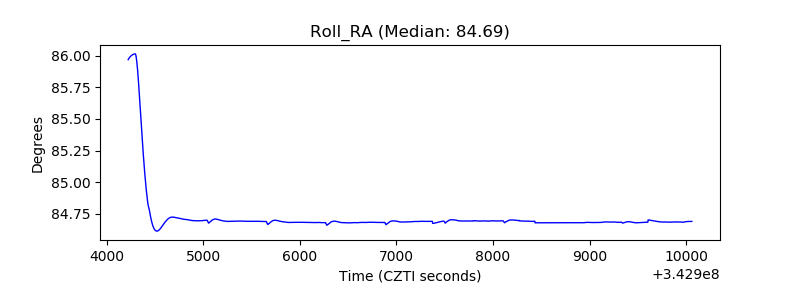 |
| Veto Counter | 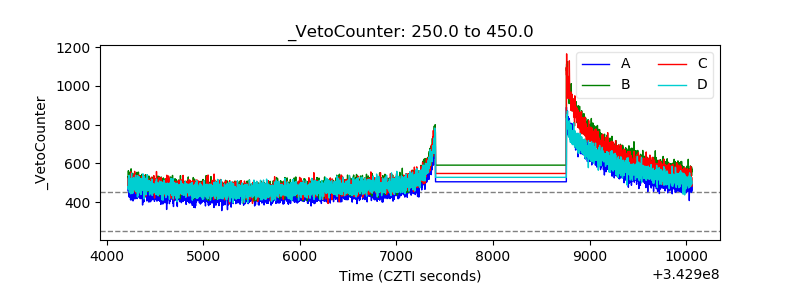 |