| Param | Original file | Final file |
|---|---|---|
| Filename | modeM0/AS1T03_263T01_9000003990_27720cztM0_level2.evt | modeM0/AS1T03_263T01_9000003990_27720cztM0_level2_quad_clean.evt |
| Size (bytes) | 492,036,480 | 130,302,720 |
| Size | 469.2 MB | 124.3 MB |
| Events in quadrant A | 3,403,845 | 898,876 |
| Events in quadrant B | 3,571,518 | 923,291 |
| Events in quadrant C | 3,695,504 | 872,774 |
| Events in quadrant D | 3,813,554 | 822,712 |
| Mode M0 | |||
|---|---|---|---|
| Quadrant | BADHDUFLAG | Total packets | Discarded packets |
| A | 0 | 13840 | 0 |
| B | 0 | 14373 | 0 |
| C | 0 | 14886 | 0 |
| D | 0 | 15231 | 0 |
| Mode M9 | |||
|---|---|---|---|
| Quadrant | BADHDUFLAG | Total packets | Discarded packets |
| A | 0 | 16 | 0 |
| B | 0 | 17 | 0 |
| C | 0 | 17 | 0 |
| D | 0 | 17 | 0 |
| Quadrant | Total seconds | Saturated seconds | Saturation percentage |
|---|---|---|---|
| A | 6151 | 31 | 0.503983% |
| B | 6151 | 109 | 1.772070% |
| C | 6151 | 170 | 2.763778% |
| D | 6151 | 101 | 1.642009% |
Noise dominated data is calculated using 1-second bins in cleaned event files. If a bin has >2000 counts, and if more than 50% of those come from <1% of pixels, then it is considered to be noise-dominated and hence unusable.
| Quadrant | # 1 sec bins | Bins with >0 counts | Bins with >2000 counts | High rate bins dominated by noise | Noise dominated (total time) | Noise dominated (detector-on time) | Marked lightcurve |
|---|---|---|---|---|---|---|---|
| A | 7496 | 6152 | 4 | 4 | 0.05% | 0.07% | 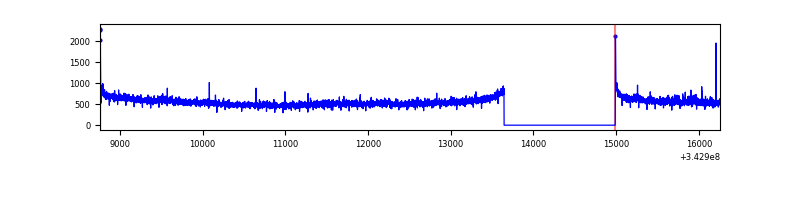 |
| B | 7496 | 6151 | 38 | 38 | 0.51% | 0.62% | 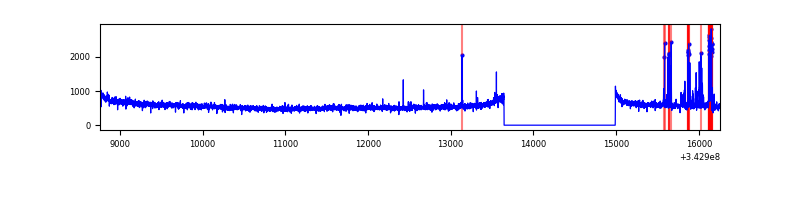 |
| C | 7496 | 6151 | 32 | 32 | 0.43% | 0.52% | 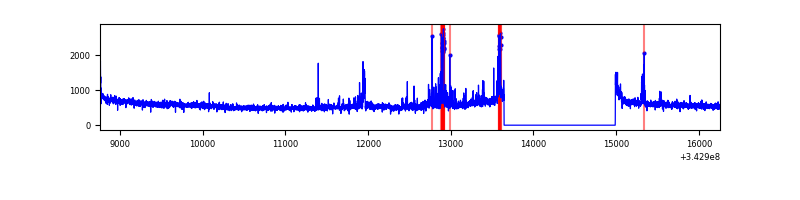 |
| D | 7496 | 6152 | 76 | 76 | 1.01% | 1.24% | 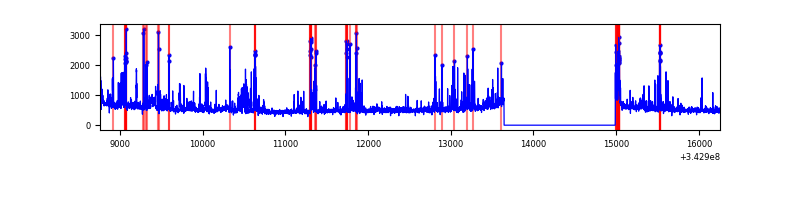 |
Top three noisy pixels from each quadrant. If the there are fewer than three noisy pixels in the level2.evt file, extra rows are filled as -1
| Pixel properties | Quadrant properties | ||||||
|---|---|---|---|---|---|---|---|
| Quadrant | DetID | PixID | Counts | Sigma | Mean | Median | Sigma |
| A | 6 | 16 | 48882 | 266.49 | 864 | 856 | 180.2 |
| A | 8 | 192 | 14153 | 73.78 | 864 | 856 | 180.2 |
| A | 0 | 13 | 12128 | 62.55 | 864 | 856 | 180.2 |
| B | 3 | 64 | 157618 | 915.9 | 870 | 855 | 171.2 |
| B | 12 | 111 | 18133 | 100.95 | 870 | 855 | 171.2 |
| B | 11 | 111 | 16348 | 90.52 | 870 | 855 | 171.2 |
| C | 3 | 233 | 144322 | 712.73 | 834 | 845 | 201.3 |
| C | 0 | 207 | 140792 | 695.19 | 834 | 845 | 201.3 |
| C | 14 | 238 | 137483 | 678.75 | 834 | 845 | 201.3 |
| D | 1 | 52 | 594535 | 2899.36 | 825 | 808 | 204.8 |
| D | 2 | 250 | 48818 | 234.45 | 825 | 808 | 204.8 |
| D | 11 | 176 | 32905 | 156.74 | 825 | 808 | 204.8 |
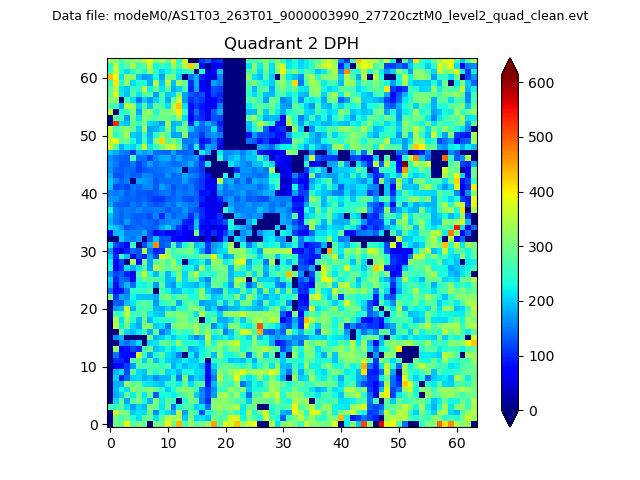
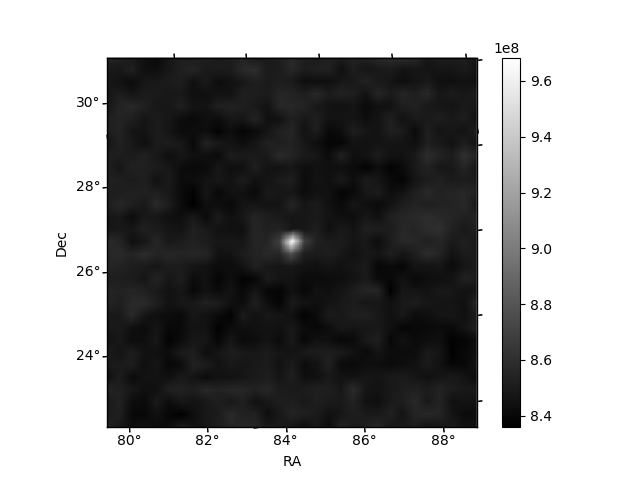
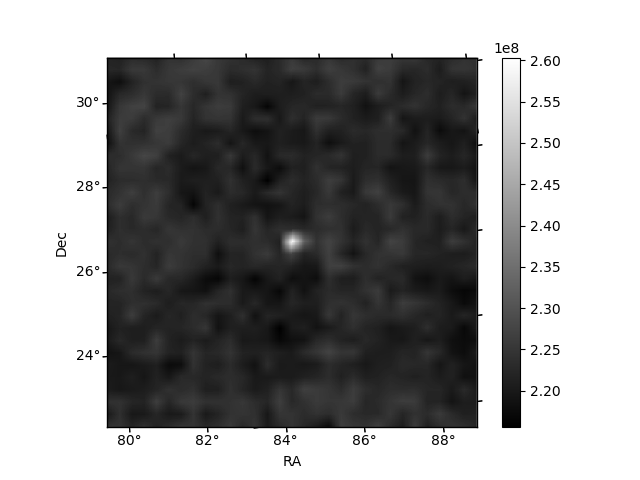
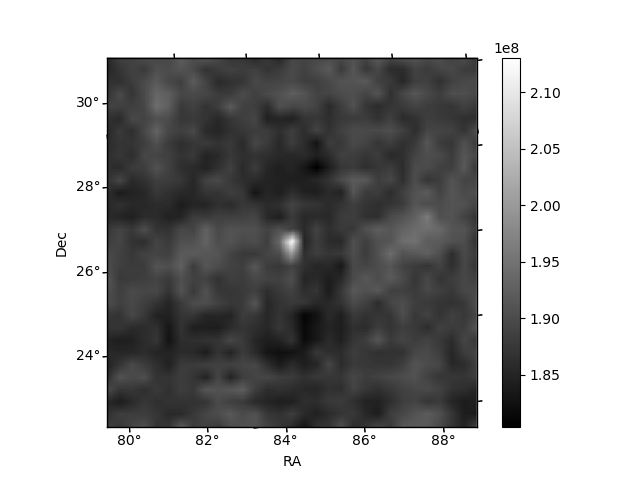
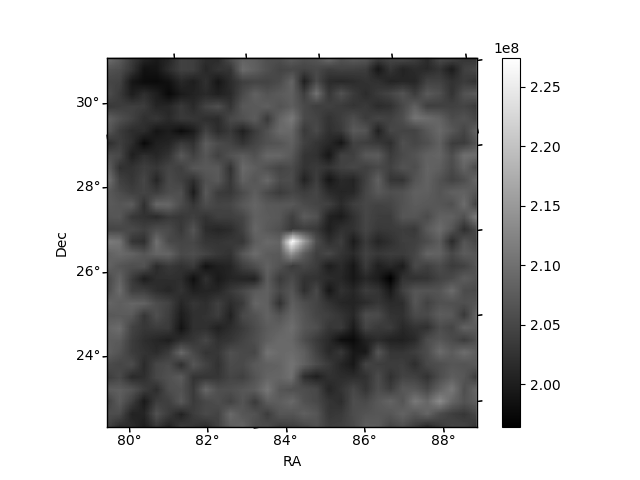
Histogram calculated using DETX and DETY for each event in the final _common_clean file
| Quadrant A | 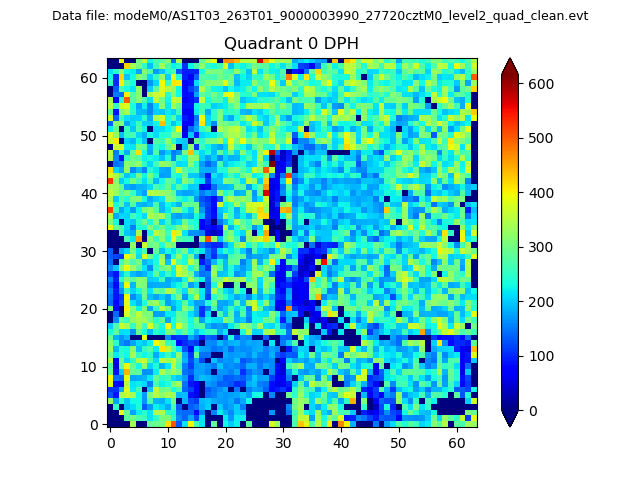 |
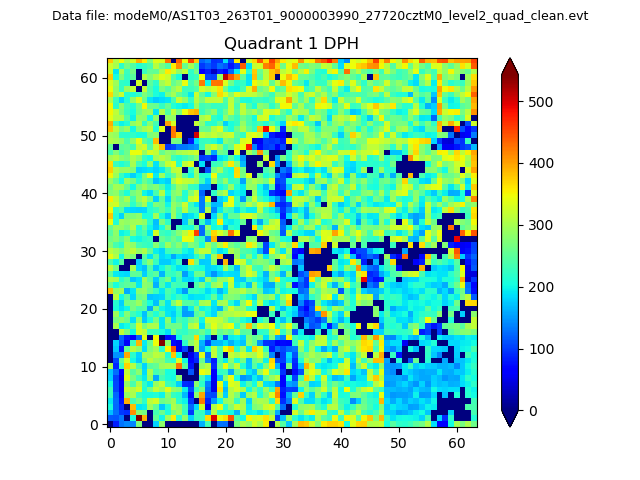 |
Quadrant B |
|---|---|---|---|
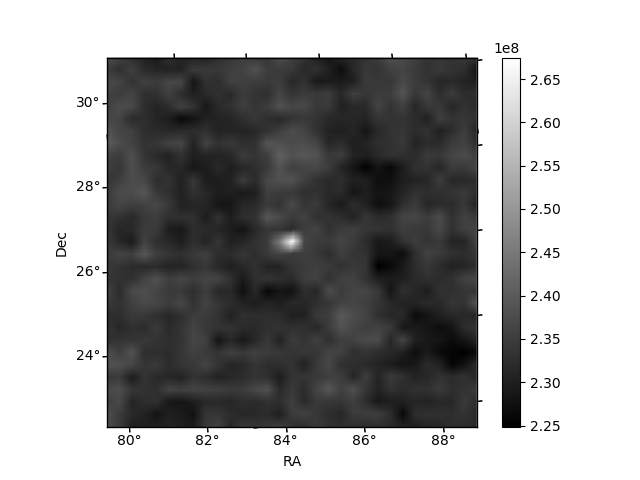
| Quadrant D | 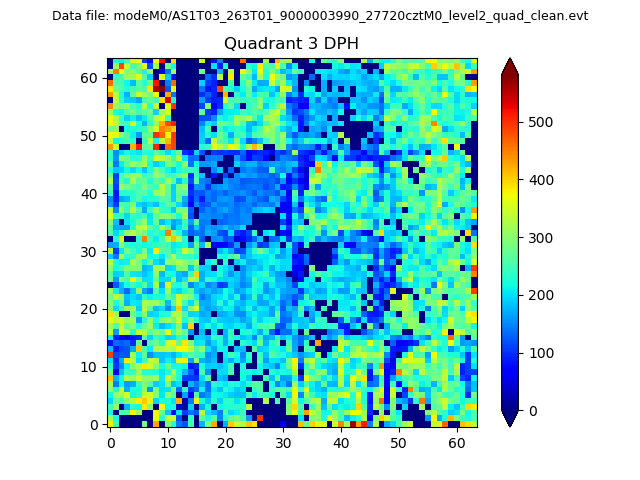 |
 |
Quadrant C |
| Plot type | Count rate plots | Images |
|---|---|---|
| Comparison with Poisson distribution Blue bars denote a histogram of data divided into 1 sec bins. Red curve is a Poisson curve with rate = median count rate of data. |
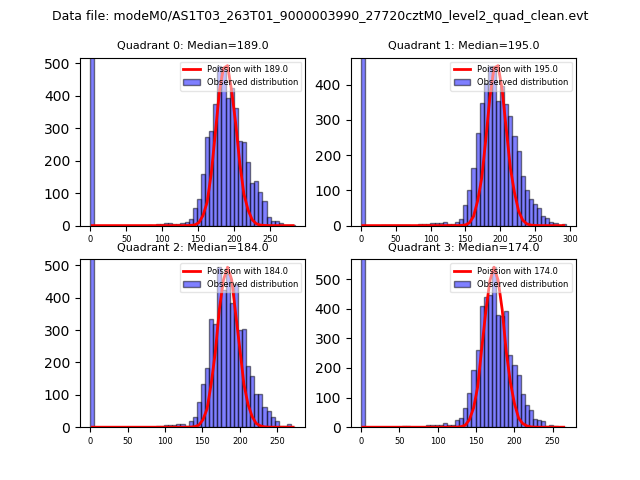 |
 |
| Quadrant-wise count rates Data is divided into 100 sec bins |
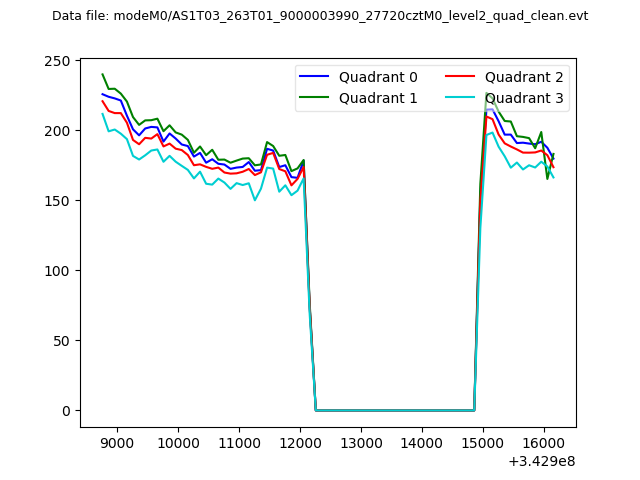 |
|
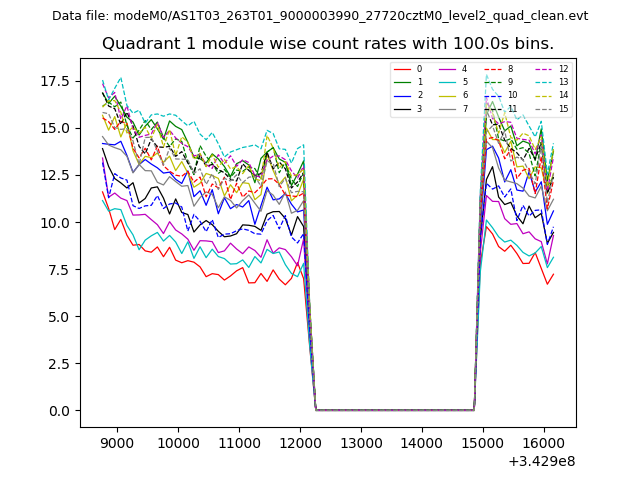
| Module-wise count rates for Quadrant A Data is divided into 100 sec bins |
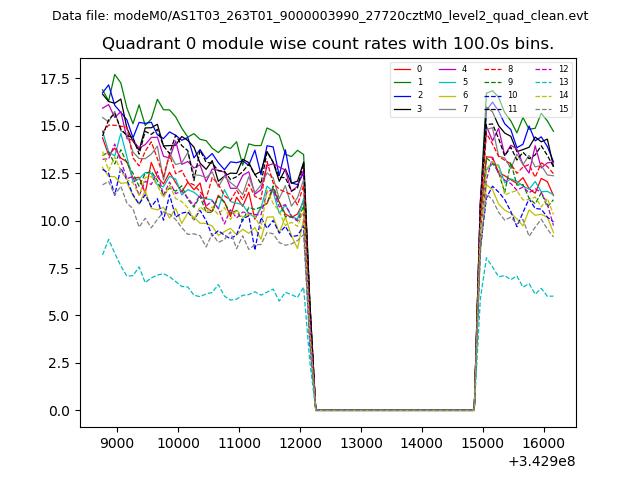 |
 |
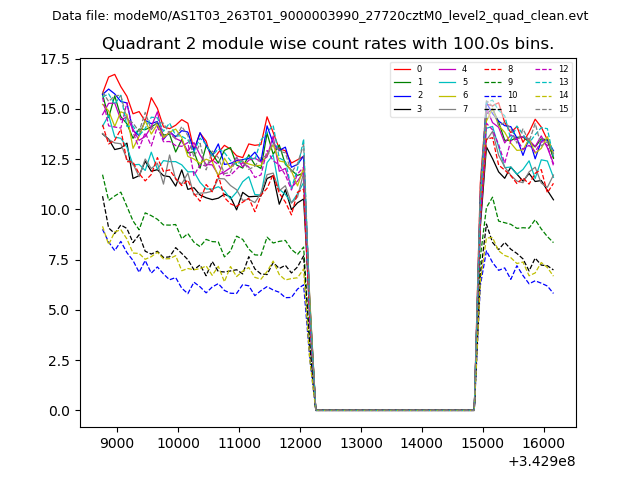
| Module-wise count rates for Quadrant B Data is divided into 100 sec bins |
 |
 |
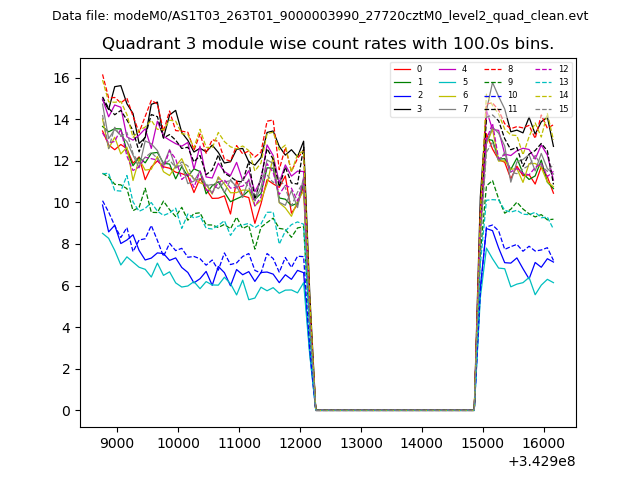
| Module-wise count rates for Quadrant C Data is divided into 100 sec bins |
 |
 |
| Module-wise count rates for Quadrant D Data is divided into 100 sec bins |
 |
 |
| Parameter | Plot |
|---|---|
| CZT HV Monitor | 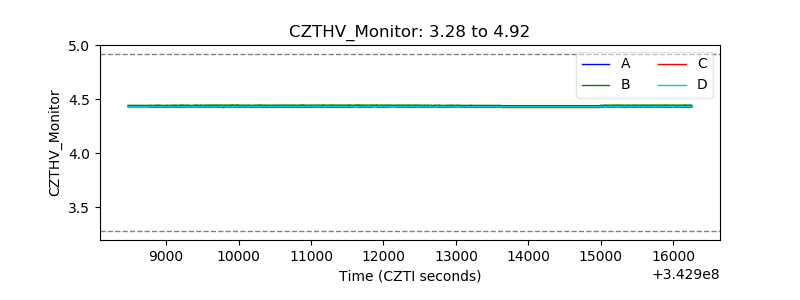 |
| D_VDD | 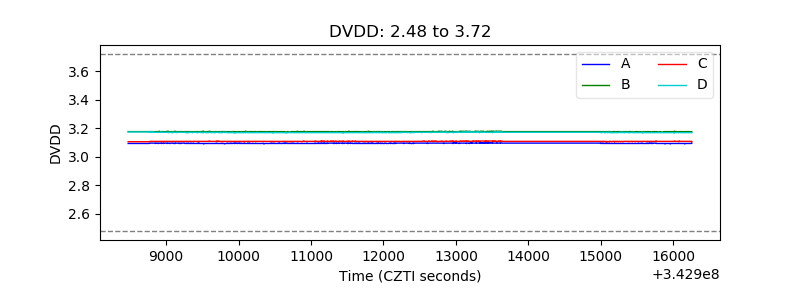 |
| Temperature 1 | 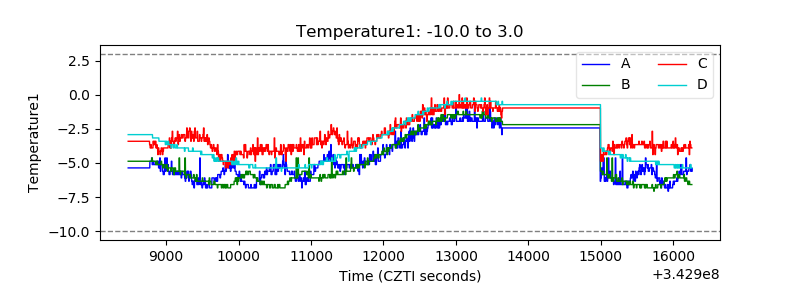 |
| Veto HV Monitor | 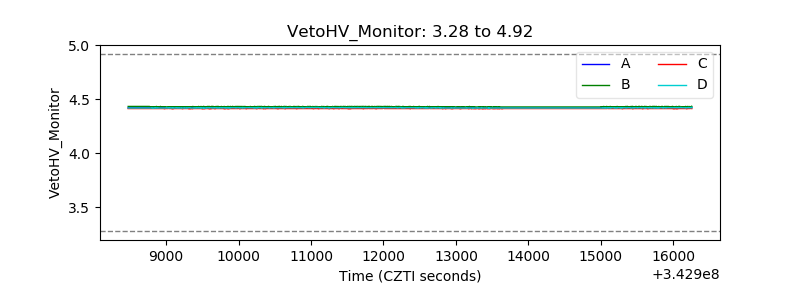 |
| Veto LLD | 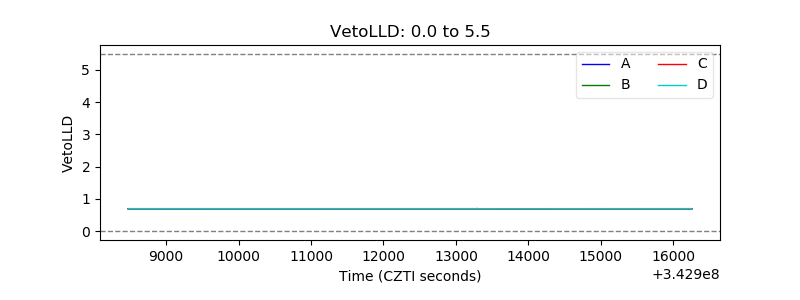 |
| Alpha Counter | 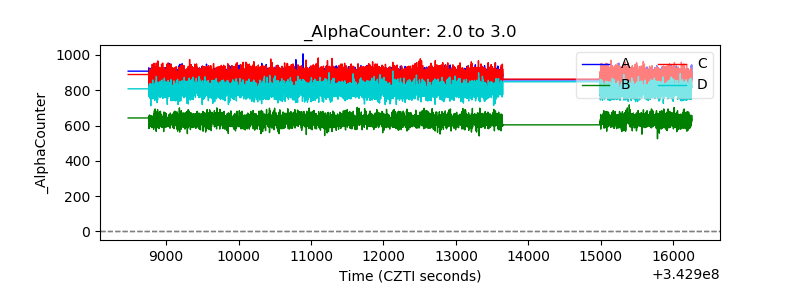 |
| _CPM_Rate | 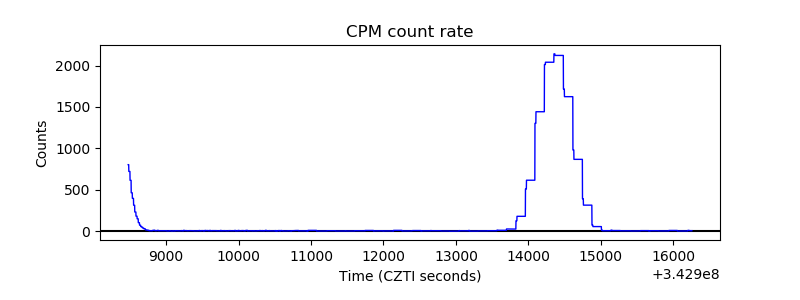 |
| CZT Counter | 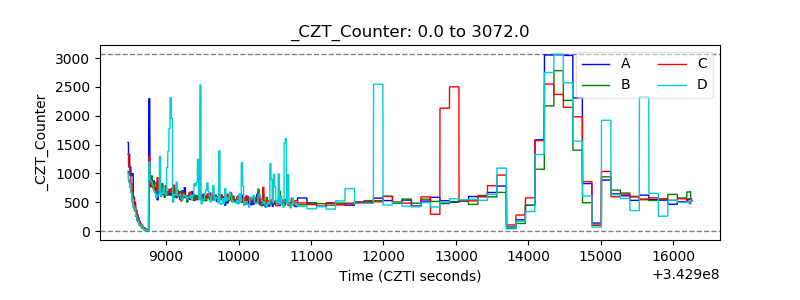 |
| +2.5 Volts monitor |  |
| +5 Volts monitor |  |
| _ROLL_ROT | 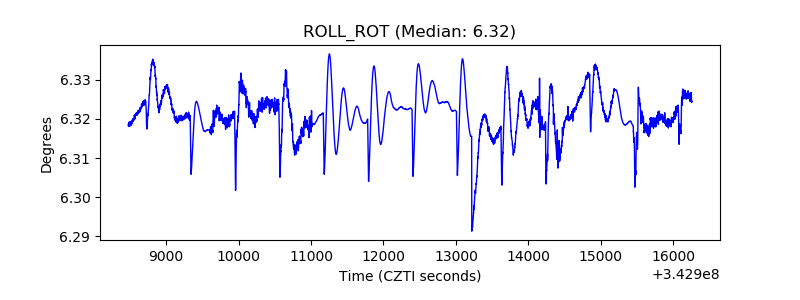 |
| _Roll_DEC | 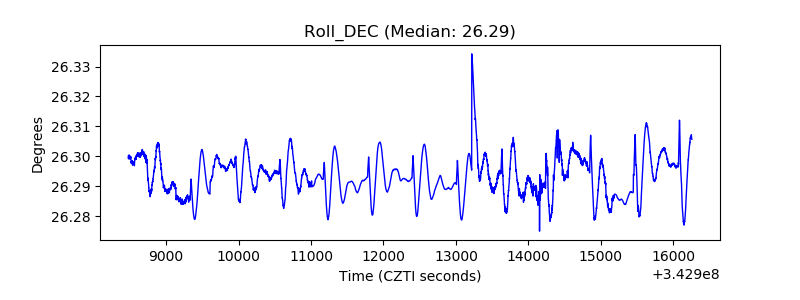 |
| _Roll_RA | 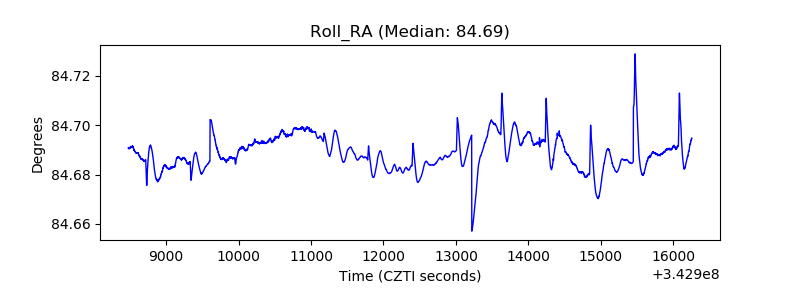 |
| Veto Counter | 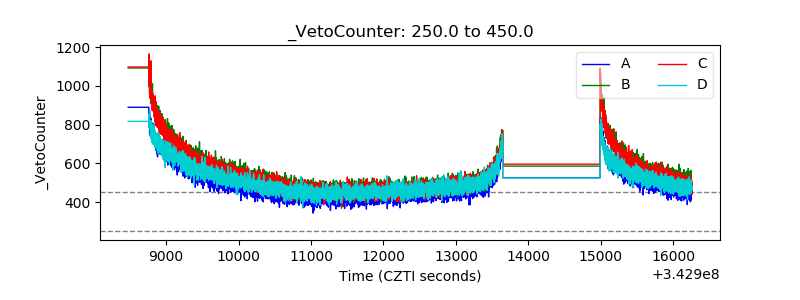 |