| Param | Original file | Final file |
|---|---|---|
| Filename | modeM0/AS1T03_263T01_9000003990_27721cztM0_level2.evt | modeM0/AS1T03_263T01_9000003990_27721cztM0_level2_quad_clean.evt |
| Size (bytes) | 534,513,600 | 126,057,600 |
| Size | 509.8 MB | 120.2 MB |
| Events in quadrant A | 3,886,856 | 856,348 |
| Events in quadrant B | 3,891,783 | 876,201 |
| Events in quadrant C | 3,713,177 | 834,935 |
| Events in quadrant D | 4,246,203 | 788,026 |
| Mode M0 | |||
|---|---|---|---|
| Quadrant | BADHDUFLAG | Total packets | Discarded packets |
| A | 0 | 15549 | 0 |
| B | 0 | 15611 | 0 |
| C | 0 | 14996 | 0 |
| D | 0 | 16919 | 0 |
| Mode M9 | |||
|---|---|---|---|
| Quadrant | BADHDUFLAG | Total packets | Discarded packets |
| A | 0 | 14 | 0 |
| B | 0 | 15 | 0 |
| C | 0 | 15 | 0 |
| D | 0 | 15 | 0 |
| Quadrant | Total seconds | Saturated seconds | Saturation percentage |
|---|---|---|---|
| A | 6638 | 61 | 0.918951% |
| B | 6638 | 150 | 2.259717% |
| C | 6638 | 108 | 1.626996% |
| D | 6638 | 181 | 2.726725% |
Noise dominated data is calculated using 1-second bins in cleaned event files. If a bin has >2000 counts, and if more than 50% of those come from <1% of pixels, then it is considered to be noise-dominated and hence unusable.
| Quadrant | # 1 sec bins | Bins with >0 counts | Bins with >2000 counts | High rate bins dominated by noise | Noise dominated (total time) | Noise dominated (detector-on time) | Marked lightcurve |
|---|---|---|---|---|---|---|---|
| A | 7873 | 6639 | 42 | 42 | 0.53% | 0.63% | 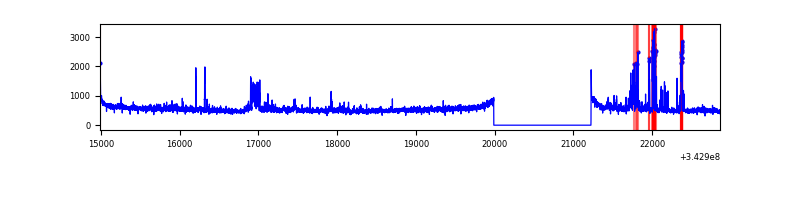 |
| B | 7873 | 6638 | 84 | 84 | 1.07% | 1.27% | 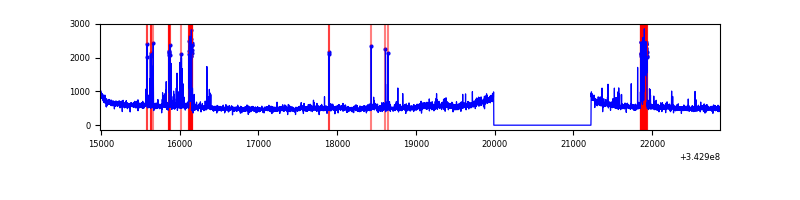 |
| C | 7873 | 6638 | 9 | 9 | 0.11% | 0.14% | 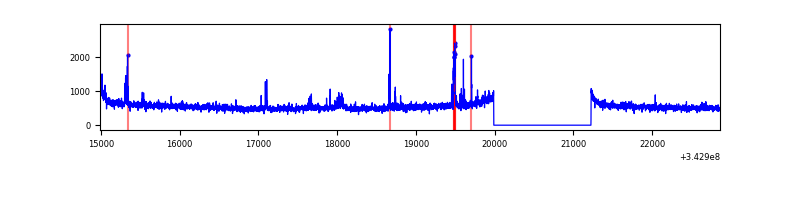 |
| D | 7873 | 6639 | 144 | 144 | 1.83% | 2.17% | 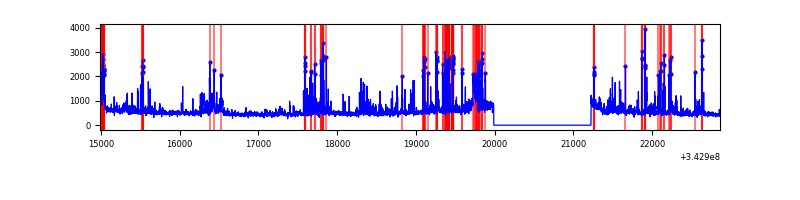 |
Top three noisy pixels from each quadrant. If the there are fewer than three noisy pixels in the level2.evt file, extra rows are filled as -1
| Pixel properties | Quadrant properties | ||||||
|---|---|---|---|---|---|---|---|
| Quadrant | DetID | PixID | Counts | Sigma | Mean | Median | Sigma |
| A | 0 | 13 | 248181 | 1320.32 | 895 | 884 | 187.3 |
| A | 6 | 16 | 175572 | 932.66 | 895 | 884 | 187.3 |
| A | 8 | 192 | 13154 | 65.51 | 895 | 884 | 187.3 |
| B | 3 | 64 | 352566 | 1972.32 | 898 | 882 | 178.3 |
| B | 12 | 111 | 19239 | 102.95 | 898 | 882 | 178.3 |
| B | 11 | 111 | 17009 | 90.44 | 898 | 882 | 178.3 |
| C | 14 | 238 | 142929 | 672.48 | 865 | 875 | 211.2 |
| C | 3 | 233 | 102177 | 479.56 | 865 | 875 | 211.2 |
| C | 0 | 207 | 63272 | 295.39 | 865 | 875 | 211.2 |
| D | 1 | 52 | 837321 | 3970.07 | 848 | 827 | 210.7 |
| D | 11 | 176 | 113267 | 533.65 | 848 | 827 | 210.7 |
| D | 2 | 250 | 73058 | 342.81 | 848 | 827 | 210.7 |
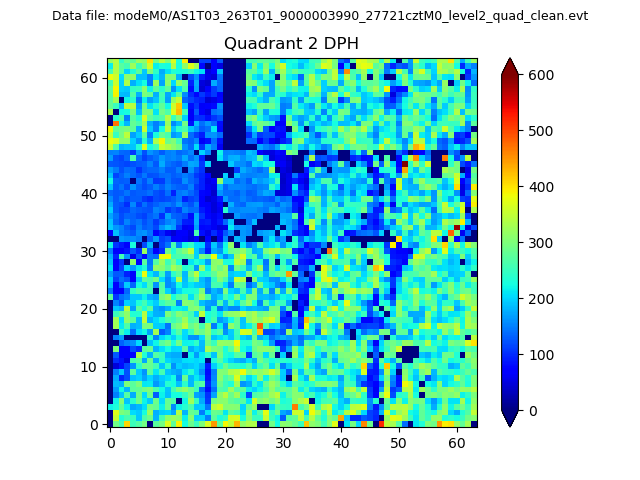
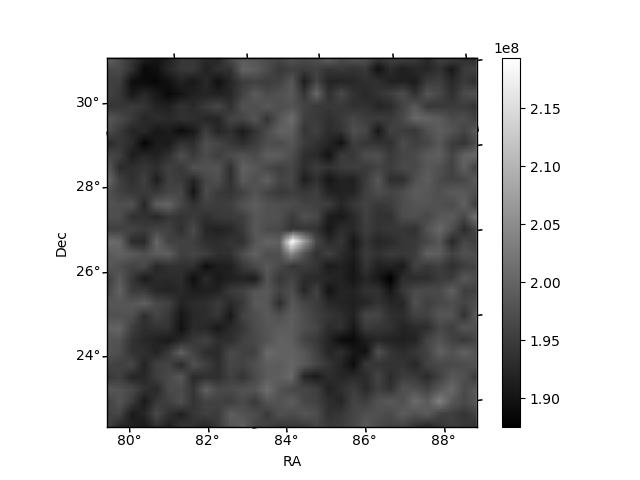
Histogram calculated using DETX and DETY for each event in the final _common_clean file
| Quadrant A | 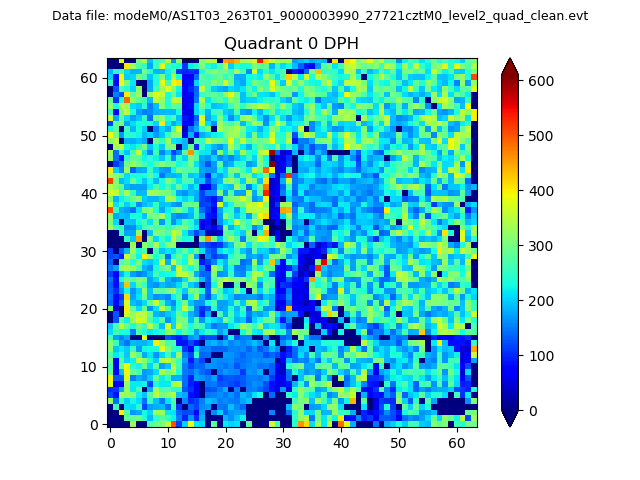 |
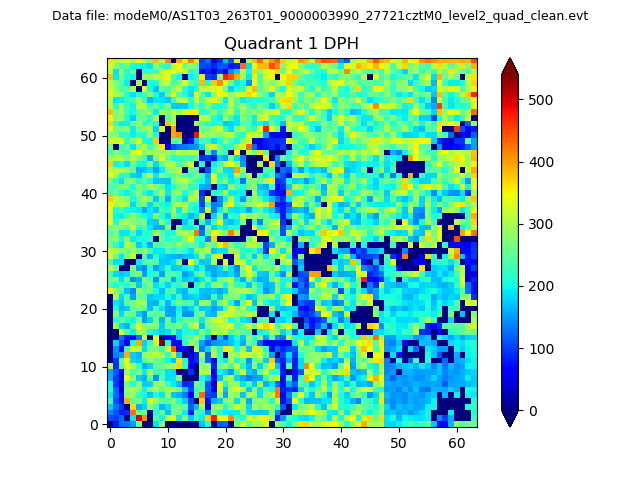 |
Quadrant B |
|---|---|---|---|
| Quadrant D | 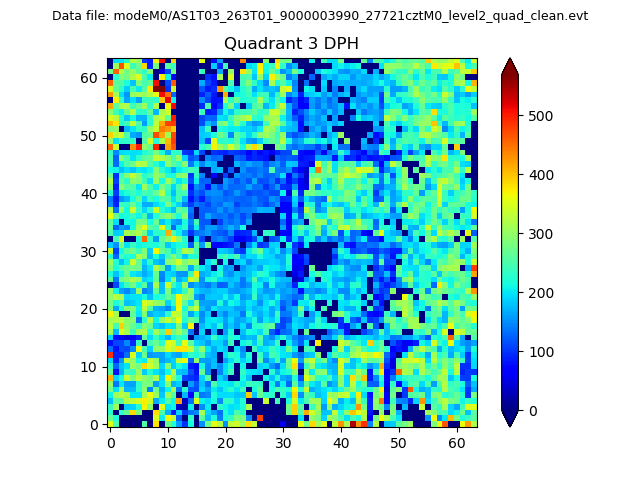 |
 |
Quadrant C |
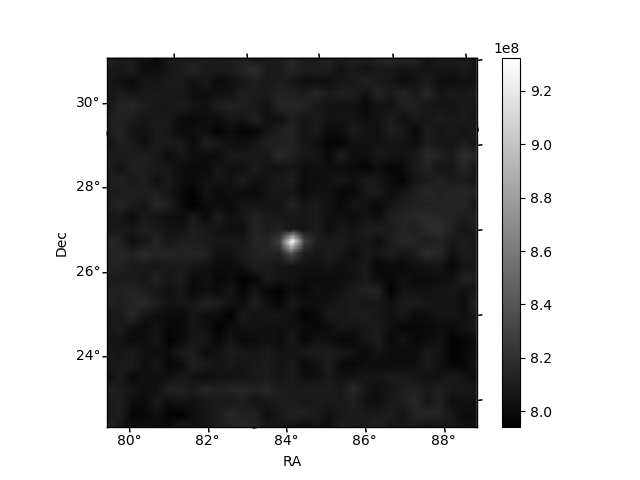
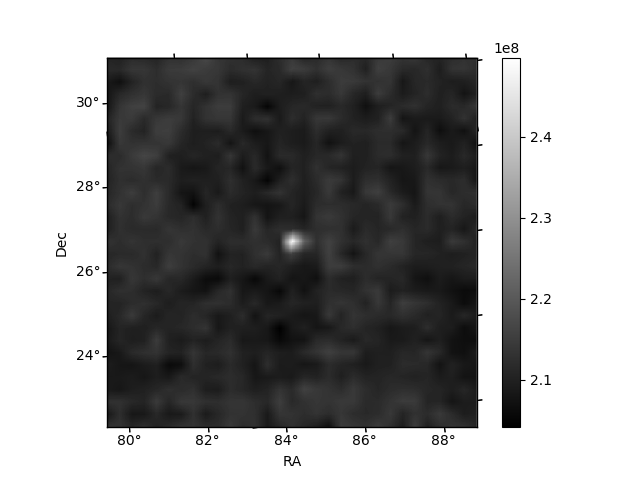
| Plot type | Count rate plots | Images |
|---|---|---|
| Comparison with Poisson distribution Blue bars denote a histogram of data divided into 1 sec bins. Red curve is a Poisson curve with rate = median count rate of data. |
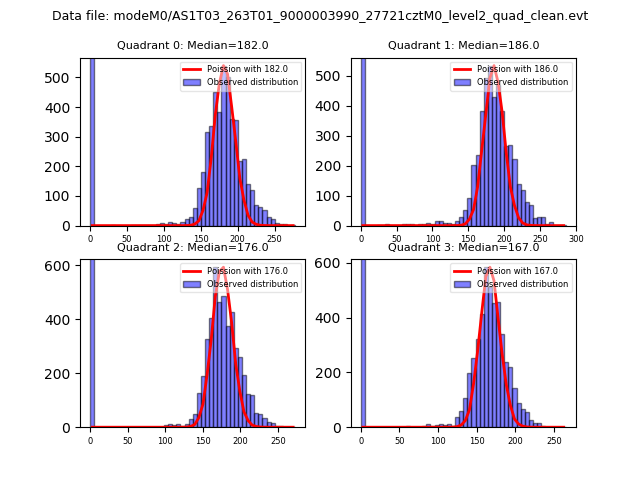 |
 |
| Quadrant-wise count rates Data is divided into 100 sec bins |
 |
|
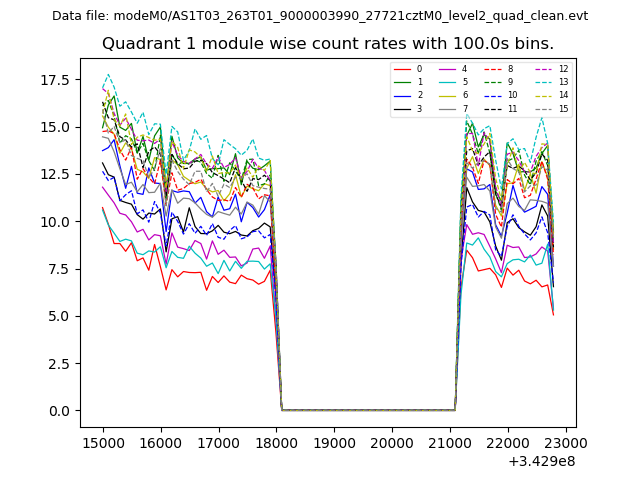
| Module-wise count rates for Quadrant A Data is divided into 100 sec bins |
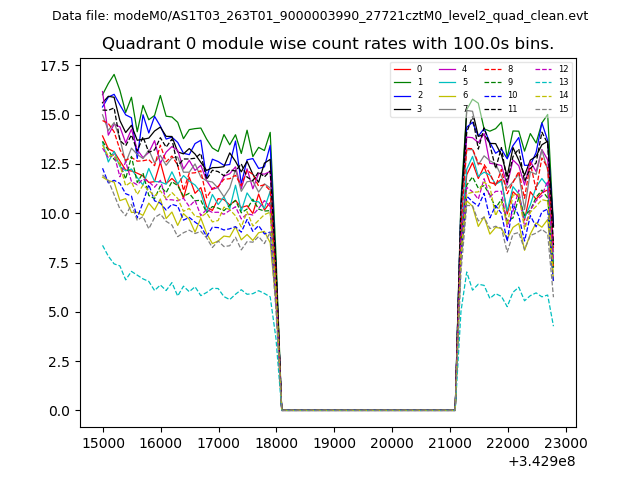 |
 |
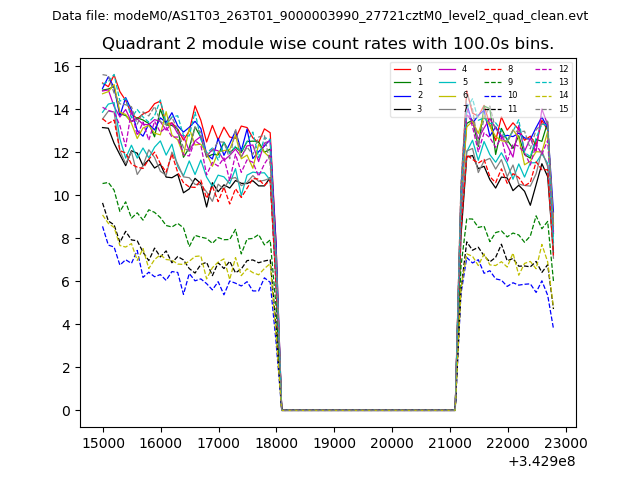
| Module-wise count rates for Quadrant B Data is divided into 100 sec bins |
 |
 |
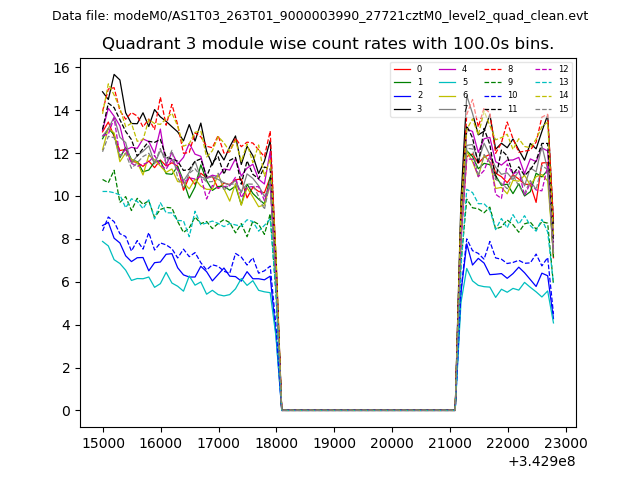
| Module-wise count rates for Quadrant C Data is divided into 100 sec bins |
 |
 |
| Module-wise count rates for Quadrant D Data is divided into 100 sec bins |
 |
 |
| Parameter | Plot |
|---|---|
| CZT HV Monitor | 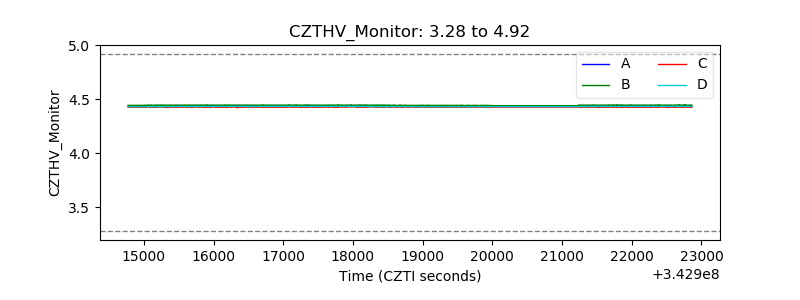 |
| D_VDD | 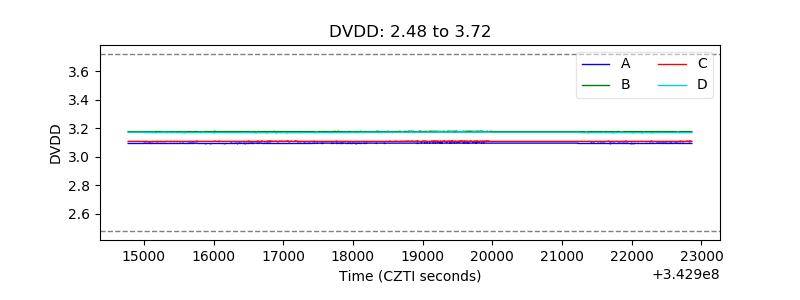 |
| Temperature 1 | 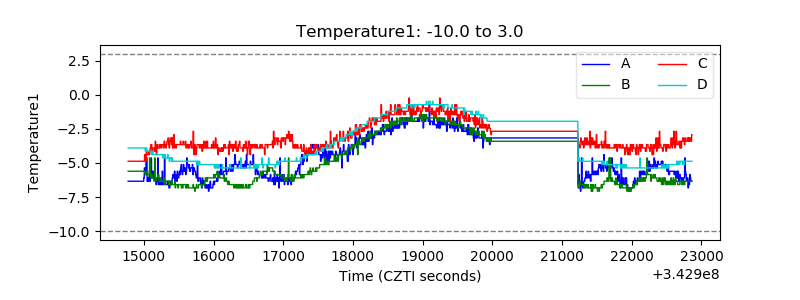 |
| Veto HV Monitor | 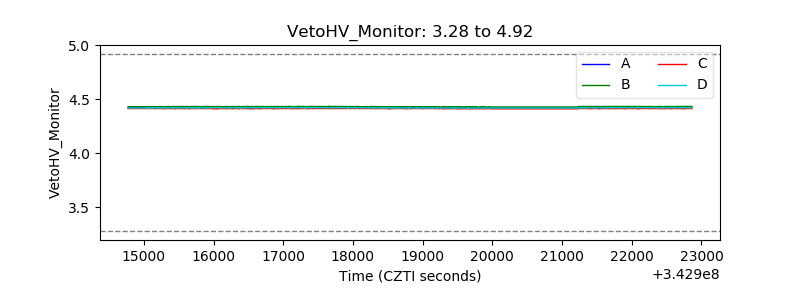 |
| Veto LLD | 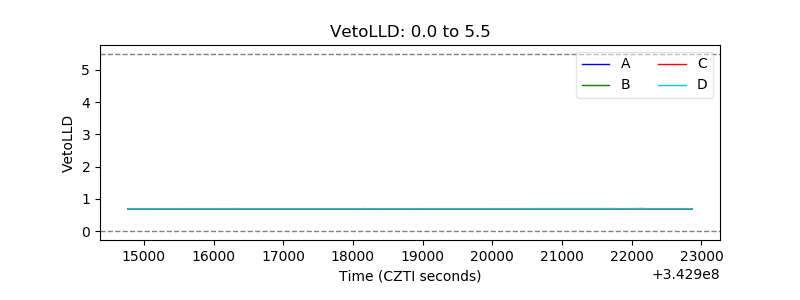 |
| Alpha Counter | 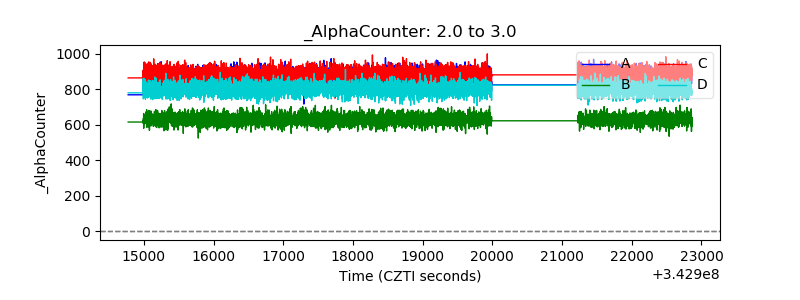 |
| _CPM_Rate | 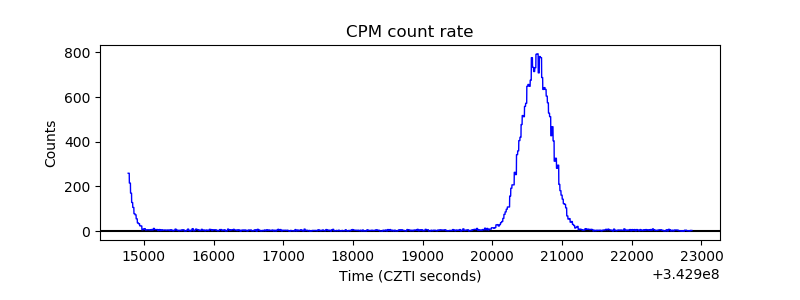 |
| CZT Counter | 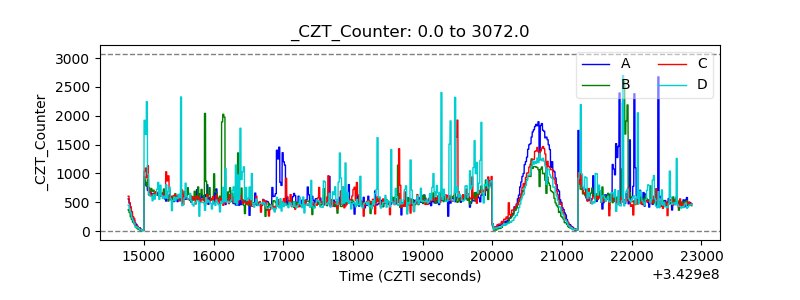 |
| +2.5 Volts monitor |  |
| +5 Volts monitor |  |
| _ROLL_ROT | 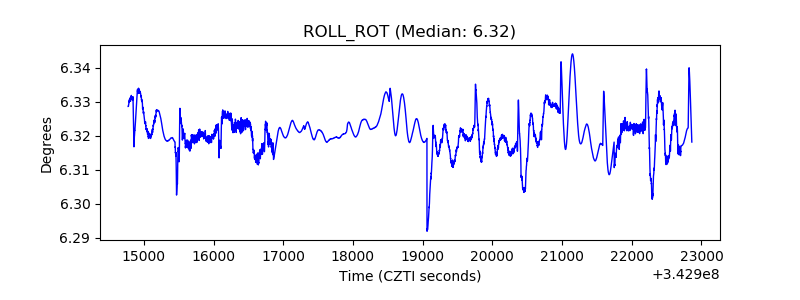 |
| _Roll_DEC | 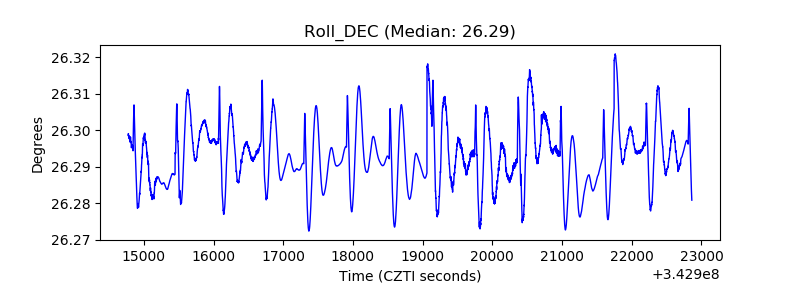 |
| _Roll_RA | 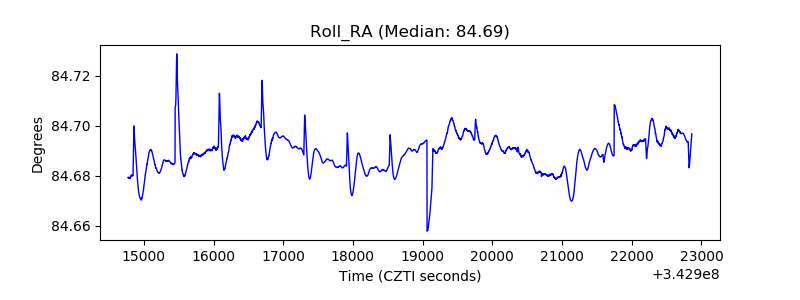 |
| Veto Counter | 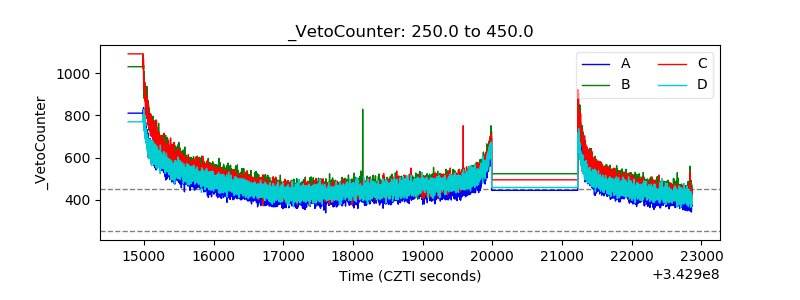 |