| Param | Original file | Final file |
|---|---|---|
| Filename | modeM0/AS1T03_263T01_9000003990_27722cztM0_level2.evt | modeM0/AS1T03_263T01_9000003990_27722cztM0_level2_quad_clean.evt |
| Size (bytes) | 521,308,800 | 109,126,080 |
| Size | 497.2 MB | 104.1 MB |
| Events in quadrant A | 3,807,895 | 730,316 |
| Events in quadrant B | 3,518,773 | 745,535 |
| Events in quadrant C | 3,833,249 | 711,750 |
| Events in quadrant D | 4,189,455 | 666,428 |
| Mode M0 | |||
|---|---|---|---|
| Quadrant | BADHDUFLAG | Total packets | Discarded packets |
| A | 0 | 15307 | 0 |
| B | 0 | 14307 | 0 |
| C | 0 | 15475 | 0 |
| D | 0 | 16807 | 0 |
| Mode M9 | |||
|---|---|---|---|
| Quadrant | BADHDUFLAG | Total packets | Discarded packets |
| A | 0 | 8 | 0 |
| B | 0 | 8 | 0 |
| C | 0 | 8 | 0 |
| D | 0 | 8 | 0 |
| Quadrant | Total seconds | Saturated seconds | Saturation percentage |
|---|---|---|---|
| A | 6461 | 141 | 2.182325% |
| B | 6462 | 151 | 2.336738% |
| C | 6462 | 168 | 2.599814% |
| D | 6462 | 246 | 3.806871% |
Noise dominated data is calculated using 1-second bins in cleaned event files. If a bin has >2000 counts, and if more than 50% of those come from <1% of pixels, then it is considered to be noise-dominated and hence unusable.
| Quadrant | # 1 sec bins | Bins with >0 counts | Bins with >2000 counts | High rate bins dominated by noise | Noise dominated (total time) | Noise dominated (detector-on time) | Marked lightcurve |
|---|---|---|---|---|---|---|---|
| A | 7276 | 6461 | 40 | 40 | 0.55% | 0.62% | 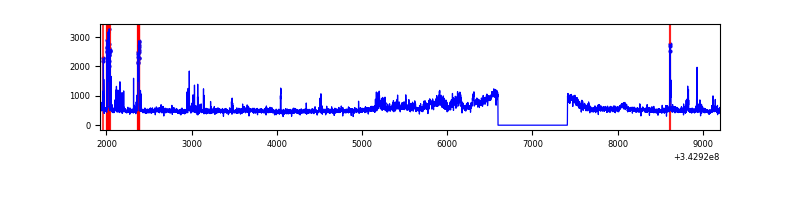 |
| B | 7277 | 6462 | 16 | 16 | 0.22% | 0.25% | 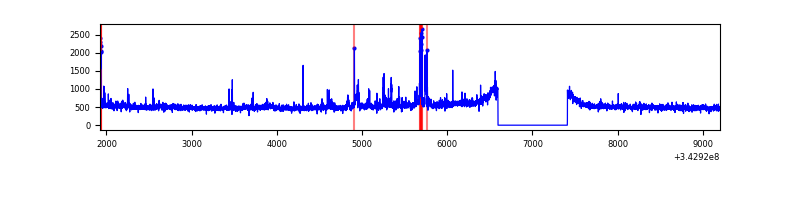 |
| C | 7277 | 6462 | 2 | 2 | 0.03% | 0.03% | 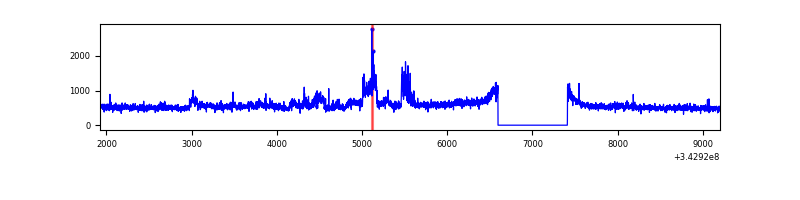 |
| D | 7277 | 6462 | 173 | 173 | 2.38% | 2.68% | 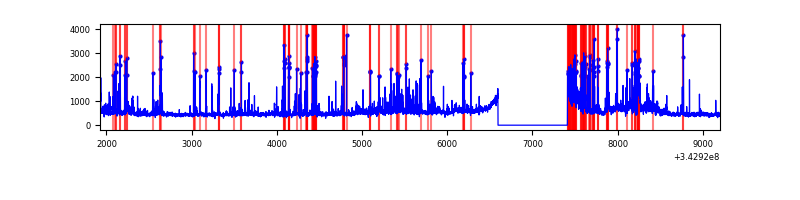 |
Top three noisy pixels from each quadrant. If the there are fewer than three noisy pixels in the level2.evt file, extra rows are filled as -1
| Pixel properties | Quadrant properties | ||||||
|---|---|---|---|---|---|---|---|
| Quadrant | DetID | PixID | Counts | Sigma | Mean | Median | Sigma |
| A | 6 | 16 | 331965 | 1841.06 | 850 | 836 | 179.9 |
| A | 0 | 13 | 201934 | 1118.09 | 850 | 836 | 179.9 |
| A | 13 | 254 | 10926 | 56.1 | 850 | 836 | 179.9 |
| B | 3 | 64 | 144969 | 849.3 | 846 | 829 | 169.7 |
| B | 15 | 32 | 24234 | 137.91 | 846 | 829 | 169.7 |
| B | 4 | 200 | 21642 | 122.63 | 846 | 829 | 169.7 |
| C | 3 | 233 | 450748 | 2233.4 | 814 | 824 | 201.5 |
| C | 14 | 238 | 132266 | 652.47 | 814 | 824 | 201.5 |
| C | 0 | 207 | 73969 | 363.09 | 814 | 824 | 201.5 |
| D | 1 | 52 | 1009621 | 5066.54 | 801 | 782 | 199.1 |
| D | 11 | 176 | 109481 | 545.9 | 801 | 782 | 199.1 |
| D | 2 | 250 | 27493 | 134.15 | 801 | 782 | 199.1 |
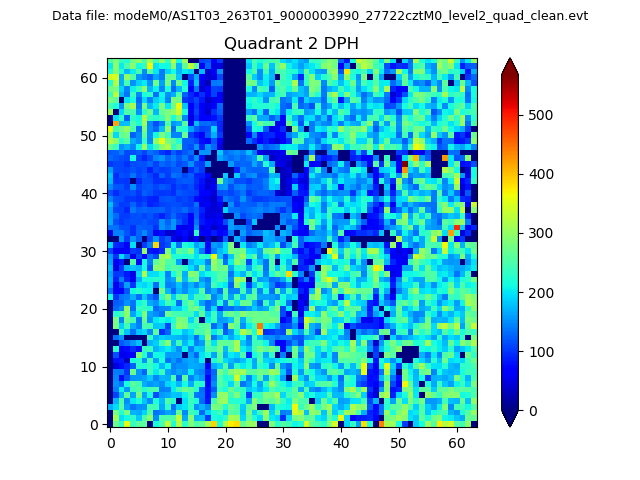
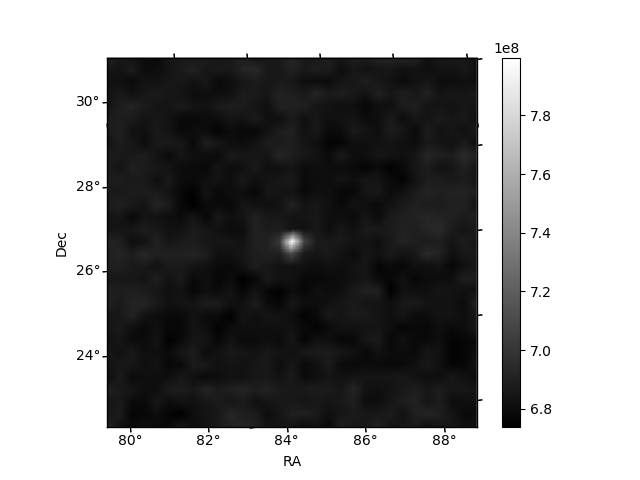
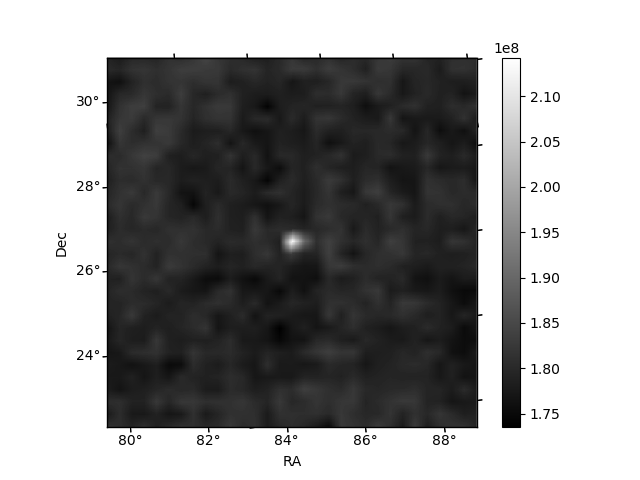
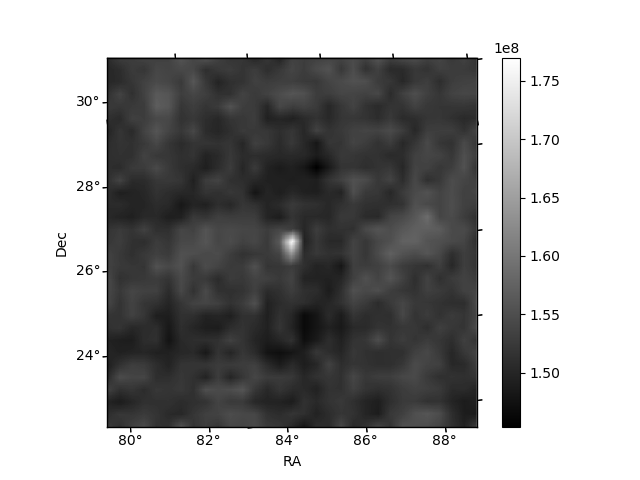
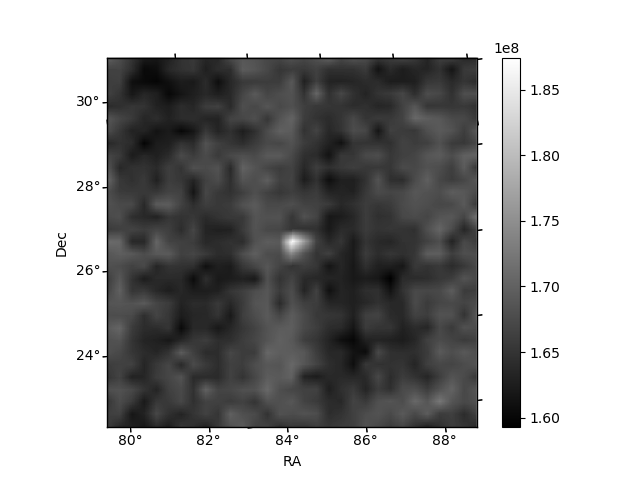
Histogram calculated using DETX and DETY for each event in the final _common_clean file
| Quadrant A | 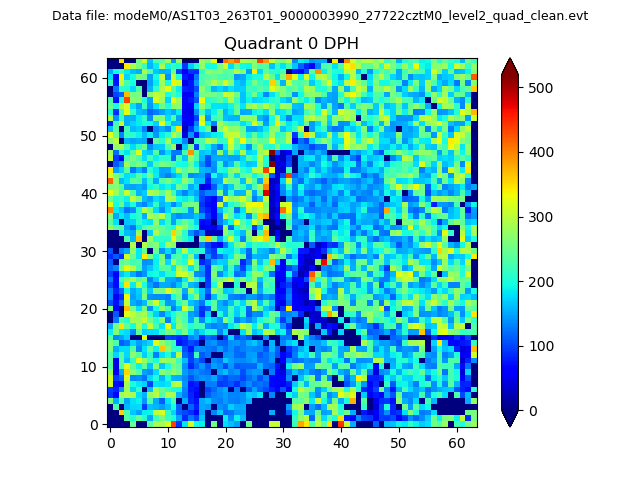 |
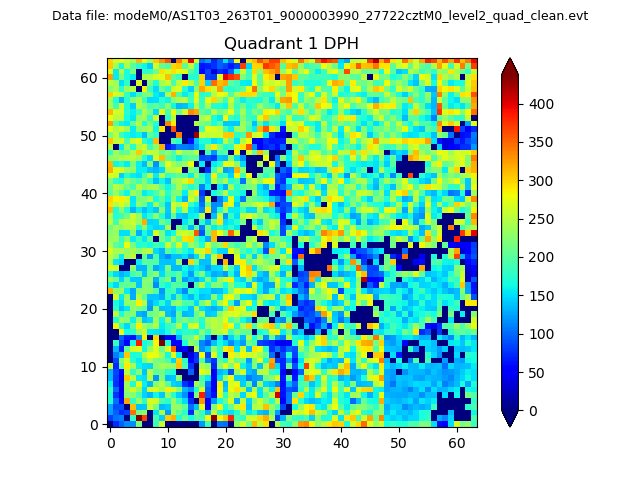 |
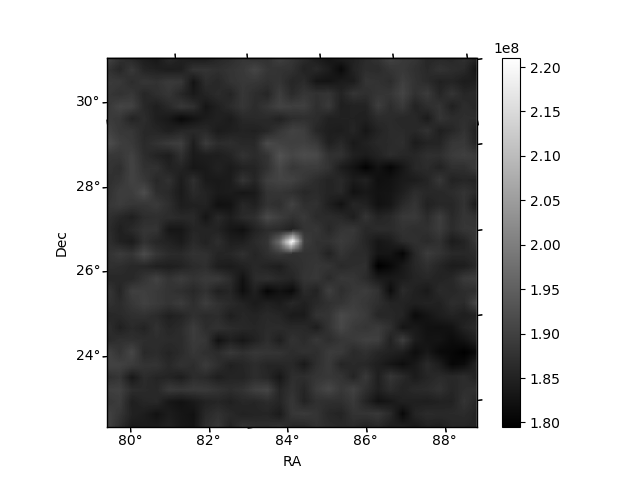
Quadrant B |
|---|---|---|---|
| Quadrant D | 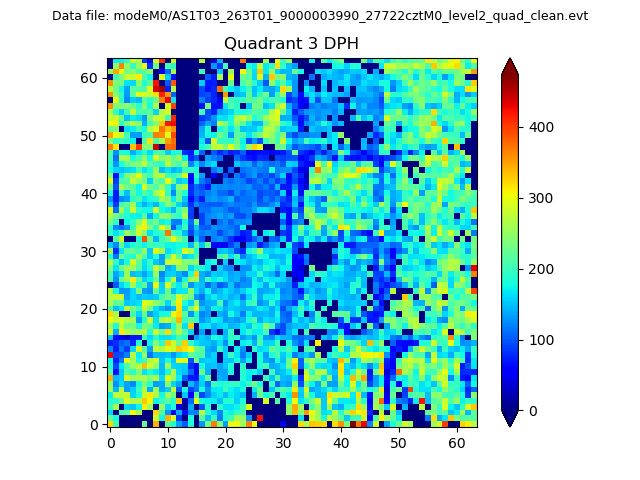 |
 |
Quadrant C |
| Plot type | Count rate plots | Images |
|---|---|---|
| Comparison with Poisson distribution Blue bars denote a histogram of data divided into 1 sec bins. Red curve is a Poisson curve with rate = median count rate of data. |
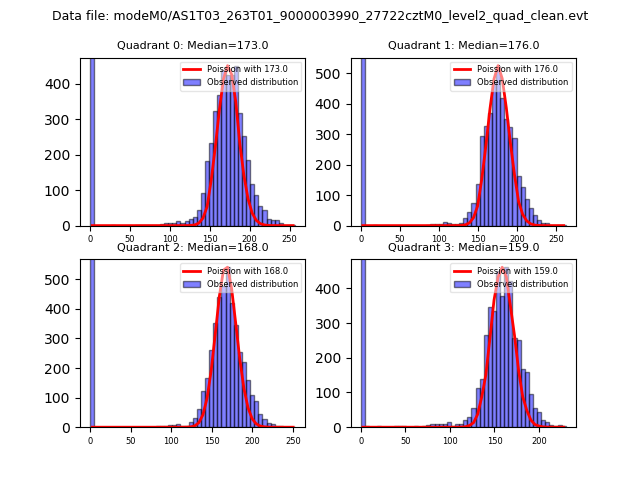 |
 |
| Quadrant-wise count rates Data is divided into 100 sec bins |
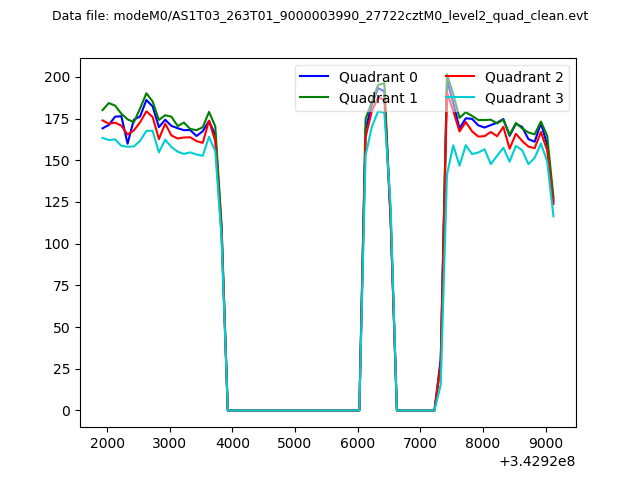 |
|
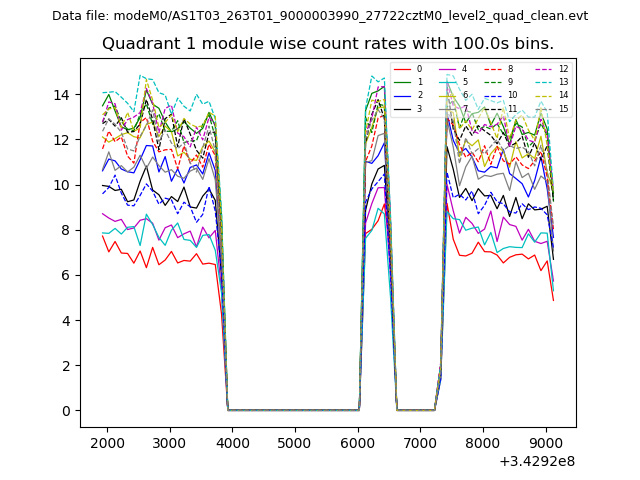
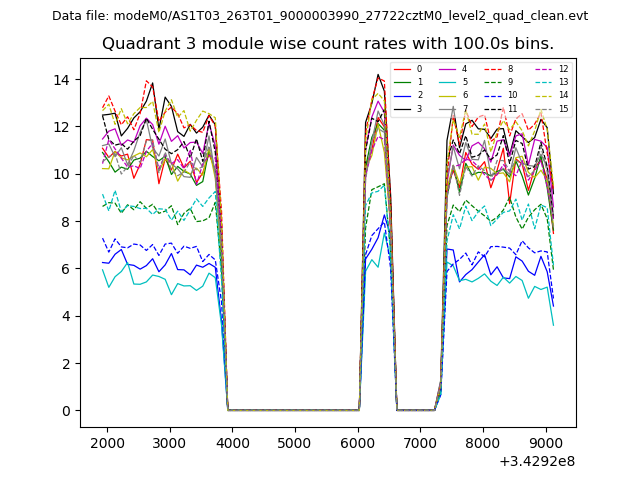
| Module-wise count rates for Quadrant A Data is divided into 100 sec bins |
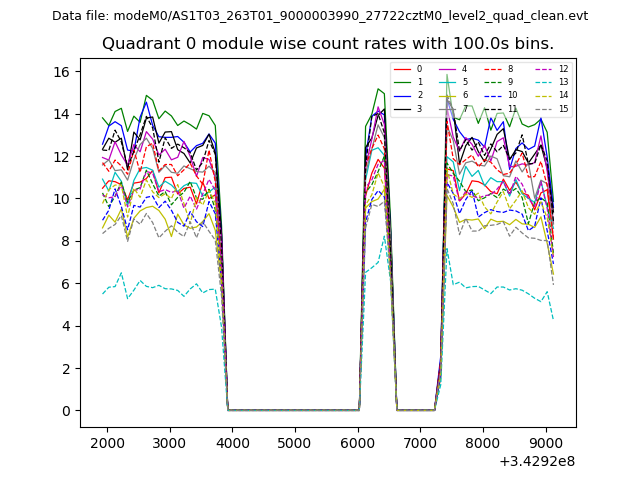 |
 |
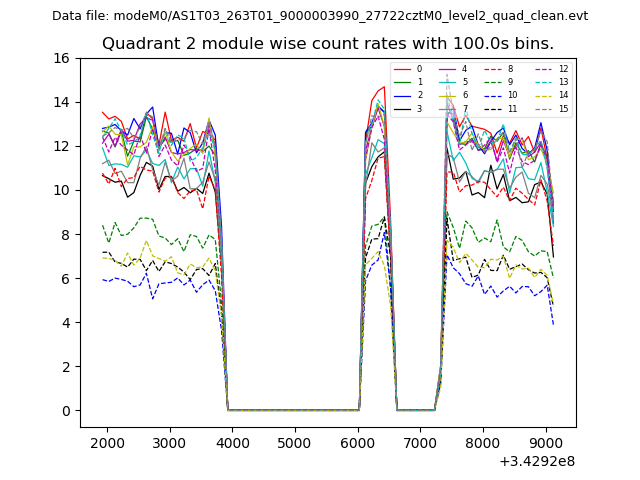
| Module-wise count rates for Quadrant B Data is divided into 100 sec bins |
 |
 |
| Module-wise count rates for Quadrant C Data is divided into 100 sec bins |
 |
 |
| Module-wise count rates for Quadrant D Data is divided into 100 sec bins |
 |
 |
| Parameter | Plot |
|---|---|
| CZT HV Monitor | 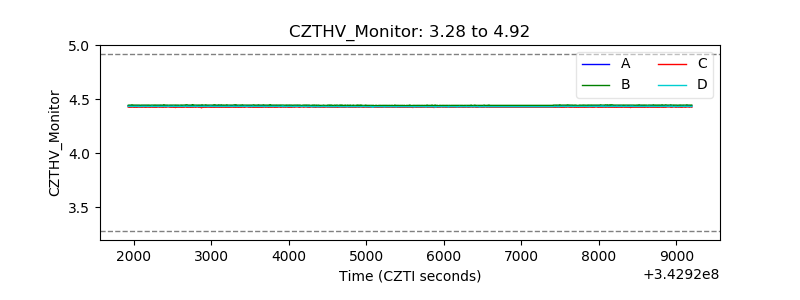 |
| D_VDD | 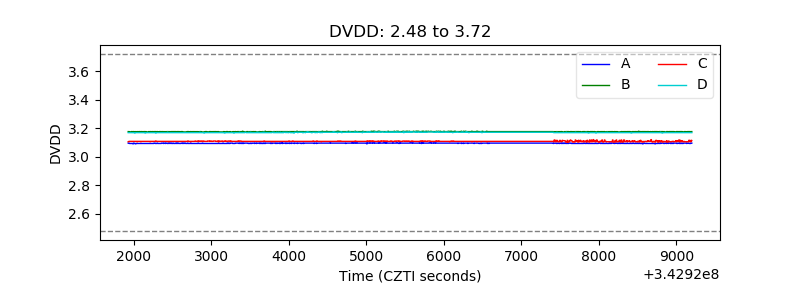 |
| Temperature 1 | 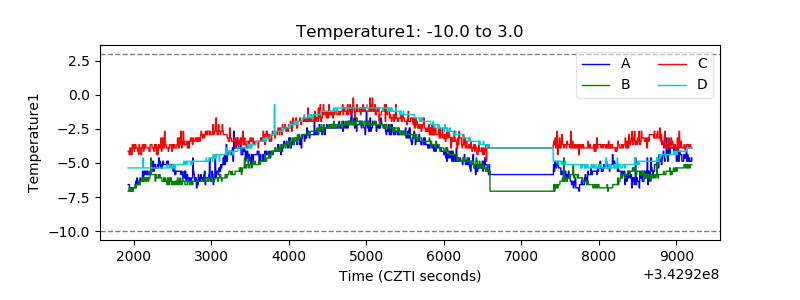 |
| Veto HV Monitor | 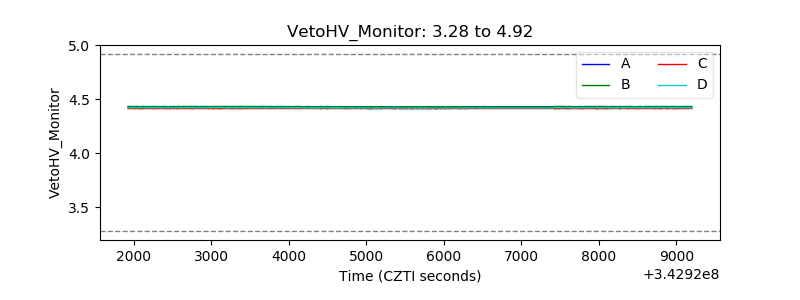 |
| Veto LLD | 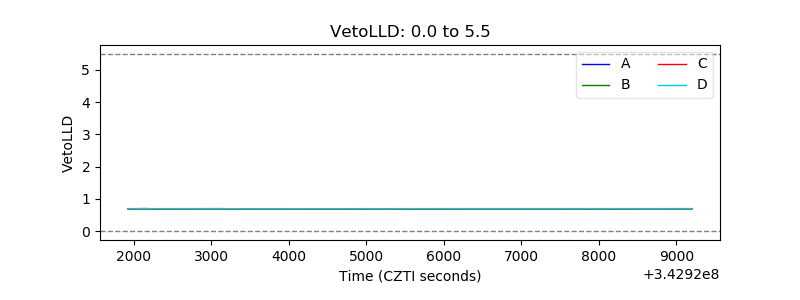 |
| Alpha Counter | 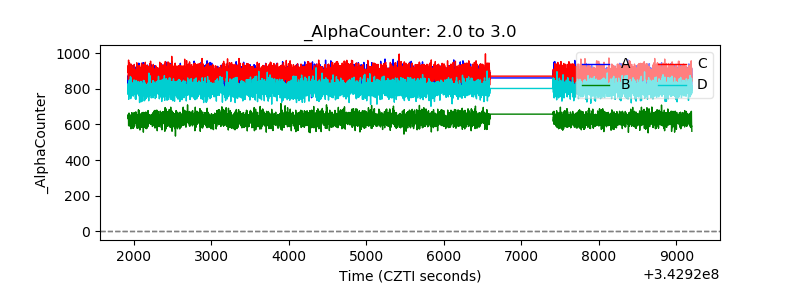 |
| _CPM_Rate | 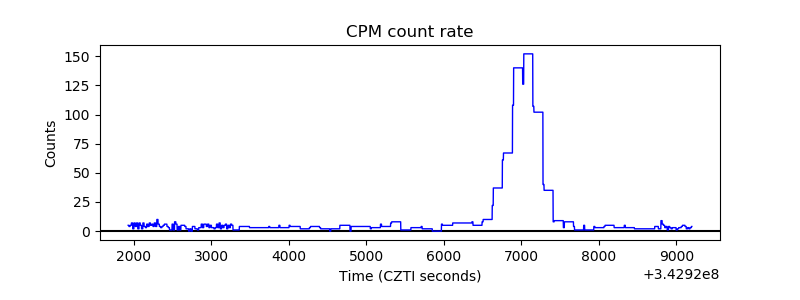 |
| CZT Counter | 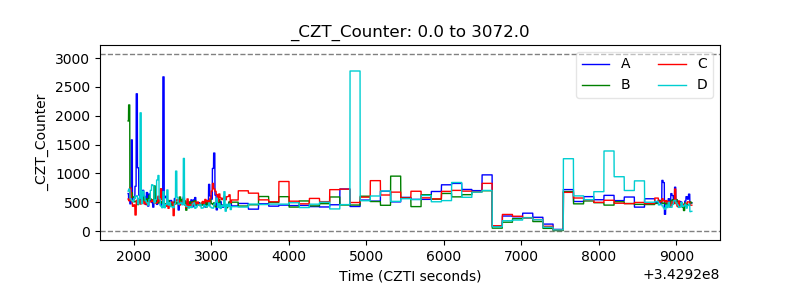 |
| +2.5 Volts monitor |  |
| +5 Volts monitor |  |
| _ROLL_ROT | 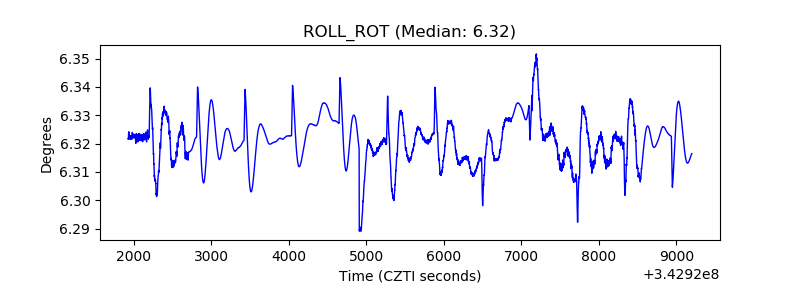 |
| _Roll_DEC | 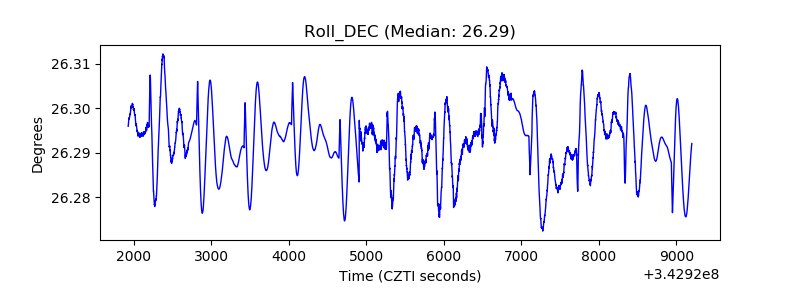 |
| _Roll_RA | 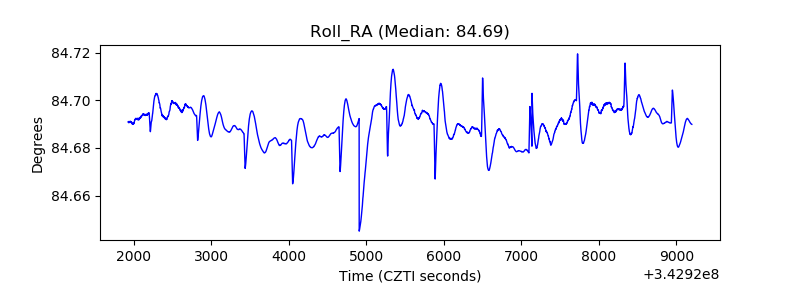 |
| Veto Counter | 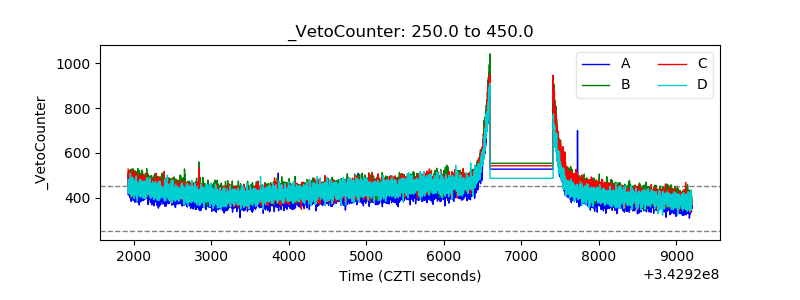 |