| Param | Original file | Final file |
|---|---|---|
| Filename | modeM0/AS1T03_263T01_9000003990_27723cztM0_level2.evt | modeM0/AS1T03_263T01_9000003990_27723cztM0_level2_quad_clean.evt |
| Size (bytes) | 571,818,240 | 120,706,560 |
| Size | 545.3 MB | 115.1 MB |
| Events in quadrant A | 4,197,901 | 812,174 |
| Events in quadrant B | 3,926,511 | 820,428 |
| Events in quadrant C | 3,632,450 | 794,546 |
| Events in quadrant D | 5,088,492 | 743,243 |
| Mode M0 | |||
|---|---|---|---|
| Quadrant | BADHDUFLAG | Total packets | Discarded packets |
| A | 0 | 16987 | 0 |
| B | 0 | 15810 | 0 |
| C | 0 | 14935 | 0 |
| D | 0 | 19761 | 0 |
| Mode M9 | |||
|---|---|---|---|
| Quadrant | BADHDUFLAG | Total packets | Discarded packets |
| A | 0 | 4 | 0 |
| B | 0 | 4 | 0 |
| C | 0 | 4 | 0 |
| D | 0 | 4 | 0 |
| Quadrant | Total seconds | Saturated seconds | Saturation percentage |
|---|---|---|---|
| A | 6965 | 113 | 1.622398% |
| B | 6966 | 245 | 3.517083% |
| C | 6966 | 87 | 1.248923% |
| D | 6966 | 520 | 7.464829% |
Noise dominated data is calculated using 1-second bins in cleaned event files. If a bin has >2000 counts, and if more than 50% of those come from <1% of pixels, then it is considered to be noise-dominated and hence unusable.
| Quadrant | # 1 sec bins | Bins with >0 counts | Bins with >2000 counts | High rate bins dominated by noise | Noise dominated (total time) | Noise dominated (detector-on time) | Marked lightcurve |
|---|---|---|---|---|---|---|---|
| A | 7410 | 6966 | 22 | 22 | 0.30% | 0.32% | 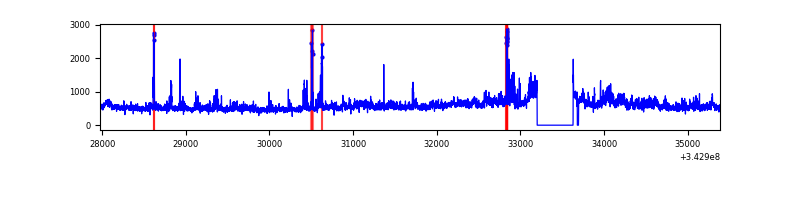 |
| B | 7411 | 6967 | 62 | 62 | 0.84% | 0.89% | 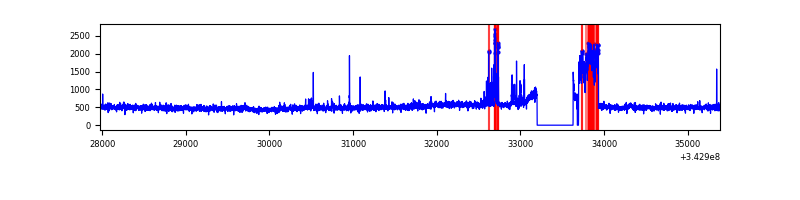 |
| C | 7411 | 6968 | 1 | 1 | 0.01% | 0.01% |  |
| D | 7411 | 6967 | 420 | 420 | 5.67% | 6.03% | 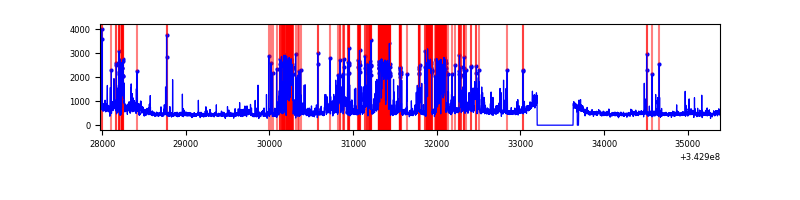 |
Top three noisy pixels from each quadrant. If the there are fewer than three noisy pixels in the level2.evt file, extra rows are filled as -1
| Pixel properties | Quadrant properties | ||||||
|---|---|---|---|---|---|---|---|
| Quadrant | DetID | PixID | Counts | Sigma | Mean | Median | Sigma |
| A | 6 | 16 | 539780 | 2762.93 | 903 | 891 | 195.0 |
| A | 0 | 13 | 175484 | 895.15 | 903 | 891 | 195.0 |
| A | 13 | 254 | 10590 | 49.73 | 903 | 891 | 195.0 |
| B | 3 | 64 | 385947 | 2113.36 | 894 | 876 | 182.2 |
| B | 12 | 111 | 20168 | 105.88 | 894 | 876 | 182.2 |
| B | 11 | 111 | 18131 | 94.7 | 894 | 876 | 182.2 |
| C | 14 | 238 | 140246 | 647.36 | 868 | 877 | 215.3 |
| C | 3 | 233 | 61948 | 283.67 | 868 | 877 | 215.3 |
| C | 0 | 207 | 25201 | 112.98 | 868 | 877 | 215.3 |
| D | 1 | 52 | 1705189 | 8143.14 | 831 | 811 | 209.3 |
| D | 11 | 176 | 197818 | 941.26 | 831 | 811 | 209.3 |
| D | 2 | 250 | 43695 | 204.89 | 831 | 811 | 209.3 |
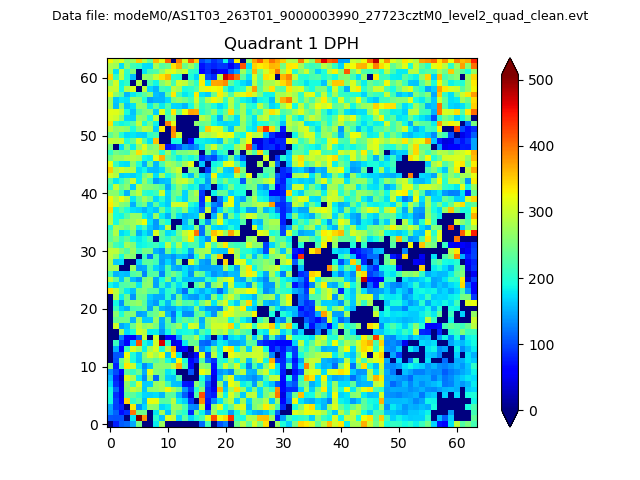
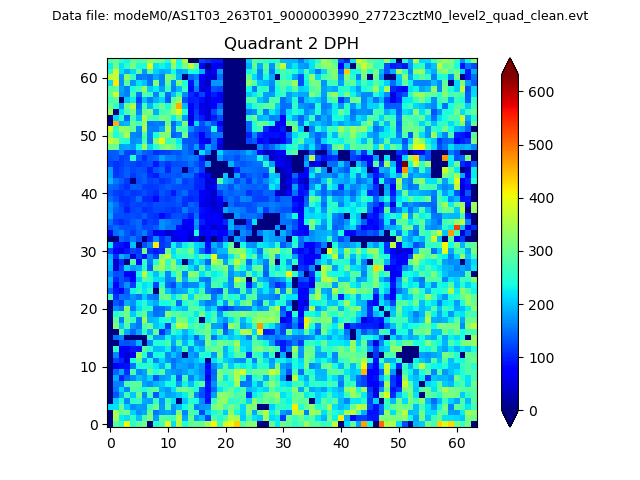
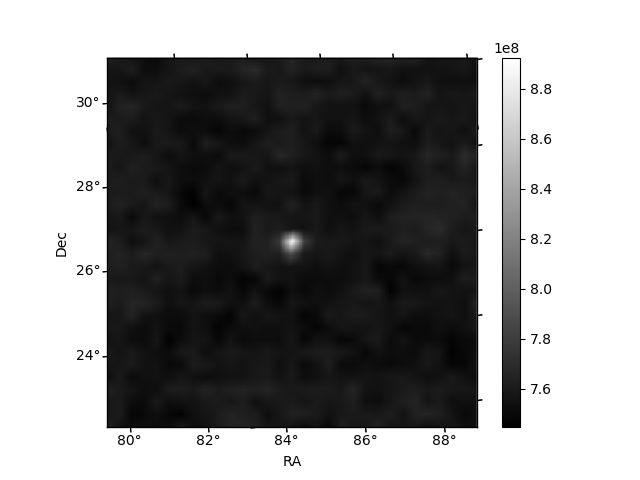
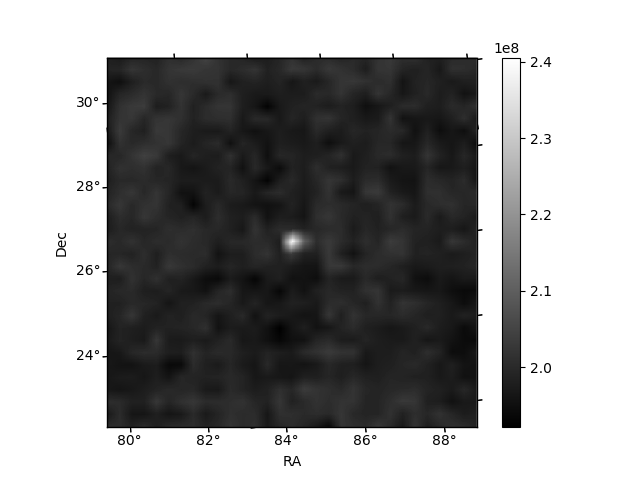
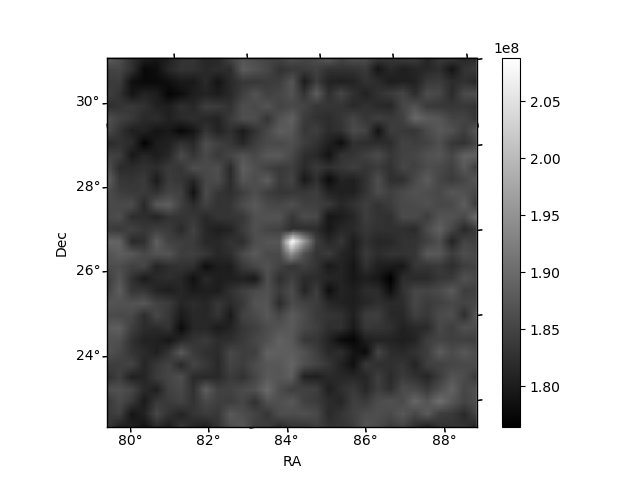
Histogram calculated using DETX and DETY for each event in the final _common_clean file
| Quadrant A | 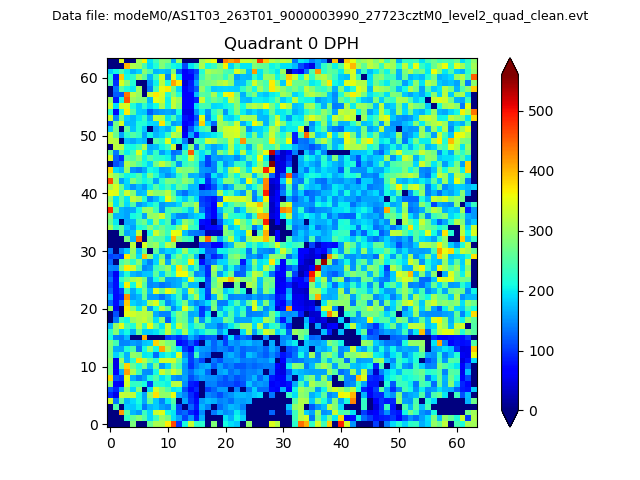 |
 |
Quadrant B |
|---|---|---|---|
| Quadrant D | 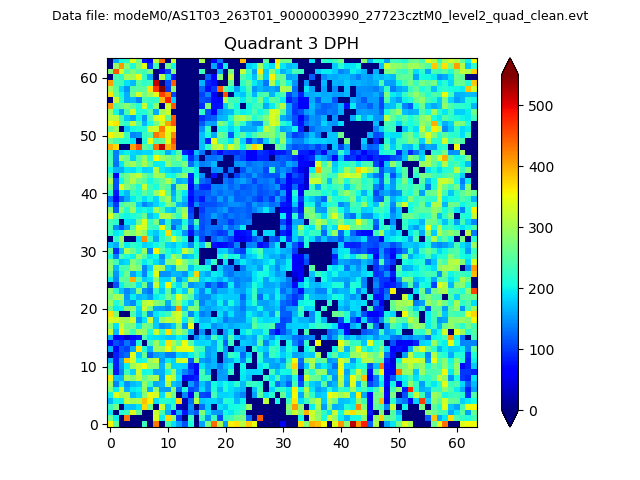 |
 |
Quadrant C |
| Plot type | Count rate plots | Images |
|---|---|---|
| Comparison with Poisson distribution Blue bars denote a histogram of data divided into 1 sec bins. Red curve is a Poisson curve with rate = median count rate of data. |
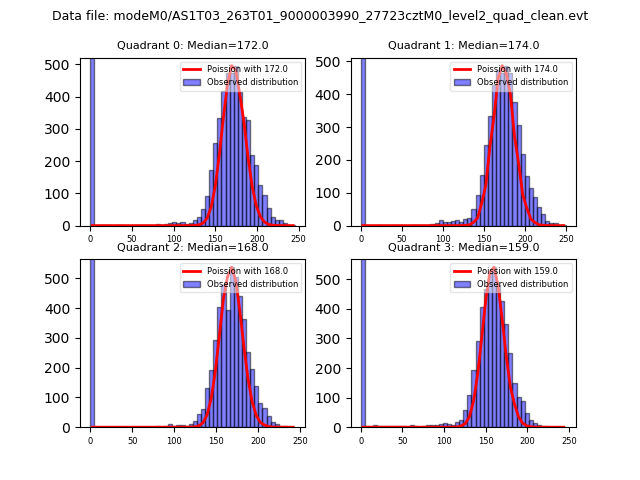 |
 |
| Quadrant-wise count rates Data is divided into 100 sec bins |
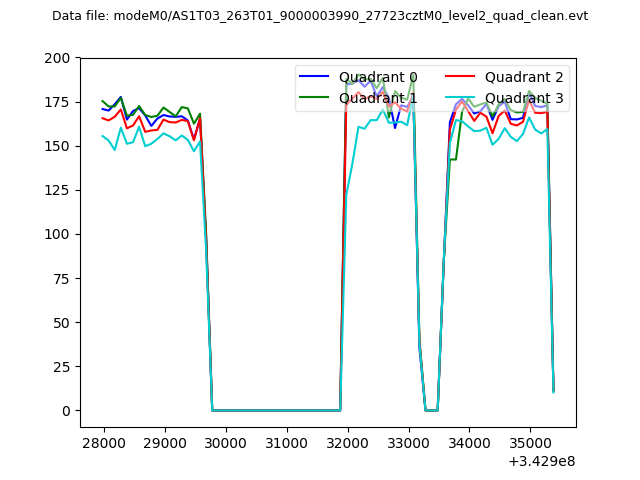 |
|
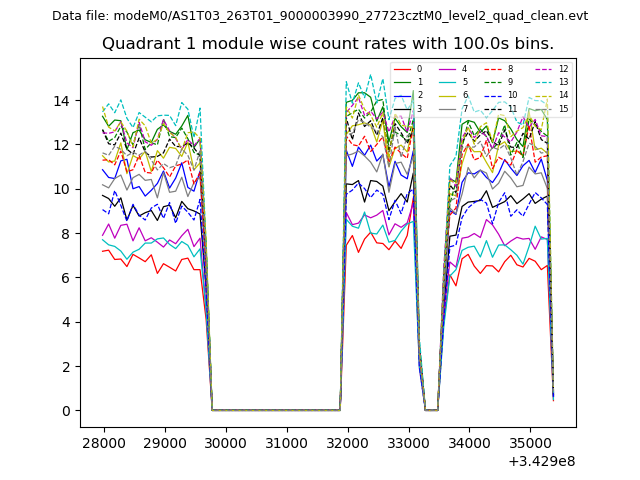
| Module-wise count rates for Quadrant A Data is divided into 100 sec bins |
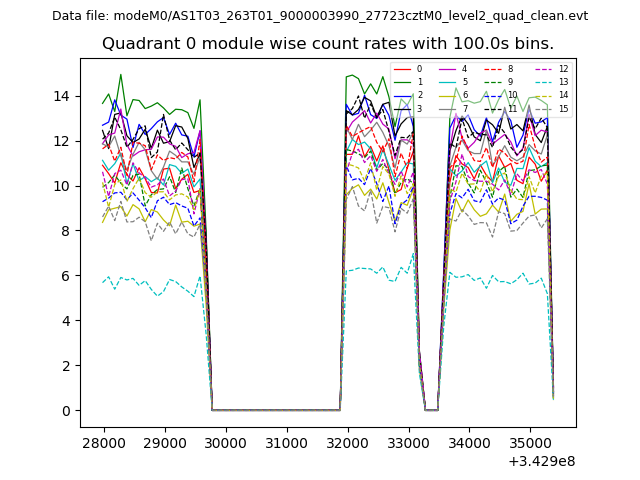 |
 |
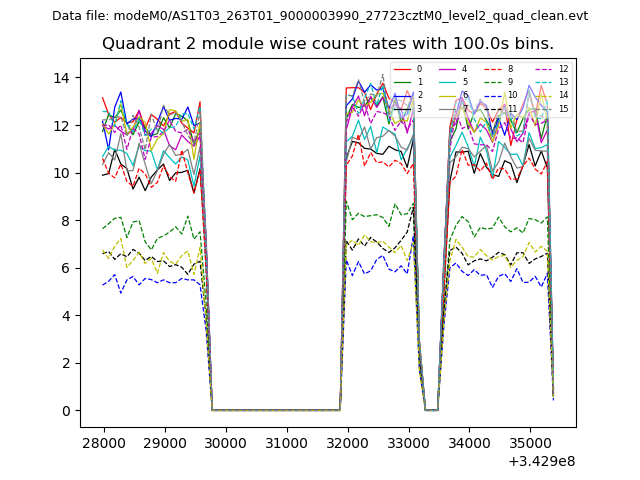
| Module-wise count rates for Quadrant B Data is divided into 100 sec bins |
 |
 |
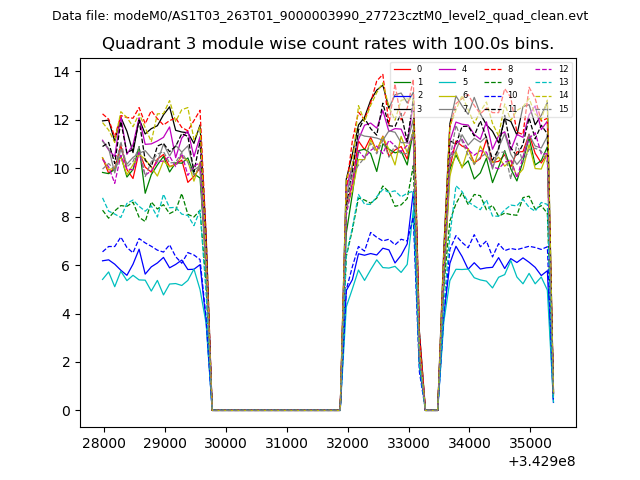
| Module-wise count rates for Quadrant C Data is divided into 100 sec bins |
 |
 |
| Module-wise count rates for Quadrant D Data is divided into 100 sec bins |
 |
 |
| Parameter | Plot |
|---|---|
| CZT HV Monitor | 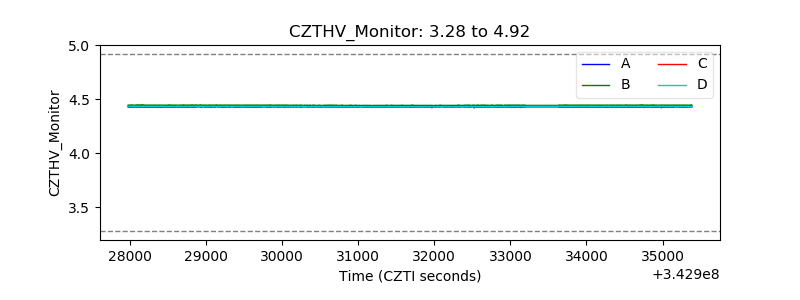 |
| D_VDD | 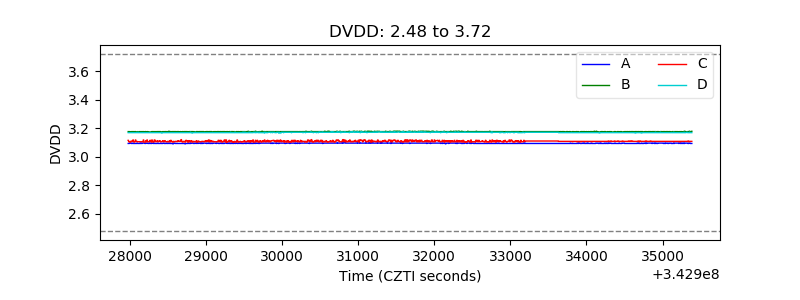 |
| Temperature 1 | 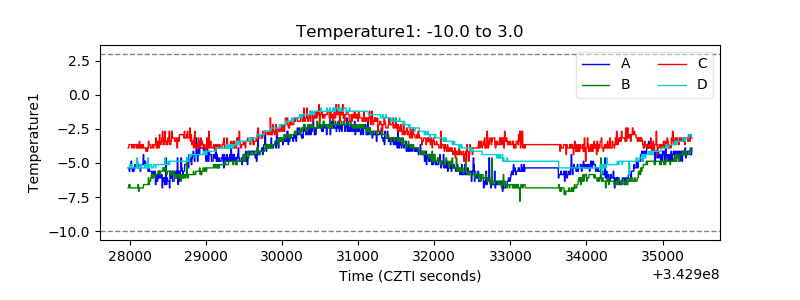 |
| Veto HV Monitor | 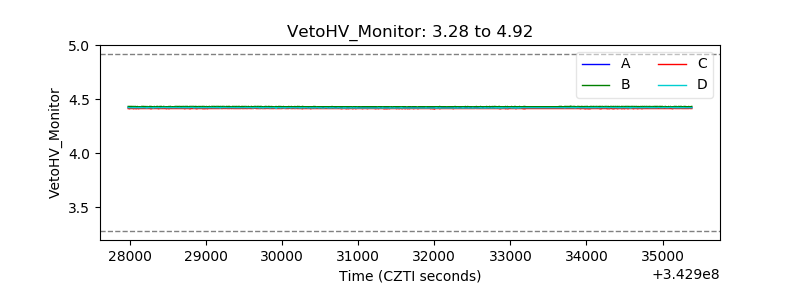 |
| Veto LLD | 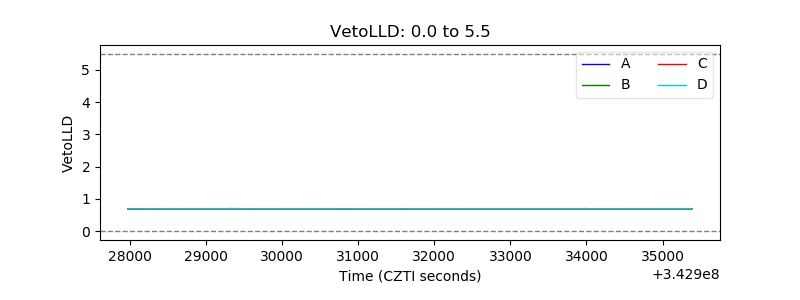 |
| Alpha Counter | 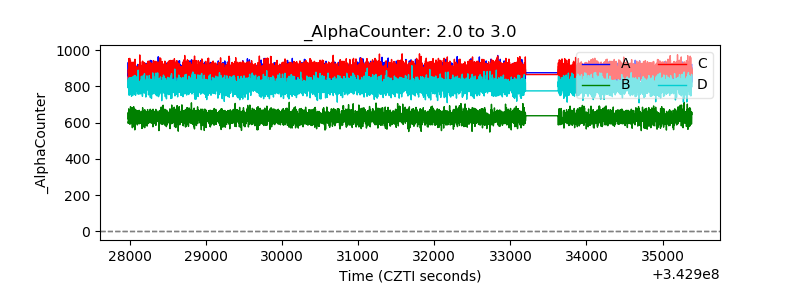 |
| _CPM_Rate | 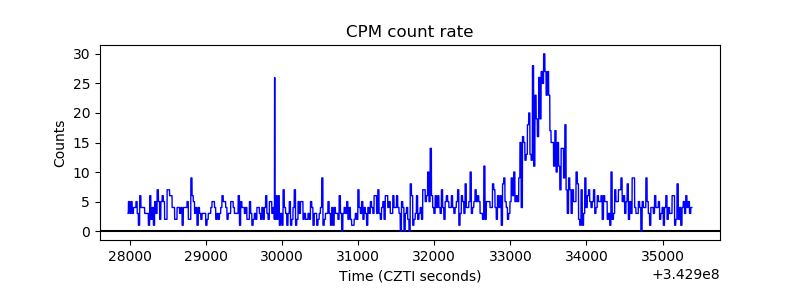 |
| CZT Counter | 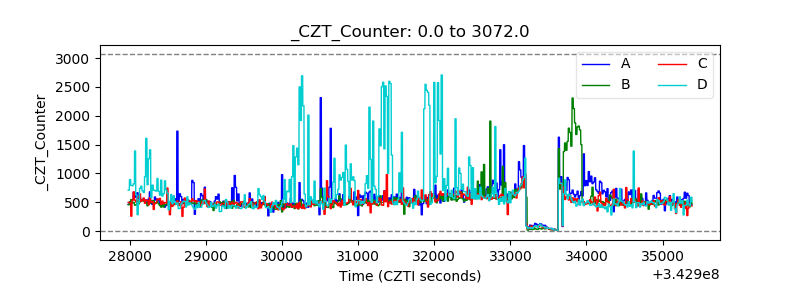 |
| +2.5 Volts monitor | 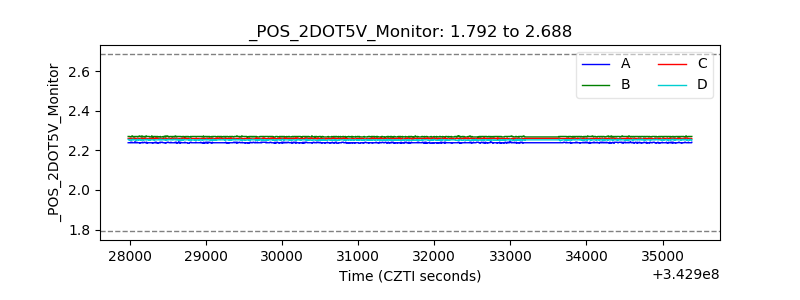 |
| +5 Volts monitor |  |
| _ROLL_ROT | 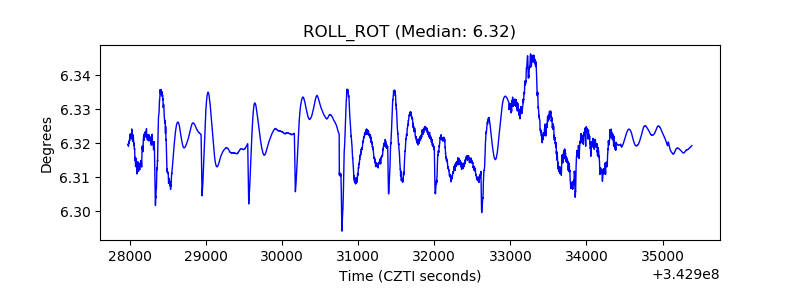 |
| _Roll_DEC | 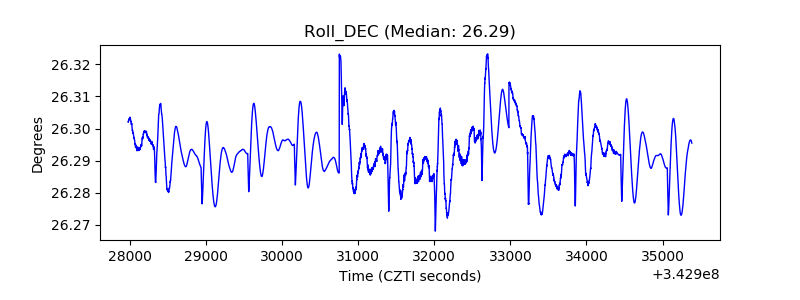 |
| _Roll_RA | 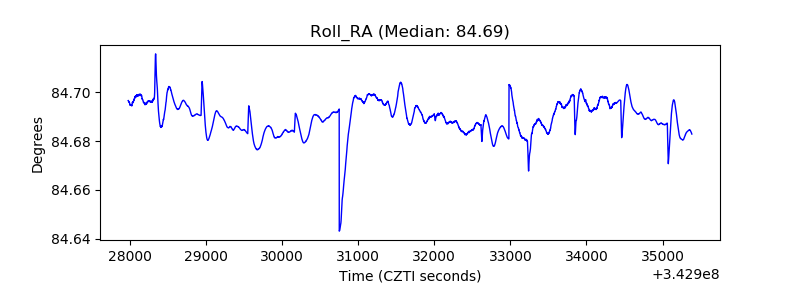 |
| Veto Counter | 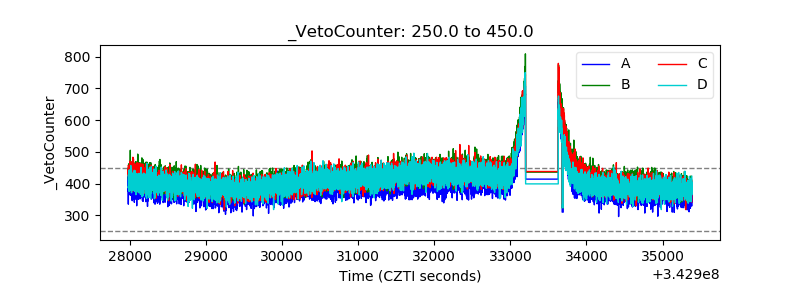 |