| Param | Original file | Final file |
|---|---|---|
| Filename | modeM0/AS1T03_263T01_9000003990_27725cztM0_level2.evt | modeM0/AS1T03_263T01_9000003990_27725cztM0_level2_quad_clean.evt |
| Size (bytes) | 532,926,720 | 107,591,040 |
| Size | 508.2 MB | 102.6 MB |
| Events in quadrant A | 4,017,480 | 706,146 |
| Events in quadrant B | 3,665,295 | 720,437 |
| Events in quadrant C | 3,956,489 | 688,533 |
| Events in quadrant D | 4,029,092 | 659,012 |
| Mode M0 | |||
|---|---|---|---|
| Quadrant | BADHDUFLAG | Total packets | Discarded packets |
| A | 0 | 16588 | 0 |
| B | 0 | 15059 | 0 |
| C | 0 | 15890 | 0 |
| D | 0 | 16230 | 0 |
| Mode M9 | |||
|---|---|---|---|
| Quadrant | BADHDUFLAG | Total packets | Discarded packets |
| A | 0 | 3 | 0 |
| B | 0 | 3 | 0 |
| C | 0 | 3 | 0 |
| D | 0 | 3 | 0 |
| Quadrant | Total seconds | Saturated seconds | Saturation percentage |
|---|---|---|---|
| A | 6951 | 148 | 2.129190% |
| B | 6951 | 144 | 2.071644% |
| C | 6951 | 177 | 2.546396% |
| D | 6951 | 236 | 3.395195% |
Noise dominated data is calculated using 1-second bins in cleaned event files. If a bin has >2000 counts, and if more than 50% of those come from <1% of pixels, then it is considered to be noise-dominated and hence unusable.
| Quadrant | # 1 sec bins | Bins with >0 counts | Bins with >2000 counts | High rate bins dominated by noise | Noise dominated (total time) | Noise dominated (detector-on time) | Marked lightcurve |
|---|---|---|---|---|---|---|---|
| A | 7222 | 6951 | 2 | 2 | 0.03% | 0.03% | 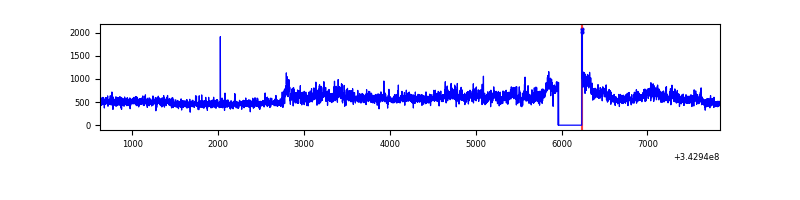 |
| B | 7222 | 6951 | 5 | 5 | 0.07% | 0.07% | 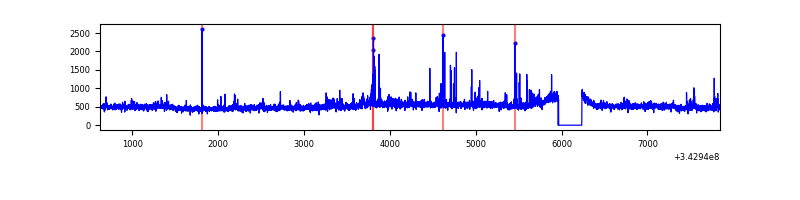 |
| C | 7222 | 6951 | 2 | 2 | 0.03% | 0.03% |  |
| D | 7222 | 6951 | 87 | 87 | 1.20% | 1.25% | 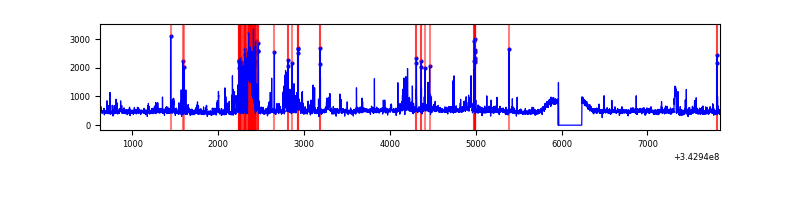 |
Top three noisy pixels from each quadrant. If the there are fewer than three noisy pixels in the level2.evt file, extra rows are filled as -1
| Pixel properties | Quadrant properties | ||||||
|---|---|---|---|---|---|---|---|
| Quadrant | DetID | PixID | Counts | Sigma | Mean | Median | Sigma |
| A | 6 | 16 | 557245 | 2904.77 | 895 | 878 | 191.5 |
| A | 13 | 254 | 10819 | 51.9 | 895 | 878 | 191.5 |
| A | 3 | 137 | 8589 | 40.26 | 895 | 878 | 191.5 |
| B | 3 | 64 | 126281 | 693.47 | 889 | 869 | 180.8 |
| B | 12 | 111 | 20389 | 107.94 | 889 | 869 | 180.8 |
| B | 11 | 111 | 18503 | 97.51 | 889 | 869 | 180.8 |
| C | 3 | 233 | 468021 | 2213.05 | 858 | 868 | 211.1 |
| C | 14 | 238 | 139367 | 656.11 | 858 | 868 | 211.1 |
| C | 10 | 22 | 6873 | 28.45 | 858 | 868 | 211.1 |
| D | 1 | 52 | 579936 | 2684.36 | 859 | 836 | 215.7 |
| D | 11 | 176 | 61319 | 280.36 | 859 | 836 | 215.7 |
| D | 2 | 250 | 50711 | 231.19 | 859 | 836 | 215.7 |
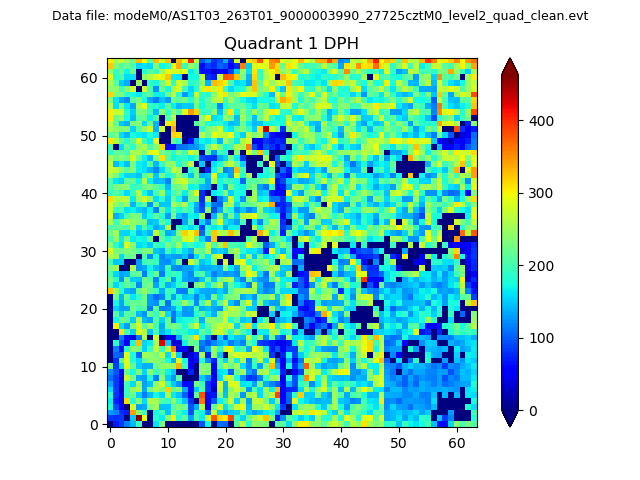
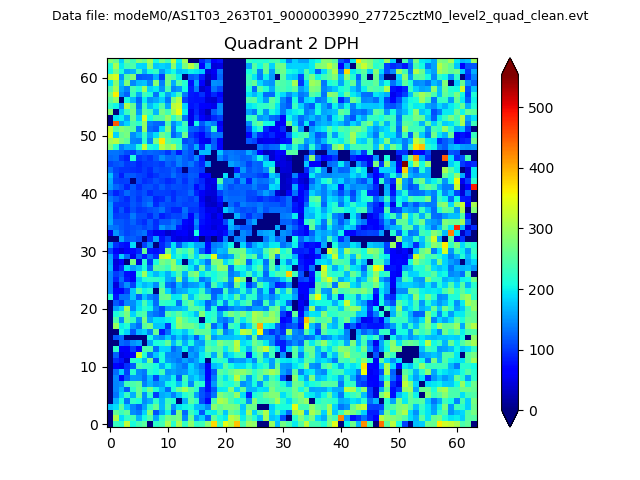
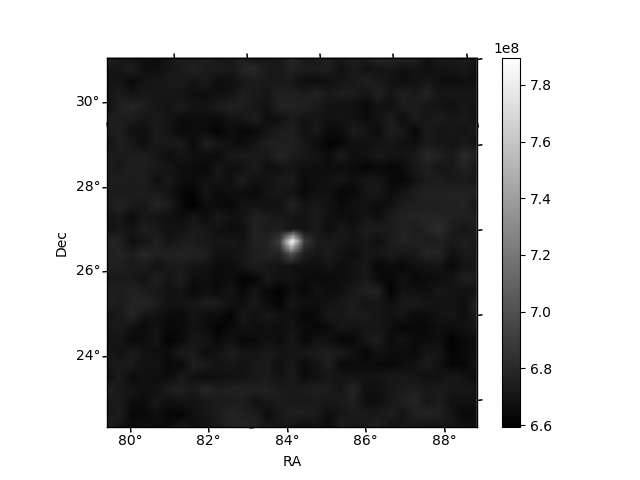
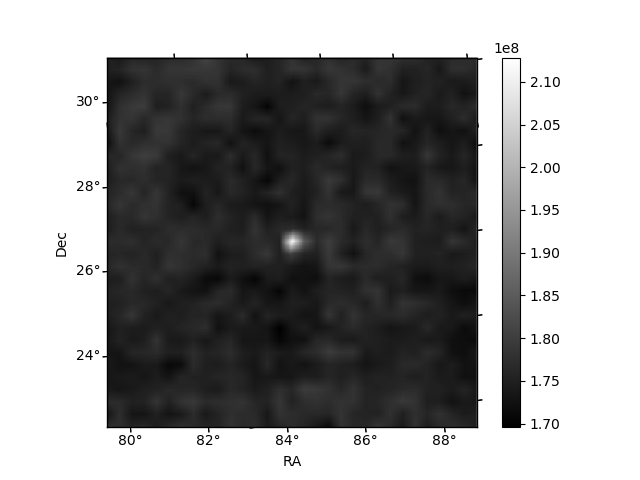
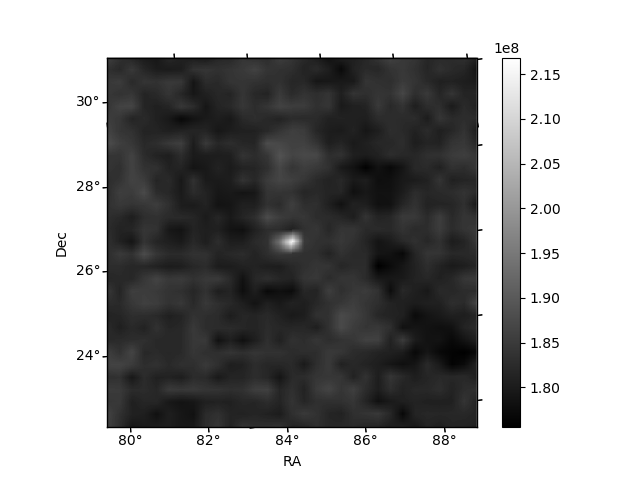
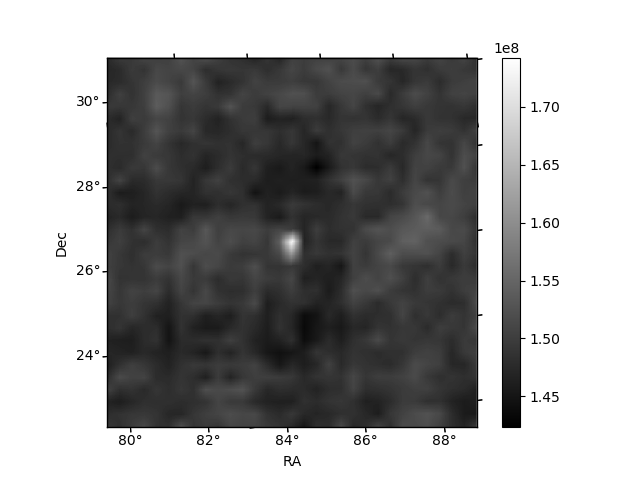
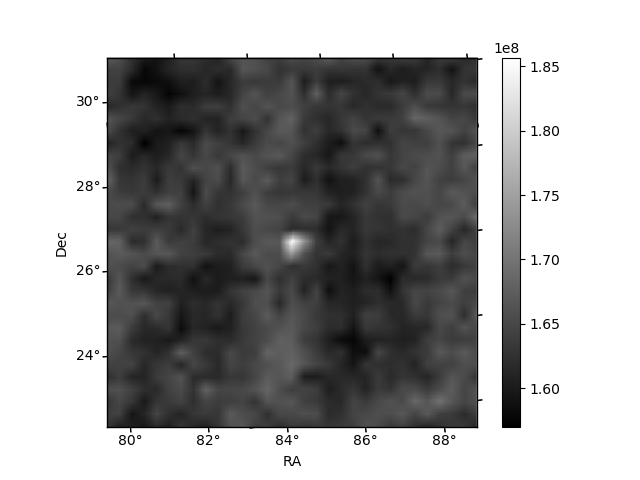
Histogram calculated using DETX and DETY for each event in the final _common_clean file
| Quadrant A | 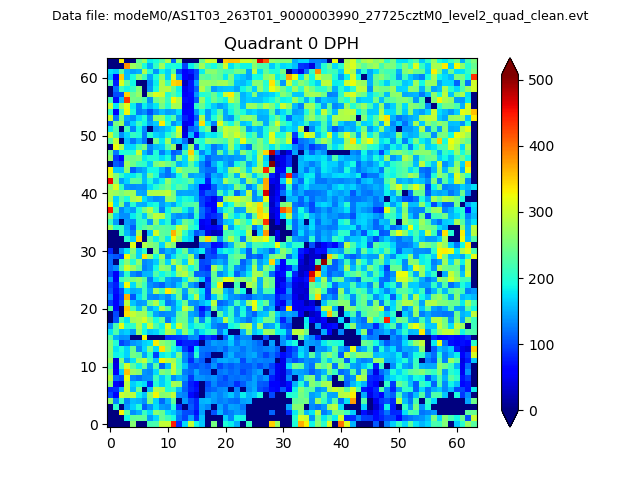 |
 |
Quadrant B |
|---|---|---|---|
| Quadrant D | 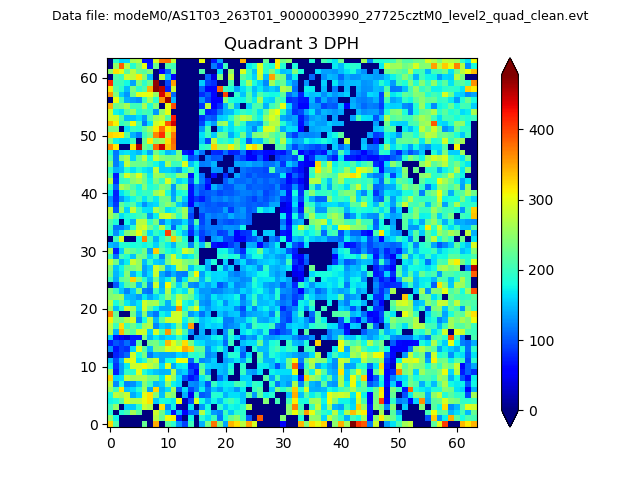 |
 |
Quadrant C |
| Plot type | Count rate plots | Images |
|---|---|---|
| Comparison with Poisson distribution Blue bars denote a histogram of data divided into 1 sec bins. Red curve is a Poisson curve with rate = median count rate of data. |
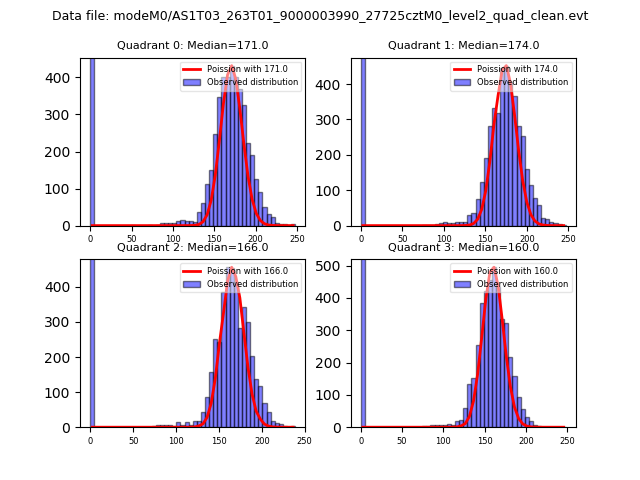 |
 |
| Quadrant-wise count rates Data is divided into 100 sec bins |
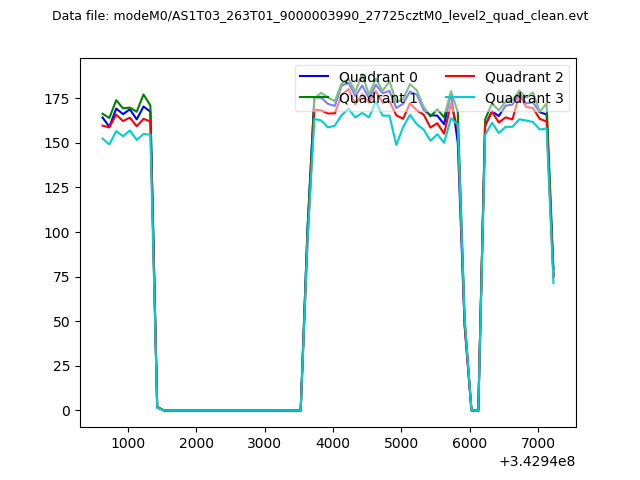 |
|
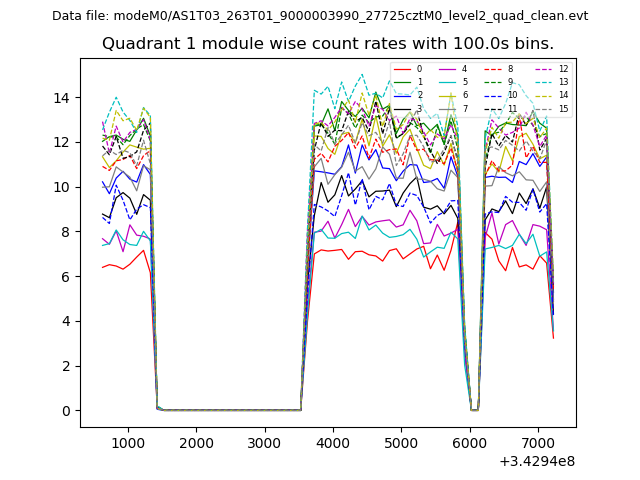
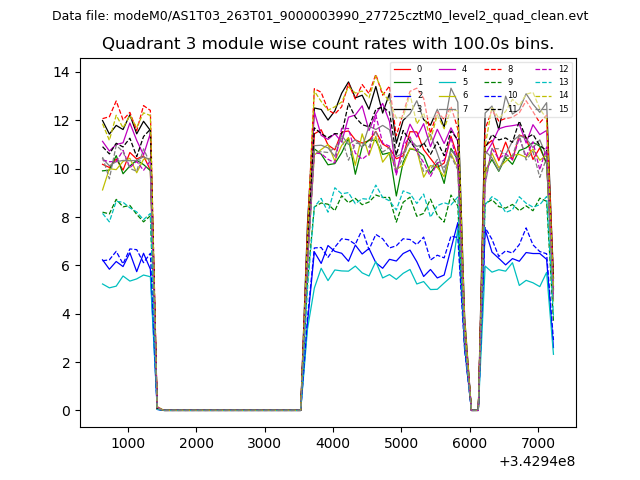
| Module-wise count rates for Quadrant A Data is divided into 100 sec bins |
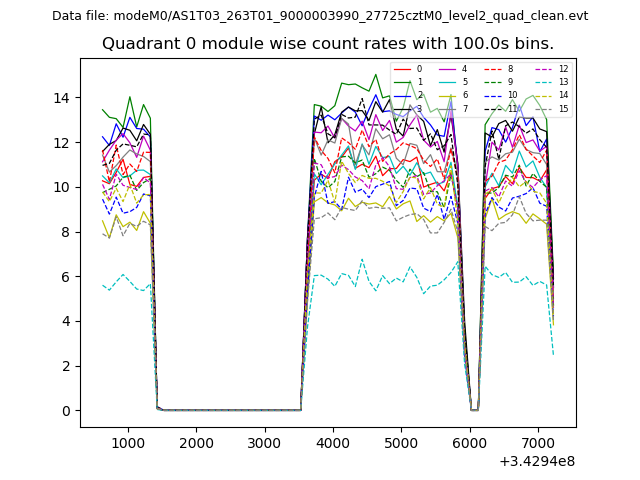 |
 |
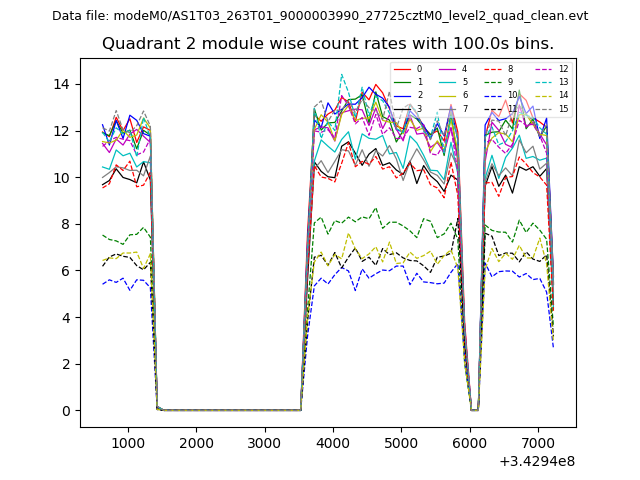
| Module-wise count rates for Quadrant B Data is divided into 100 sec bins |
 |
 |
| Module-wise count rates for Quadrant C Data is divided into 100 sec bins |
 |
 |
| Module-wise count rates for Quadrant D Data is divided into 100 sec bins |
 |
 |
| Parameter | Plot |
|---|---|
| CZT HV Monitor | 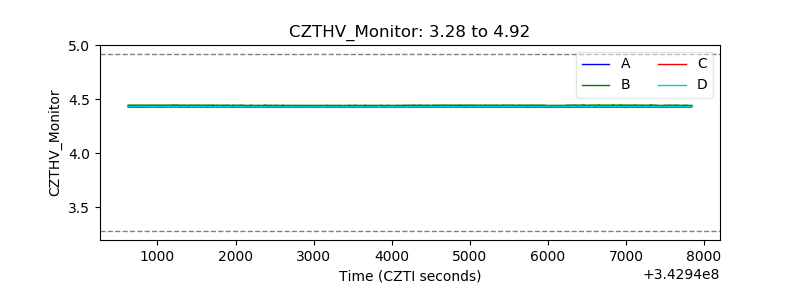 |
| D_VDD | 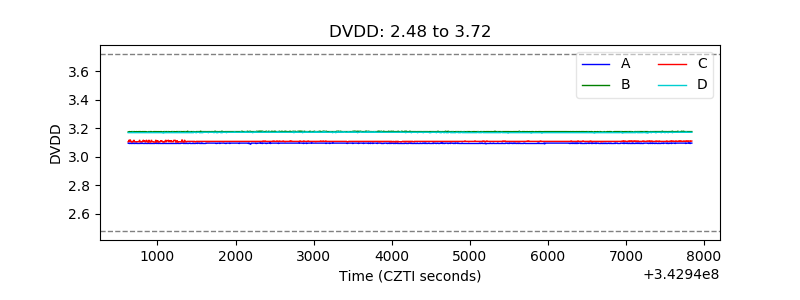 |
| Temperature 1 | 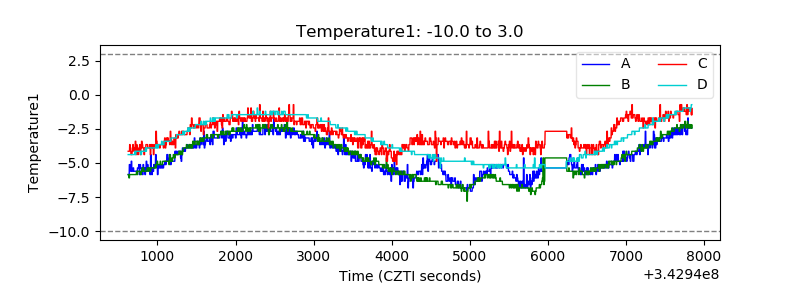 |
| Veto HV Monitor | 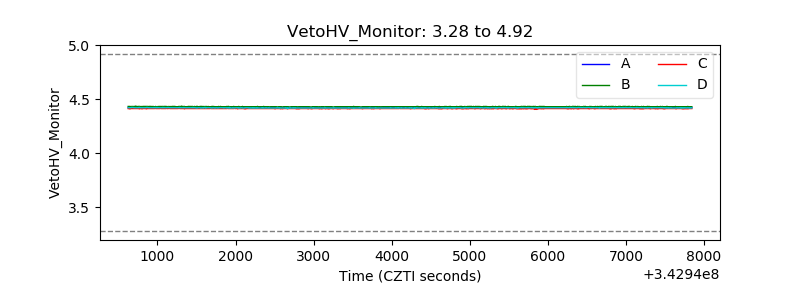 |
| Veto LLD | 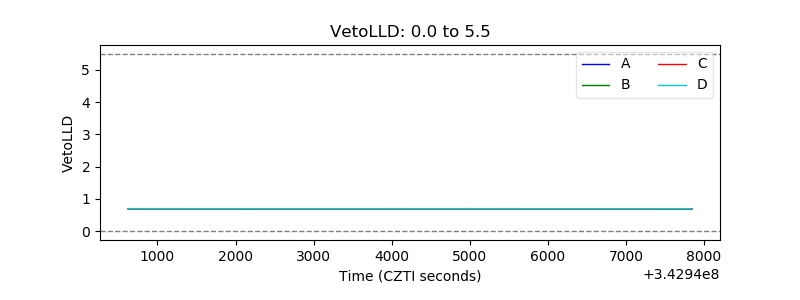 |
| Alpha Counter | 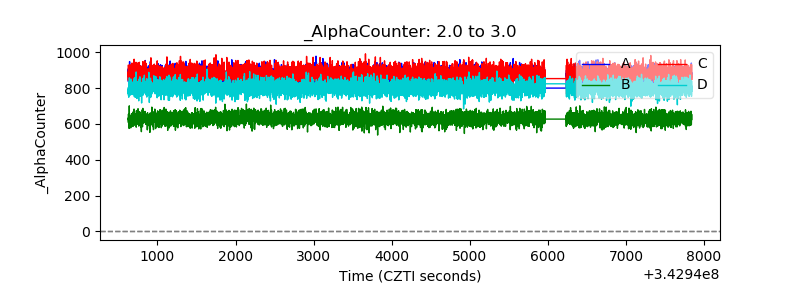 |
| _CPM_Rate | 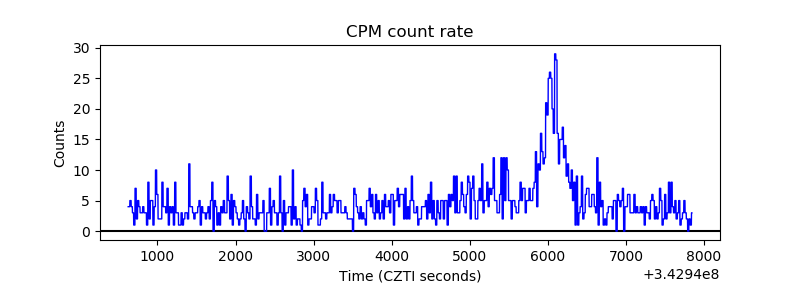 |
| CZT Counter | 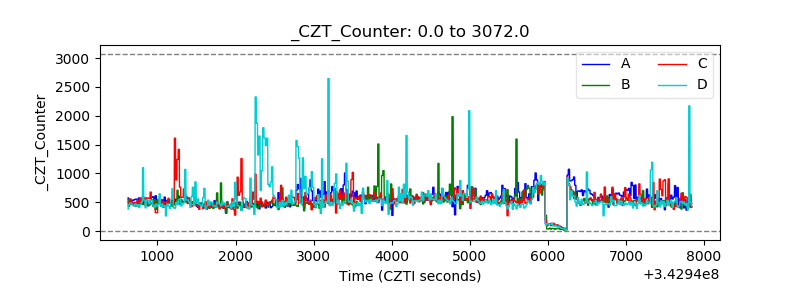 |
| +2.5 Volts monitor | 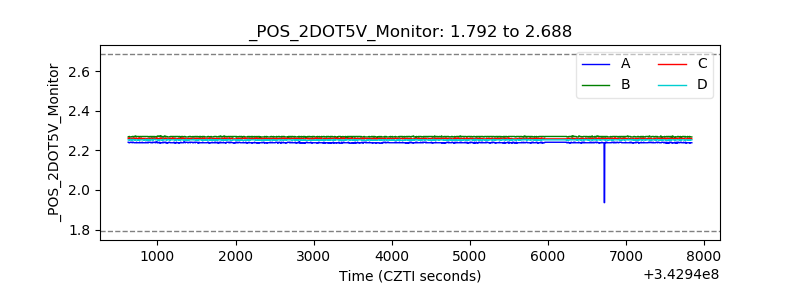 |
| +5 Volts monitor |  |
| _ROLL_ROT | 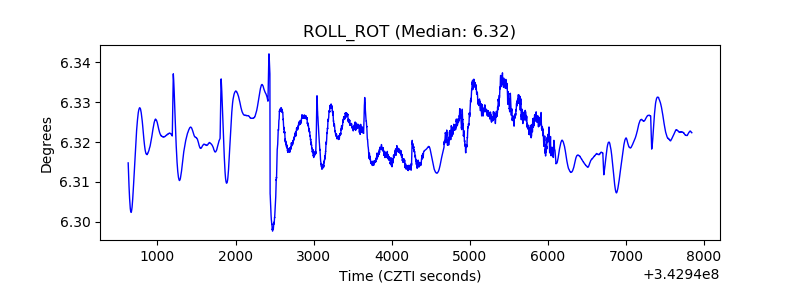 |
| _Roll_DEC |  |
| _Roll_RA | 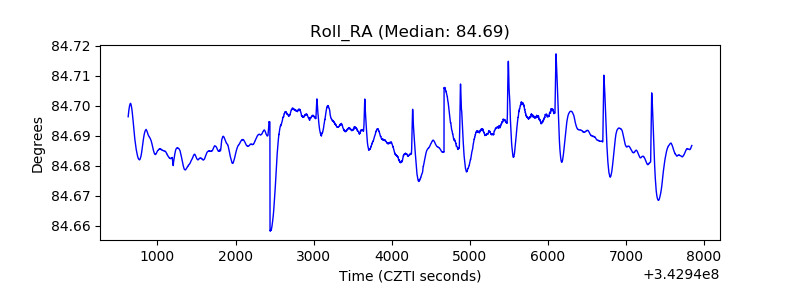 |
| Veto Counter | 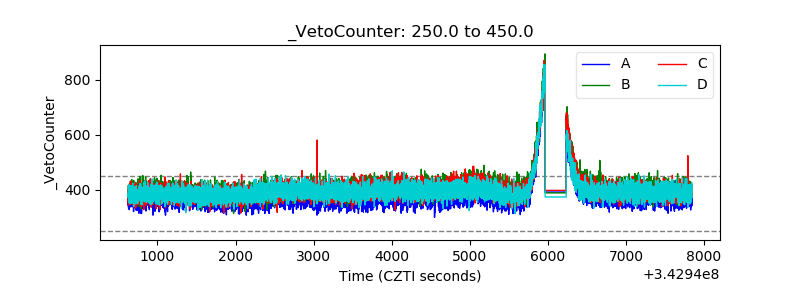 |