| Param | Original file | Final file |
|---|---|---|
| Filename | modeM0/AS1T03_263T01_9000003990_27727cztM0_level2.evt | modeM0/AS1T03_263T01_9000003990_27727cztM0_level2_quad_clean.evt |
| Size (bytes) | 1,040,952,960 | 183,651,840 |
| Size | 992.7 MB | 175.1 MB |
| Events in quadrant A | 7,922,966 | 1,204,337 |
| Events in quadrant B | 7,642,940 | 1,202,224 |
| Events in quadrant C | 7,346,009 | 1,161,987 |
| Events in quadrant D | 7,744,791 | 1,104,562 |
| Mode M0 | |||
|---|---|---|---|
| Quadrant | BADHDUFLAG | Total packets | Discarded packets |
| A | 0 | 32045 | 0 |
| B | 0 | 30174 | 0 |
| C | 0 | 29654 | 0 |
| D | 0 | 31260 | 0 |
| Mode M9 | |||
|---|---|---|---|
| Quadrant | BADHDUFLAG | Total packets | Discarded packets |
| A | 0 | 10 | 0 |
| B | 0 | 10 | 0 |
| C | 0 | 10 | 0 |
| D | 0 | 10 | 0 |
| Quadrant | Total seconds | Saturated seconds | Saturation percentage |
|---|---|---|---|
| A | 12855 | 172 | 1.338001% |
| B | 12856 | 435 | 3.383634% |
| C | 12856 | 246 | 1.913503% |
| D | 12856 | 270 | 2.100187% |
Noise dominated data is calculated using 1-second bins in cleaned event files. If a bin has >2000 counts, and if more than 50% of those come from <1% of pixels, then it is considered to be noise-dominated and hence unusable.
| Quadrant | # 1 sec bins | Bins with >0 counts | Bins with >2000 counts | High rate bins dominated by noise | Noise dominated (total time) | Noise dominated (detector-on time) | Marked lightcurve |
|---|---|---|---|---|---|---|---|
| A | 13970 | 12855 | 1 | 1 | 0.01% | 0.01% | 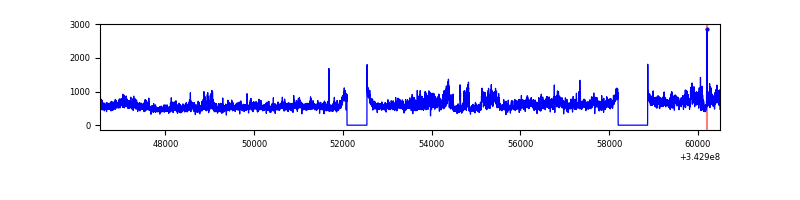 |
| B | 13971 | 12856 | 179 | 179 | 1.28% | 1.39% | 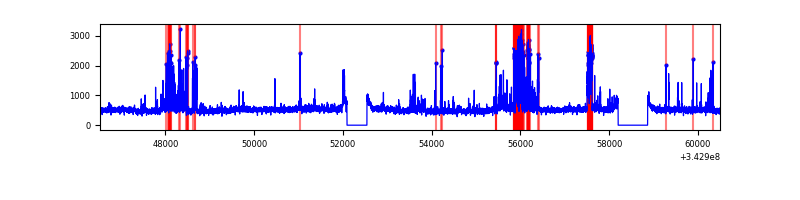 |
| C | 13971 | 12856 | 10 | 10 | 0.07% | 0.08% | 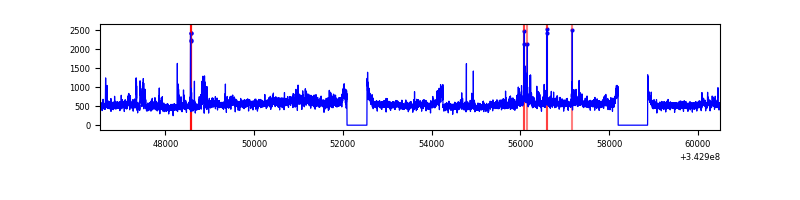 |
| D | 13971 | 12856 | 145 | 145 | 1.04% | 1.13% | 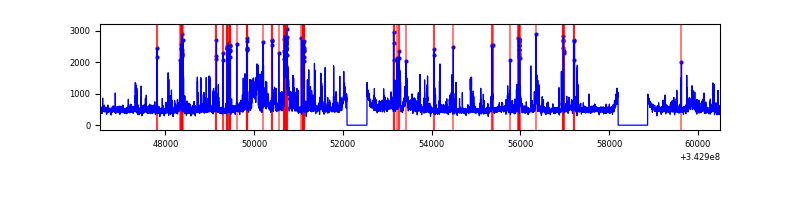 |
Top three noisy pixels from each quadrant. If the there are fewer than three noisy pixels in the level2.evt file, extra rows are filled as -1
| Pixel properties | Quadrant properties | ||||||
|---|---|---|---|---|---|---|---|
| Quadrant | DetID | PixID | Counts | Sigma | Mean | Median | Sigma |
| A | 6 | 16 | 1484679 | 4203.07 | 1663 | 1635 | 352.8 |
| A | 13 | 254 | 20289 | 52.87 | 1663 | 1635 | 352.8 |
| A | 0 | 13 | 19145 | 49.62 | 1663 | 1635 | 352.8 |
| B | 3 | 64 | 1033407 | 3121.18 | 1645 | 1607 | 330.6 |
| B | 15 | 32 | 40014 | 116.18 | 1645 | 1607 | 330.6 |
| B | 12 | 111 | 37406 | 108.29 | 1645 | 1607 | 330.6 |
| C | 3 | 233 | 852525 | 2174.59 | 1594 | 1605 | 391.3 |
| C | 14 | 238 | 257234 | 653.28 | 1594 | 1605 | 391.3 |
| C | 15 | 208 | 36200 | 88.41 | 1594 | 1605 | 391.3 |
| D | 1 | 52 | 1011300 | 2534.07 | 1599 | 1557 | 398.5 |
| D | 11 | 176 | 424062 | 1060.33 | 1599 | 1557 | 398.5 |
| D | 2 | 250 | 202753 | 504.93 | 1599 | 1557 | 398.5 |
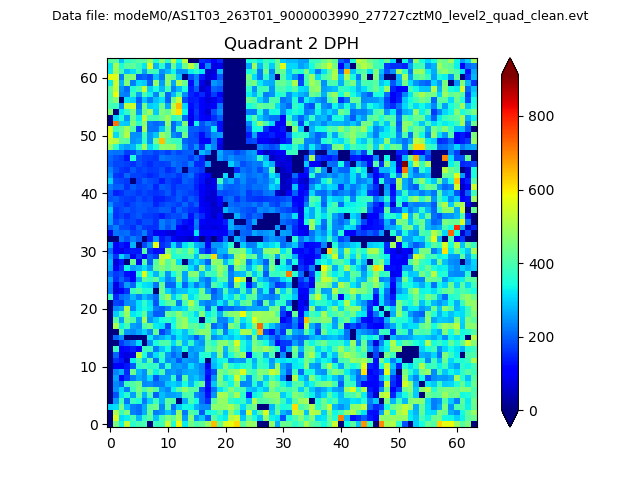
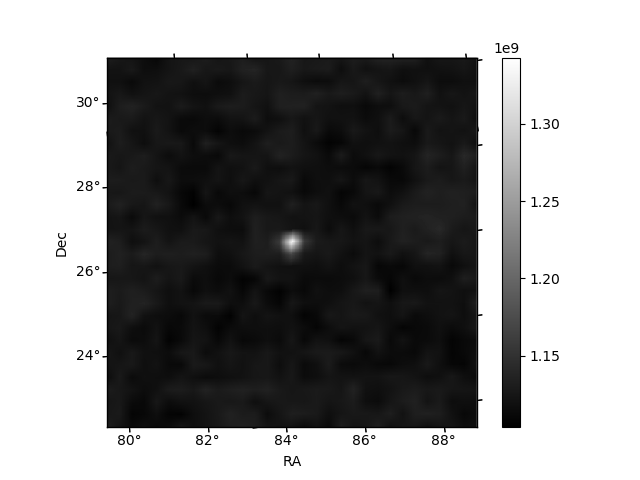
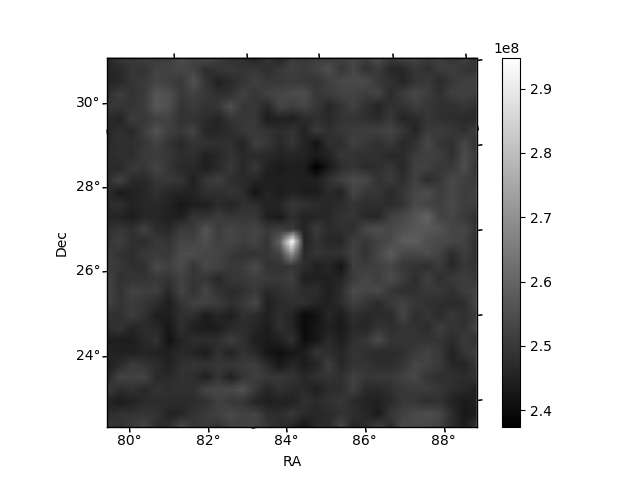
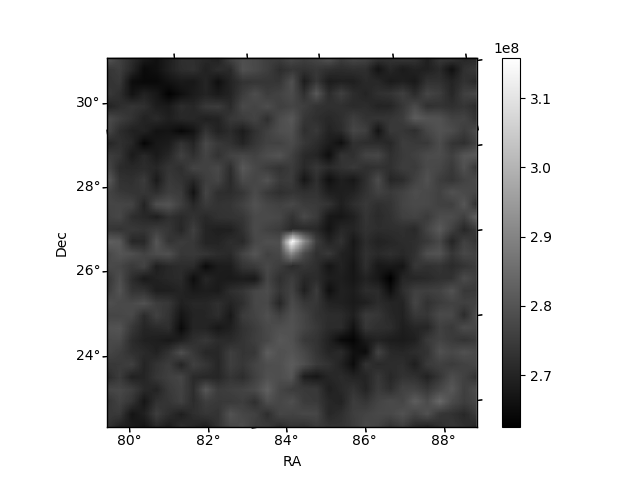
Histogram calculated using DETX and DETY for each event in the final _common_clean file
| Quadrant A | 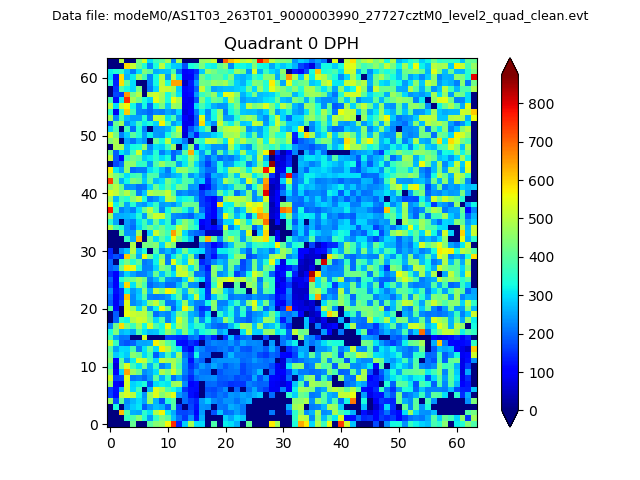 |
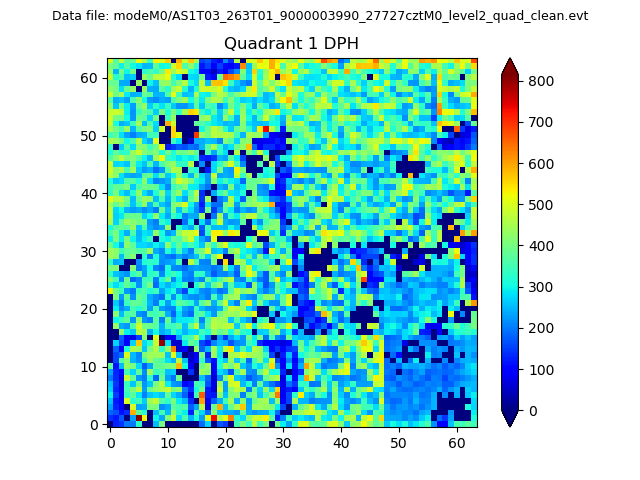 |
Quadrant B |
|---|---|---|---|
| Quadrant D | 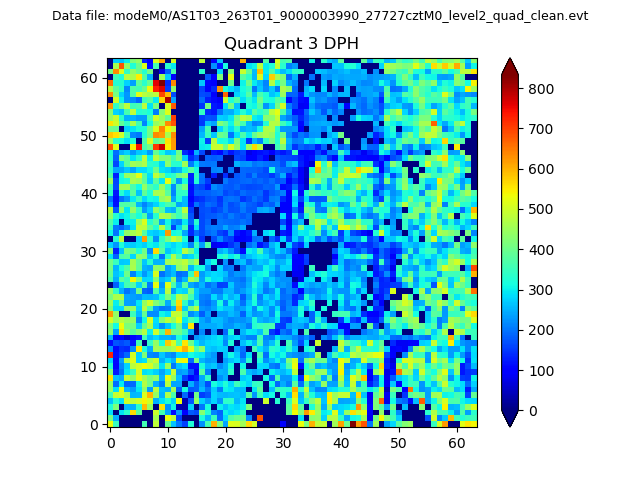 |
 |
Quadrant C |
| Plot type | Count rate plots | Images |
|---|---|---|
| Comparison with Poisson distribution Blue bars denote a histogram of data divided into 1 sec bins. Red curve is a Poisson curve with rate = median count rate of data. |
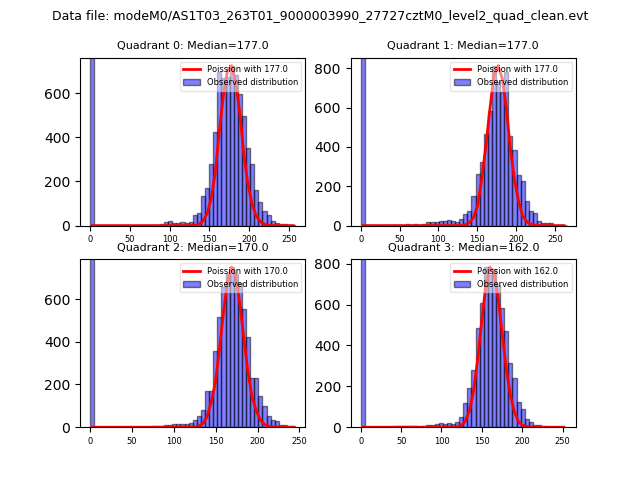 |
 |
| Quadrant-wise count rates Data is divided into 100 sec bins |
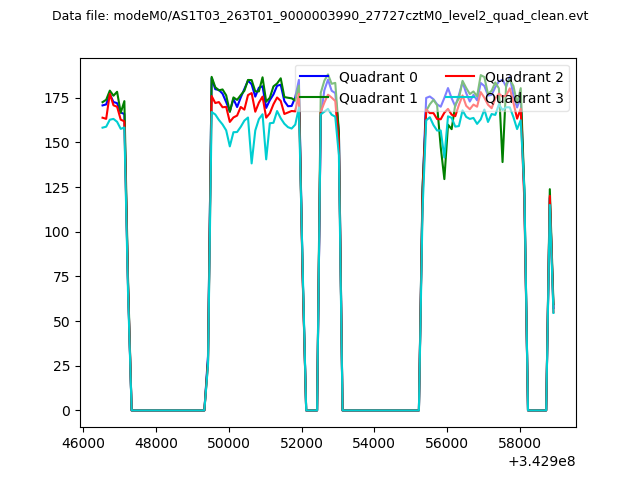 |
|
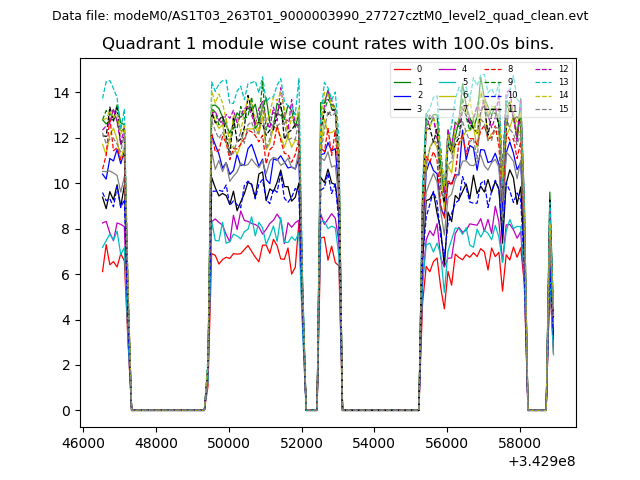
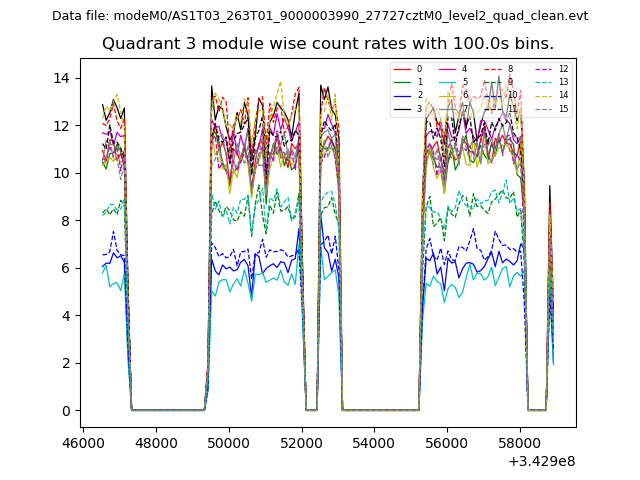
| Module-wise count rates for Quadrant A Data is divided into 100 sec bins |
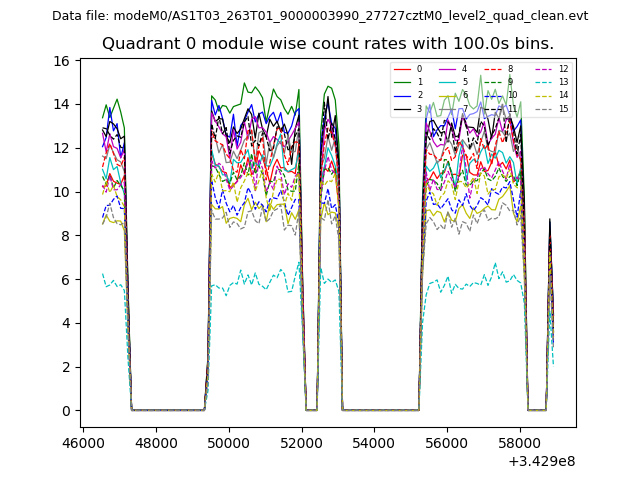 |
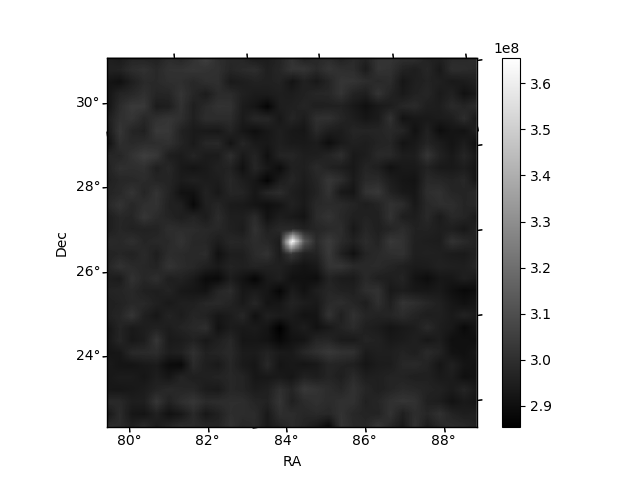 |
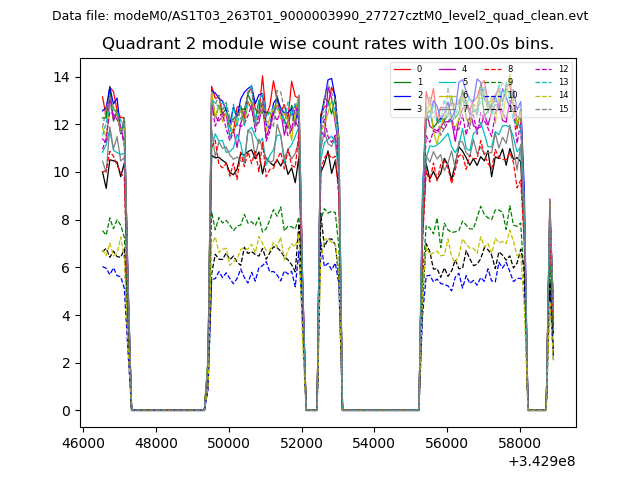
| Module-wise count rates for Quadrant B Data is divided into 100 sec bins |
 |
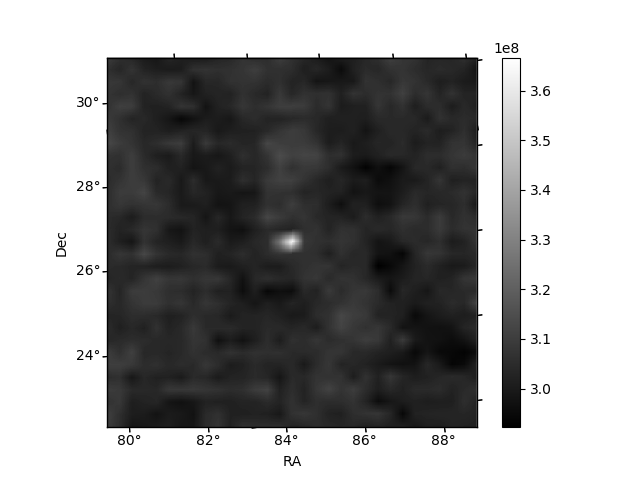 |
| Module-wise count rates for Quadrant C Data is divided into 100 sec bins |
 |
 |
| Module-wise count rates for Quadrant D Data is divided into 100 sec bins |
 |
 |
| Parameter | Plot |
|---|---|
| CZT HV Monitor | 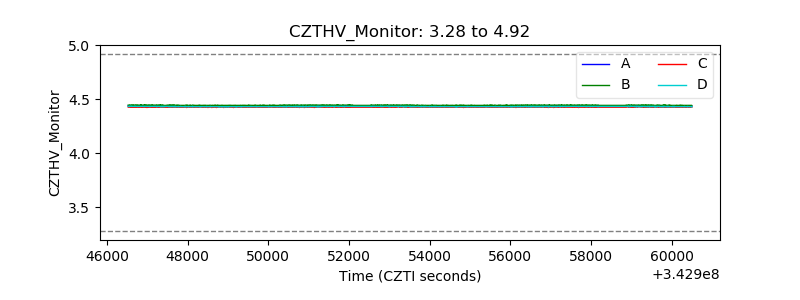 |
| D_VDD |  |
| Temperature 1 |  |
| Veto HV Monitor | 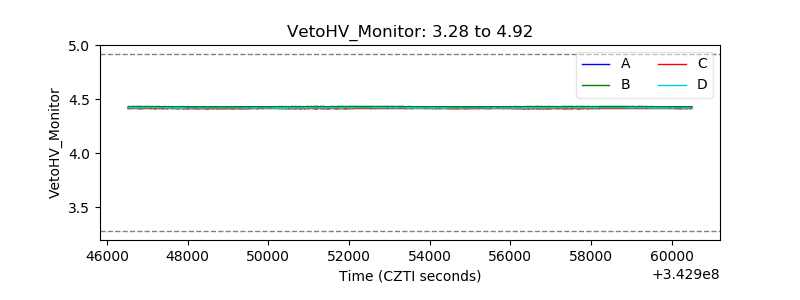 |
| Veto LLD | 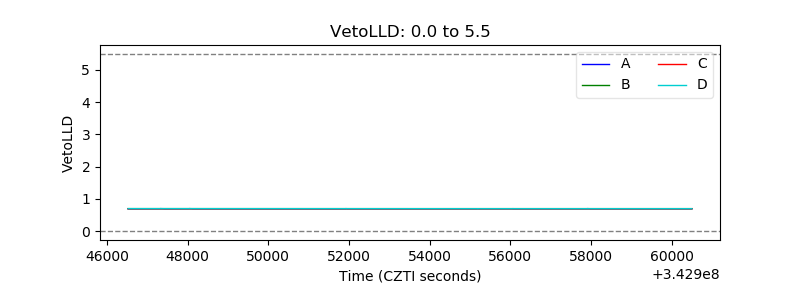 |
| Alpha Counter | 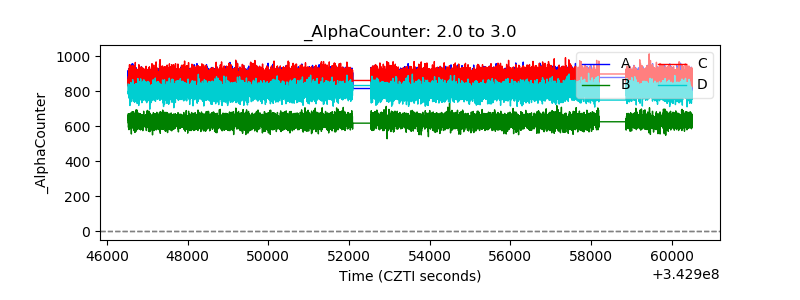 |
| _CPM_Rate | 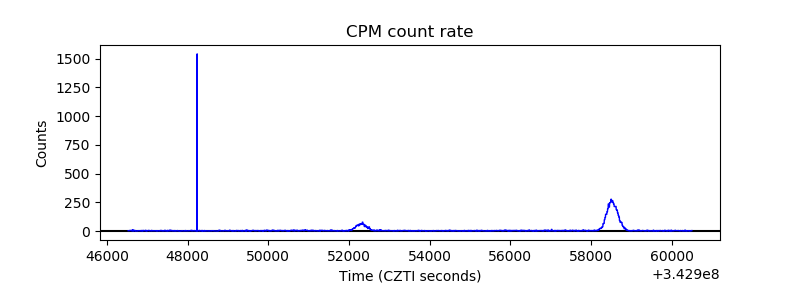 |
| CZT Counter | 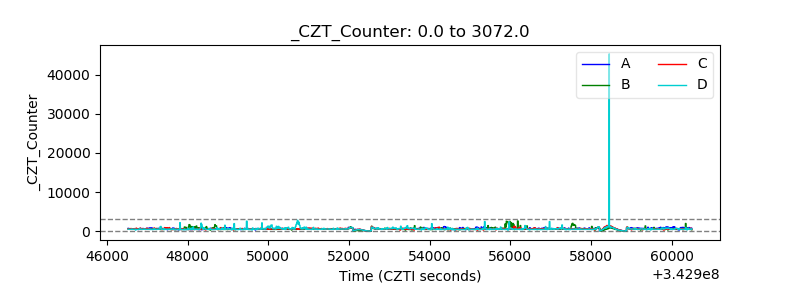 |
| +2.5 Volts monitor | 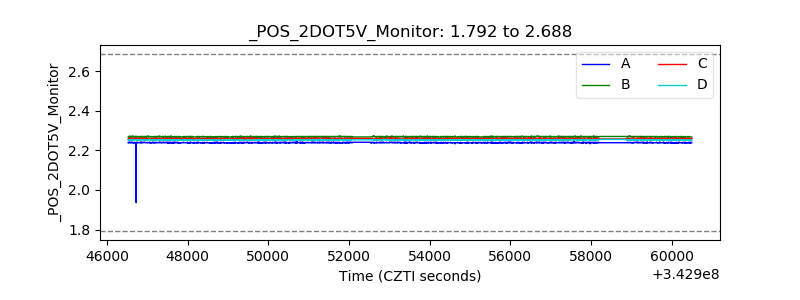 |
| +5 Volts monitor | 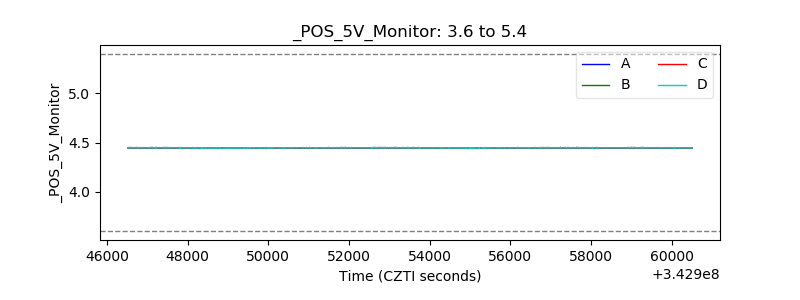 |
| _ROLL_ROT | 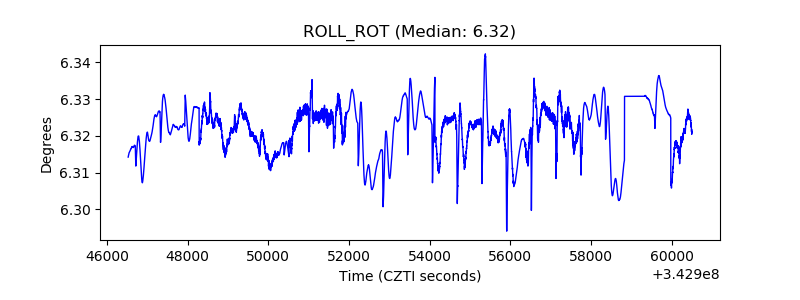 |
| _Roll_DEC | 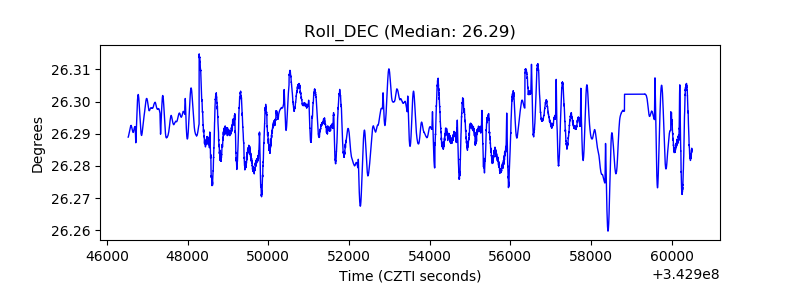 |
| _Roll_RA |  |
| Veto Counter | 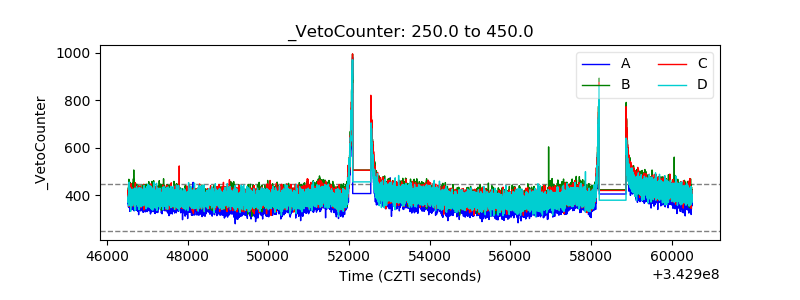 |