| Param | Original file | Final file |
|---|---|---|
| Filename | modeM0/AS1T03_263T01_9000003990_27728cztM0_level2.evt | modeM0/AS1T03_263T01_9000003990_27728cztM0_level2_quad_clean.evt |
| Size (bytes) | 646,669,440 | 91,235,520 |
| Size | 616.7 MB | 87.0 MB |
| Events in quadrant A | 4,882,960 | 589,722 |
| Events in quadrant B | 4,196,692 | 597,754 |
| Events in quadrant C | 5,162,672 | 549,165 |
| Events in quadrant D | 4,872,612 | 542,585 |
| Mode M0 | |||
|---|---|---|---|
| Quadrant | BADHDUFLAG | Total packets | Discarded packets |
| A | 0 | 19333 | 0 |
| B | 0 | 16495 | 0 |
| C | 0 | 19772 | 0 |
| D | 0 | 18939 | 0 |
| Mode M9 | |||
|---|---|---|---|
| Quadrant | BADHDUFLAG | Total packets | Discarded packets |
| A | 0 | 14 | 0 |
| B | 0 | 14 | 0 |
| C | 0 | 14 | 0 |
| D | 0 | 14 | 0 |
| Quadrant | Total seconds | Saturated seconds | Saturation percentage |
|---|---|---|---|
| A | 6935 | 145 | 2.090844% |
| B | 6936 | 317 | 4.570358% |
| C | 6936 | 500 | 7.208766% |
| D | 6936 | 413 | 5.954441% |
Noise dominated data is calculated using 1-second bins in cleaned event files. If a bin has >2000 counts, and if more than 50% of those come from <1% of pixels, then it is considered to be noise-dominated and hence unusable.
| Quadrant | # 1 sec bins | Bins with >0 counts | Bins with >2000 counts | High rate bins dominated by noise | Noise dominated (total time) | Noise dominated (detector-on time) | Marked lightcurve |
|---|---|---|---|---|---|---|---|
| A | 8420 | 6935 | 3 | 3 | 0.04% | 0.04% | 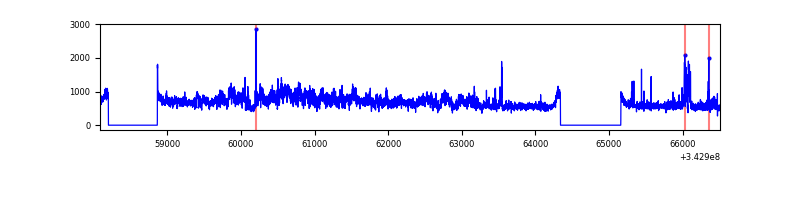 |
| B | 8421 | 6936 | 110 | 110 | 1.31% | 1.59% | 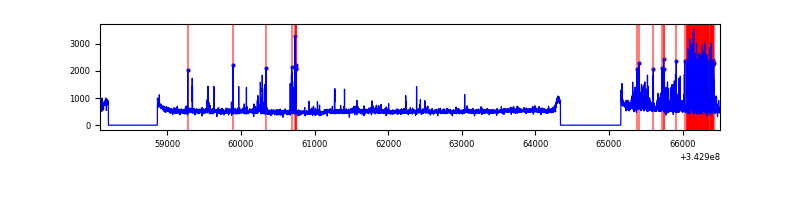 |
| C | 8421 | 6936 | 226 | 226 | 2.68% | 3.26% | 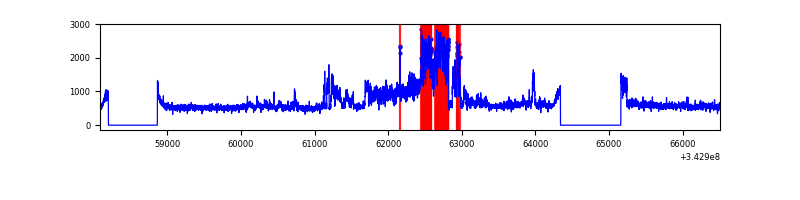 |
| D | 8421 | 6936 | 274 | 274 | 3.25% | 3.95% | 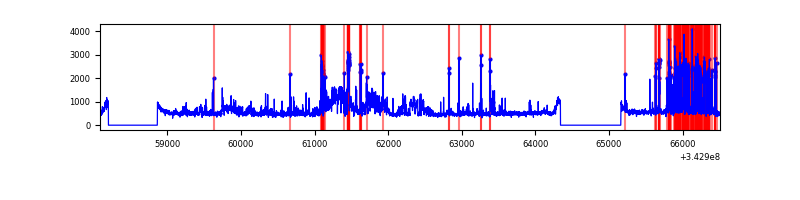 |
Top three noisy pixels from each quadrant. If the there are fewer than three noisy pixels in the level2.evt file, extra rows are filled as -1
| Pixel properties | Quadrant properties | ||||||
|---|---|---|---|---|---|---|---|
| Quadrant | DetID | PixID | Counts | Sigma | Mean | Median | Sigma |
| A | 6 | 16 | 1305472 | 6710.45 | 925 | 909 | 194.4 |
| A | 13 | 254 | 10872 | 51.25 | 925 | 909 | 194.4 |
| A | 0 | 13 | 8869 | 40.94 | 925 | 909 | 194.4 |
| B | 3 | 64 | 572029 | 3142.52 | 908 | 888 | 181.7 |
| B | 4 | 200 | 24545 | 130.17 | 908 | 888 | 181.7 |
| B | 12 | 111 | 20821 | 109.67 | 908 | 888 | 181.7 |
| C | 3 | 233 | 1619022 | 7508.93 | 874 | 882 | 215.5 |
| C | 14 | 238 | 141404 | 652.09 | 874 | 882 | 215.5 |
| C | 13 | 61 | 5802 | 22.83 | 874 | 882 | 215.5 |
| D | 1 | 52 | 1386902 | 6318.6 | 868 | 847 | 219.4 |
| D | 11 | 176 | 113593 | 513.97 | 868 | 847 | 219.4 |
| D | 2 | 250 | 80162 | 361.57 | 868 | 847 | 219.4 |
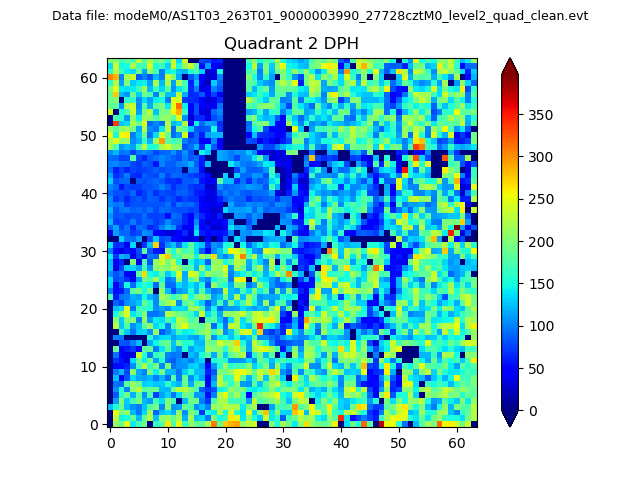
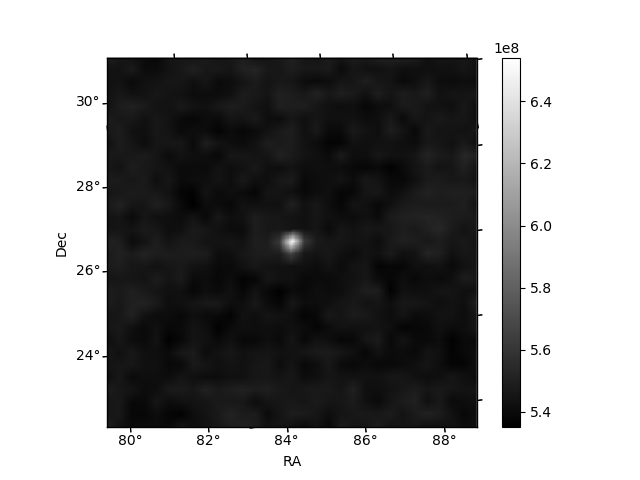
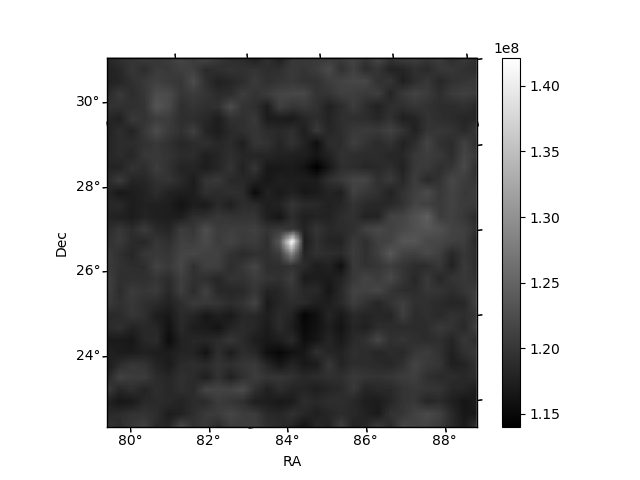
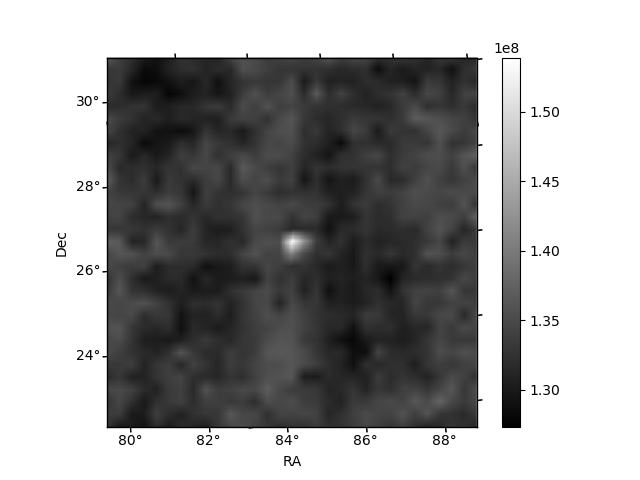
Histogram calculated using DETX and DETY for each event in the final _common_clean file
| Quadrant A | 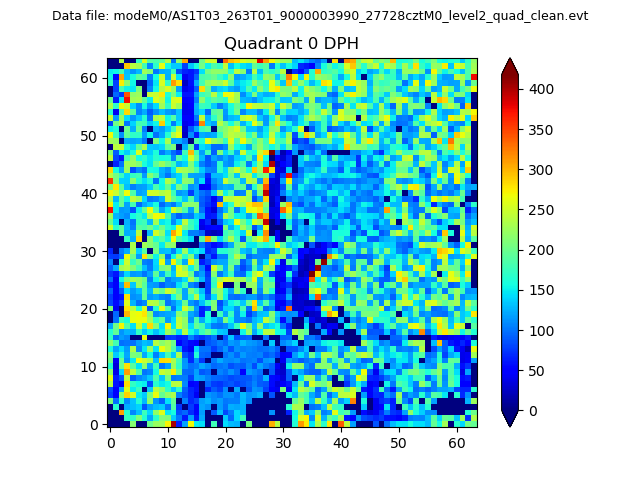 |
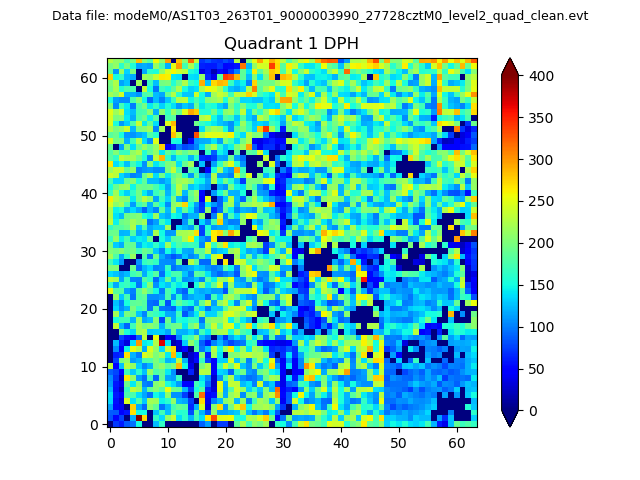 |
Quadrant B |
|---|---|---|---|
| Quadrant D | 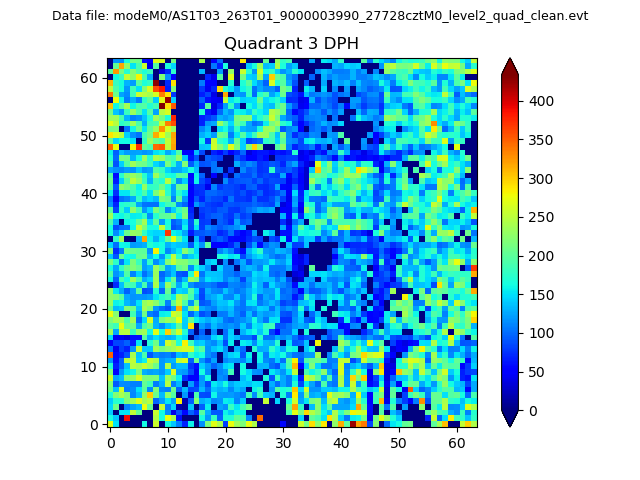 |
 |
Quadrant C |
| Plot type | Count rate plots | Images |
|---|---|---|
| Comparison with Poisson distribution Blue bars denote a histogram of data divided into 1 sec bins. Red curve is a Poisson curve with rate = median count rate of data. |
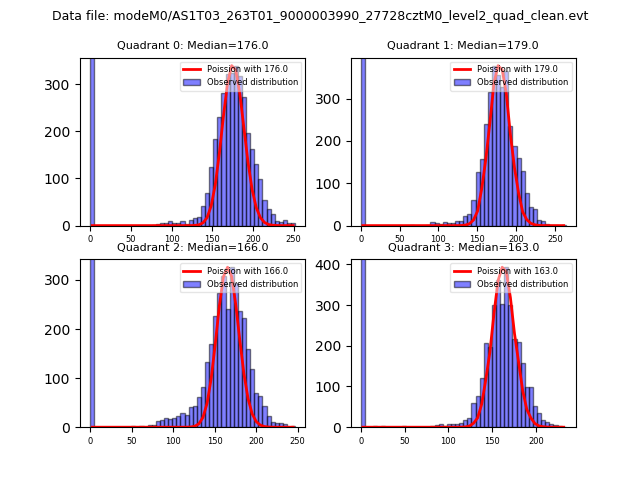 |
 |
| Quadrant-wise count rates Data is divided into 100 sec bins |
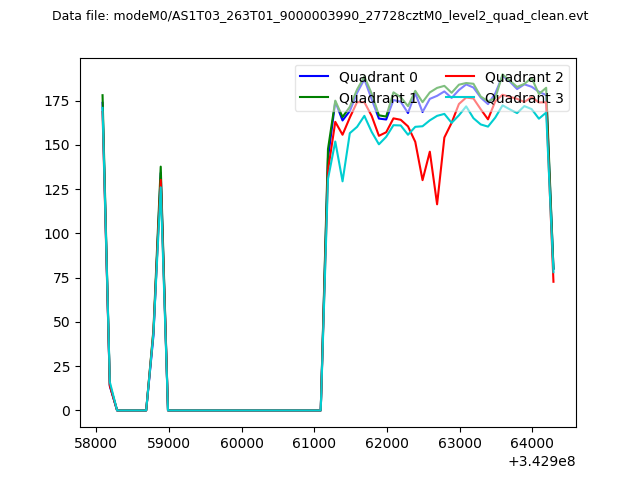 |
|
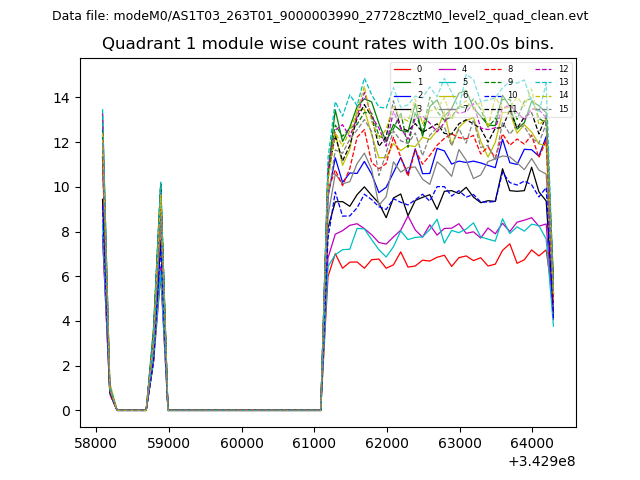
| Module-wise count rates for Quadrant A Data is divided into 100 sec bins |
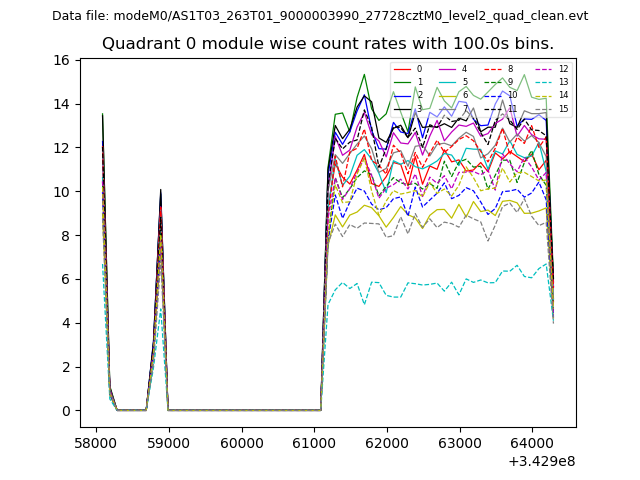 |
 |
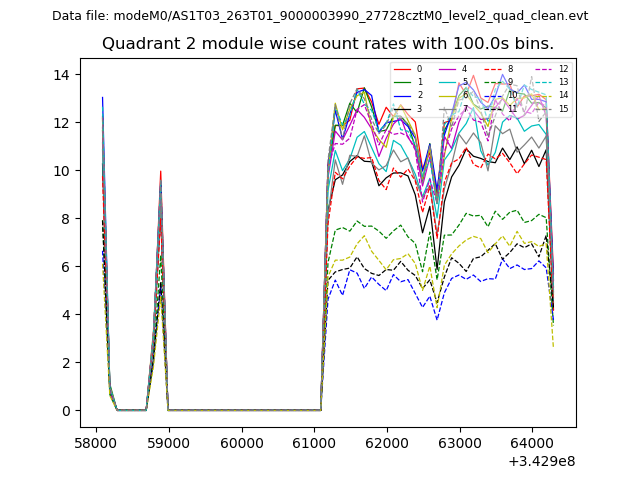
| Module-wise count rates for Quadrant B Data is divided into 100 sec bins |
 |
 |
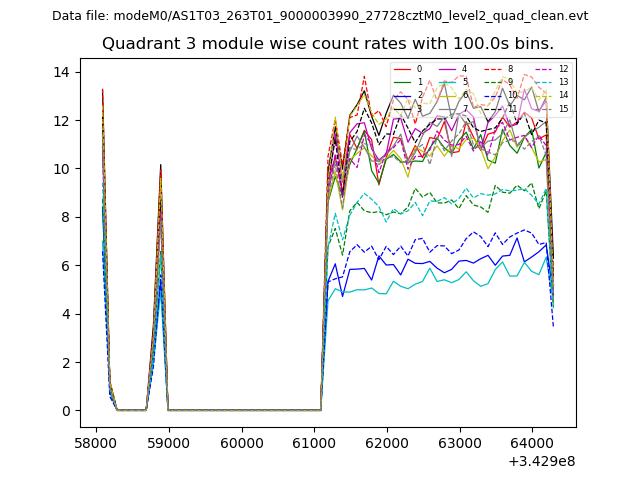
| Module-wise count rates for Quadrant C Data is divided into 100 sec bins |
 |
 |
| Module-wise count rates for Quadrant D Data is divided into 100 sec bins |
 |
 |
| Parameter | Plot |
|---|---|
| CZT HV Monitor | 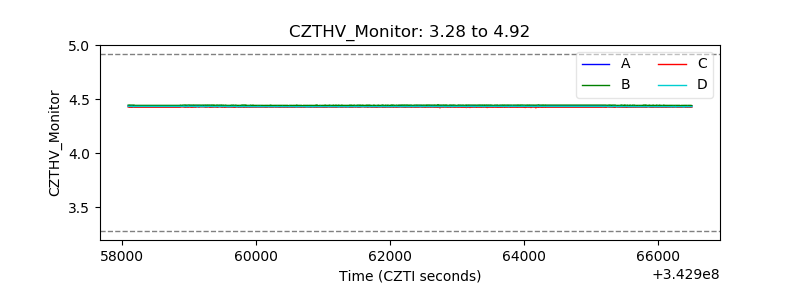 |
| D_VDD |  |
| Temperature 1 |  |
| Veto HV Monitor | 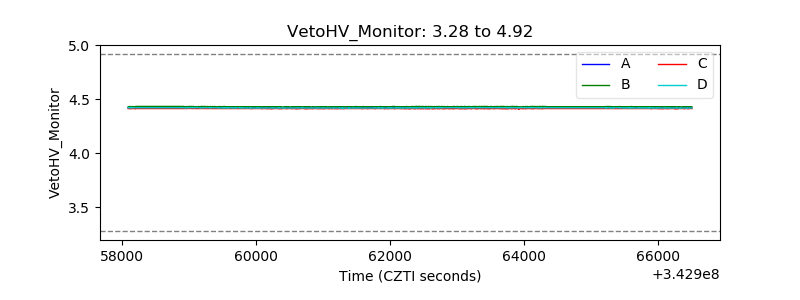 |
| Veto LLD | 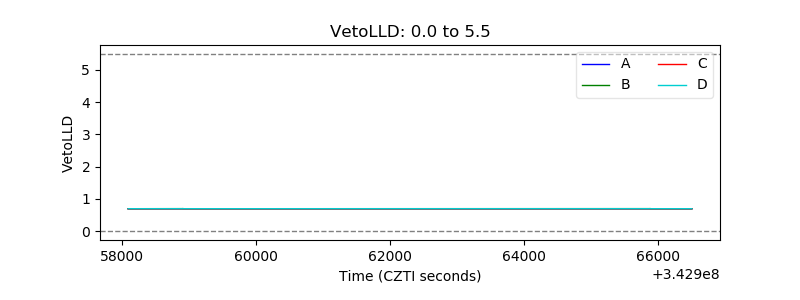 |
| Alpha Counter | 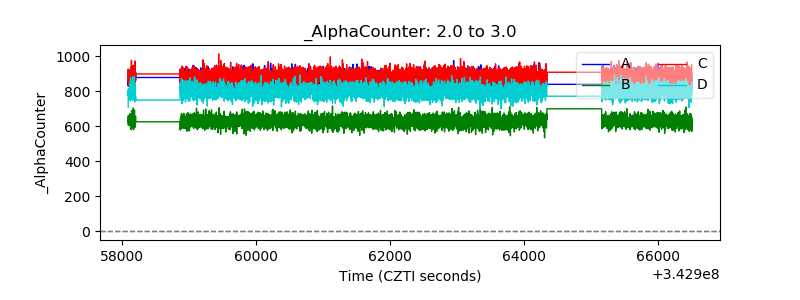 |
| _CPM_Rate | 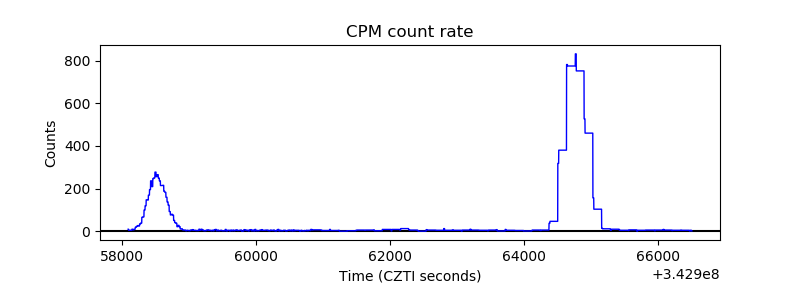 |
| CZT Counter | 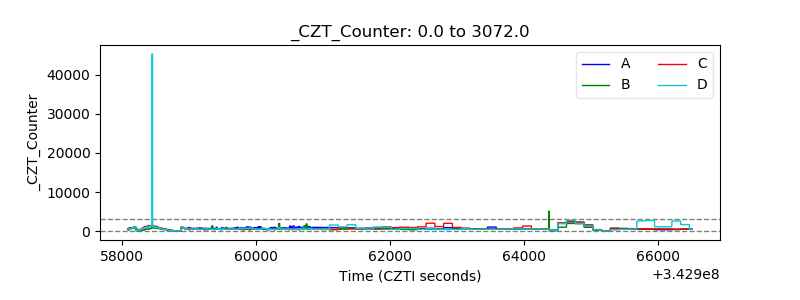 |
| +2.5 Volts monitor | 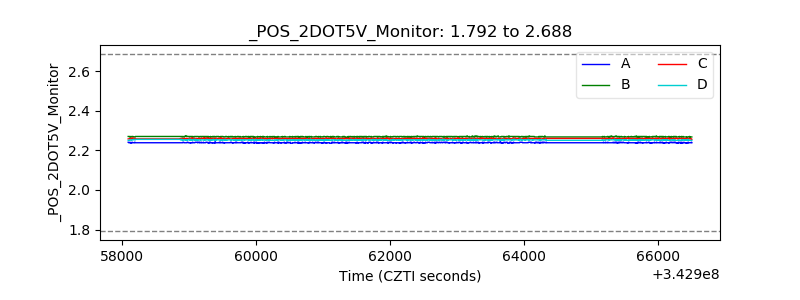 |
| +5 Volts monitor | 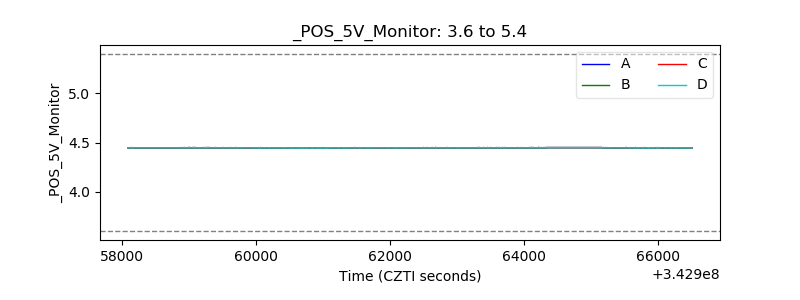 |
| _ROLL_ROT | 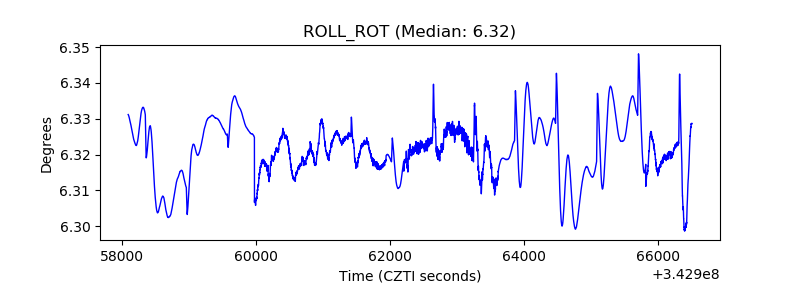 |
| _Roll_DEC | 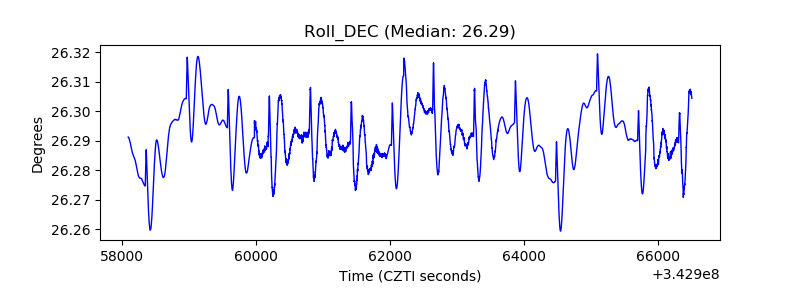 |
| _Roll_RA | 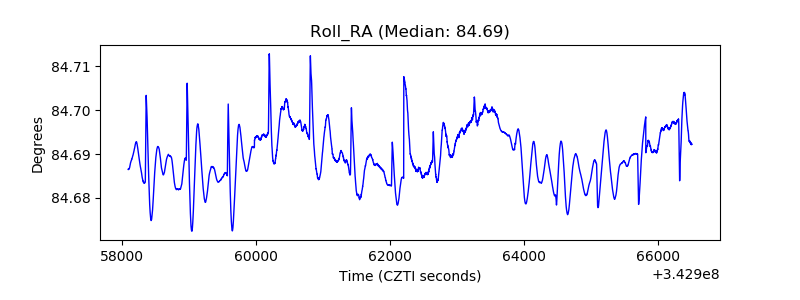 |
| Veto Counter | 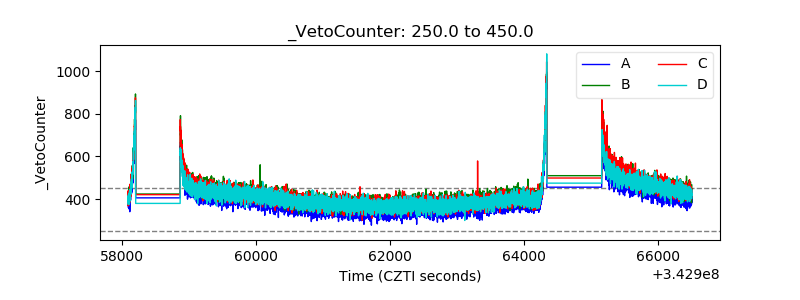 |