| Param | Original file | Final file |
|---|---|---|
| Filename | modeM0/AS1T03_263T01_9000003990_27729cztM0_level2.evt | modeM0/AS1T03_263T01_9000003990_27729cztM0_level2_quad_clean.evt |
| Size (bytes) | 617,952,960 | 90,573,120 |
| Size | 589.3 MB | 86.4 MB |
| Events in quadrant A | 4,320,699 | 605,324 |
| Events in quadrant B | 5,625,379 | 516,735 |
| Events in quadrant C | 3,857,156 | 591,041 |
| Events in quadrant D | 4,456,309 | 561,011 |
| Mode M0 | |||
|---|---|---|---|
| Quadrant | BADHDUFLAG | Total packets | Discarded packets |
| A | 0 | 17069 | 0 |
| B | 0 | 20934 | 0 |
| C | 0 | 15718 | 0 |
| D | 0 | 17462 | 0 |
| Mode M9 | |||
|---|---|---|---|
| Quadrant | BADHDUFLAG | Total packets | Discarded packets |
| A | 0 | 11 | 0 |
| B | 0 | 12 | 0 |
| C | 0 | 12 | 0 |
| D | 0 | 12 | 0 |
| Quadrant | Total seconds | Saturated seconds | Saturation percentage |
|---|---|---|---|
| A | 6714 | 132 | 1.966041% |
| B | 6714 | 1105 | 16.458147% |
| C | 6714 | 128 | 1.906464% |
| D | 6714 | 370 | 5.510873% |
Noise dominated data is calculated using 1-second bins in cleaned event files. If a bin has >2000 counts, and if more than 50% of those come from <1% of pixels, then it is considered to be noise-dominated and hence unusable.
| Quadrant | # 1 sec bins | Bins with >0 counts | Bins with >2000 counts | High rate bins dominated by noise | Noise dominated (total time) | Noise dominated (detector-on time) | Marked lightcurve |
|---|---|---|---|---|---|---|---|
| A | 7719 | 6714 | 59 | 59 | 0.76% | 0.88% | 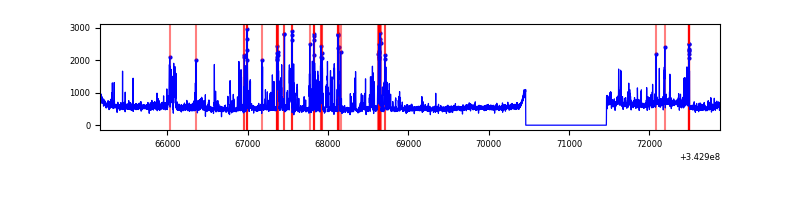 |
| B | 7719 | 6714 | 695 | 695 | 9.00% | 10.35% | 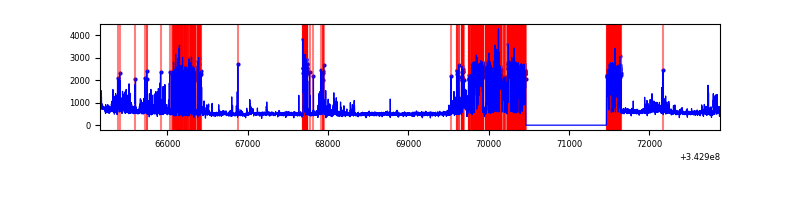 |
| C | 7719 | 6714 | 0 | 0 | 0.00% | 0.00% | 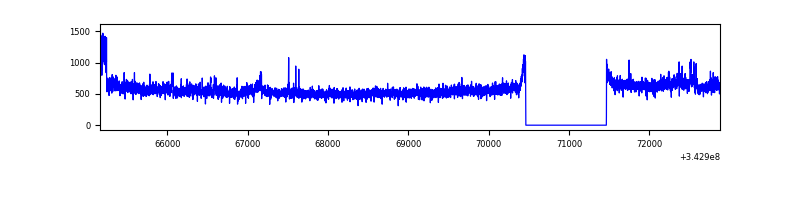 |
| D | 7719 | 6714 | 268 | 268 | 3.47% | 3.99% | 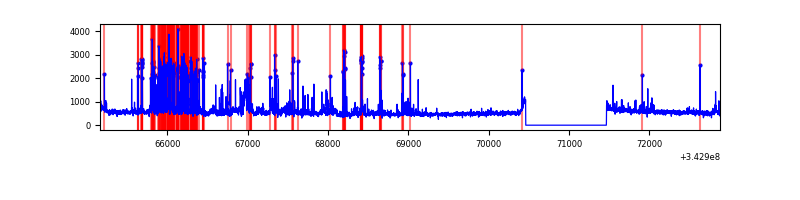 |
Top three noisy pixels from each quadrant. If the there are fewer than three noisy pixels in the level2.evt file, extra rows are filled as -1
| Pixel properties | Quadrant properties | ||||||
|---|---|---|---|---|---|---|---|
| Quadrant | DetID | PixID | Counts | Sigma | Mean | Median | Sigma |
| A | 6 | 16 | 798636 | 4170.26 | 911 | 897 | 191.3 |
| A | 13 | 254 | 10806 | 51.8 | 911 | 897 | 191.3 |
| A | 15 | 169 | 10529 | 50.35 | 911 | 897 | 191.3 |
| B | 3 | 64 | 2384534 | 14832.9 | 812 | 792 | 160.7 |
| B | 12 | 111 | 17634 | 104.8 | 812 | 792 | 160.7 |
| B | 4 | 200 | 17540 | 104.21 | 812 | 792 | 160.7 |
| C | 3 | 233 | 293453 | 1375.5 | 877 | 886 | 212.7 |
| C | 14 | 238 | 144223 | 673.9 | 877 | 886 | 212.7 |
| C | 13 | 61 | 5922 | 23.68 | 877 | 886 | 212.7 |
| D | 1 | 52 | 1080294 | 5077.52 | 853 | 831 | 212.6 |
| D | 2 | 250 | 60039 | 278.5 | 853 | 831 | 212.6 |
| D | 11 | 176 | 58263 | 270.15 | 853 | 831 | 212.6 |
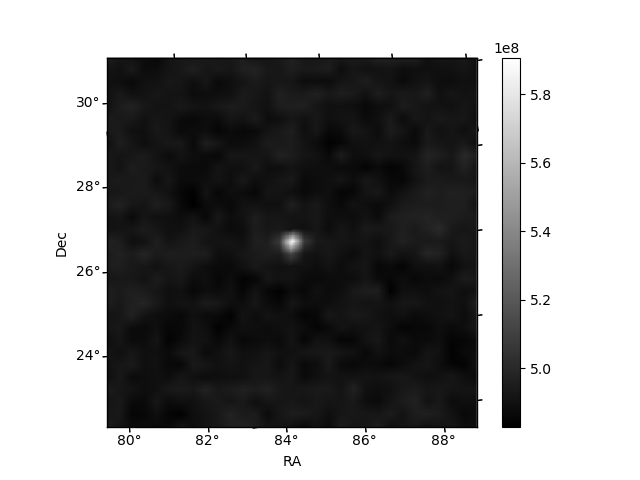
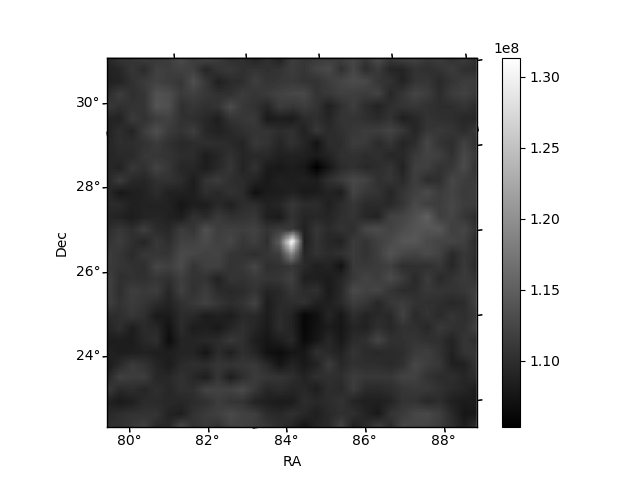
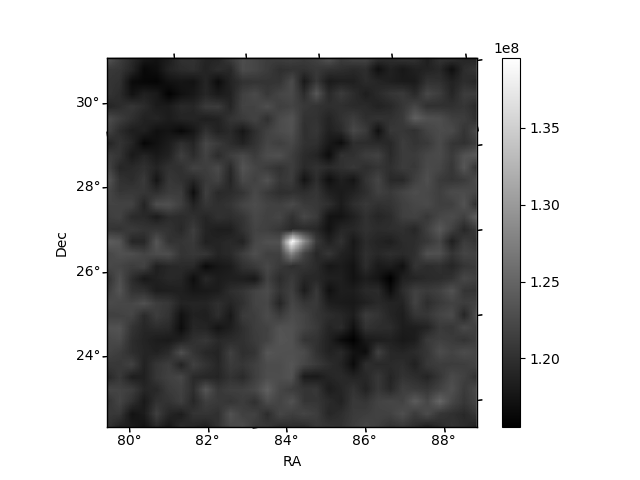
Histogram calculated using DETX and DETY for each event in the final _common_clean file
| Quadrant A | 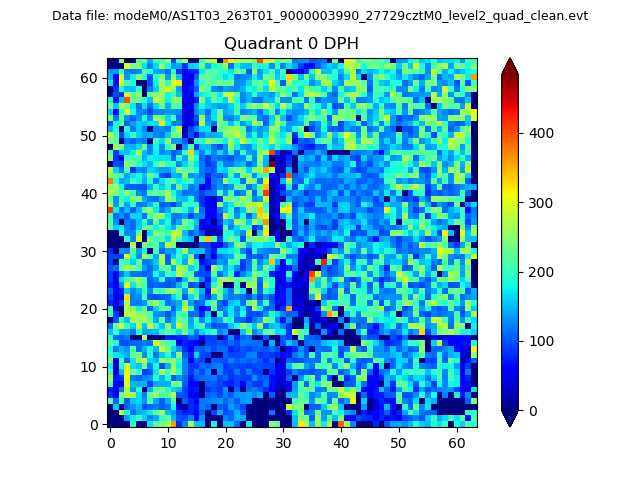 |
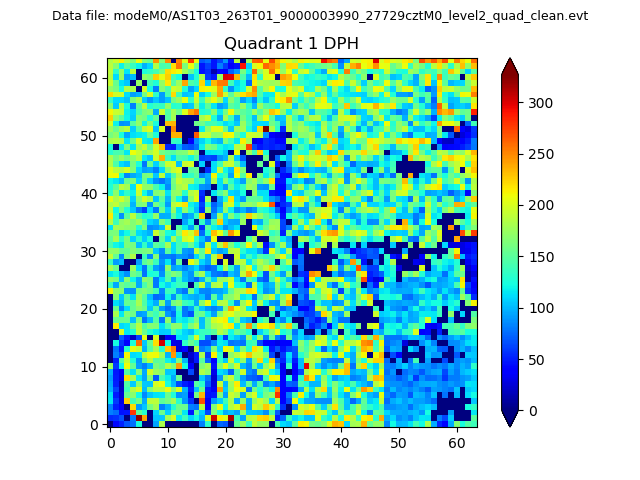 |
Quadrant B |
|---|---|---|---|
| Quadrant D | 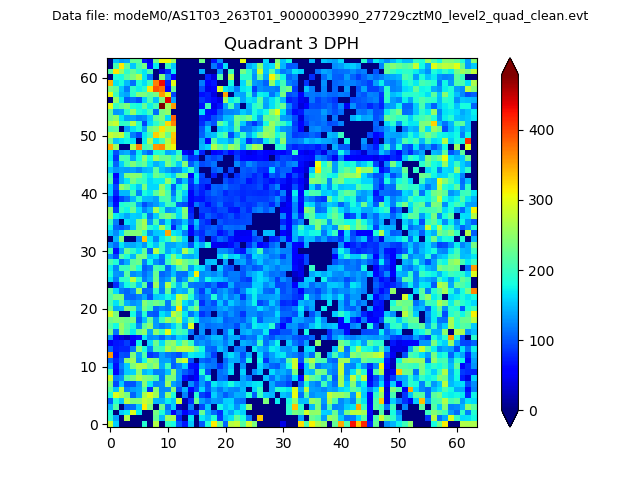 |
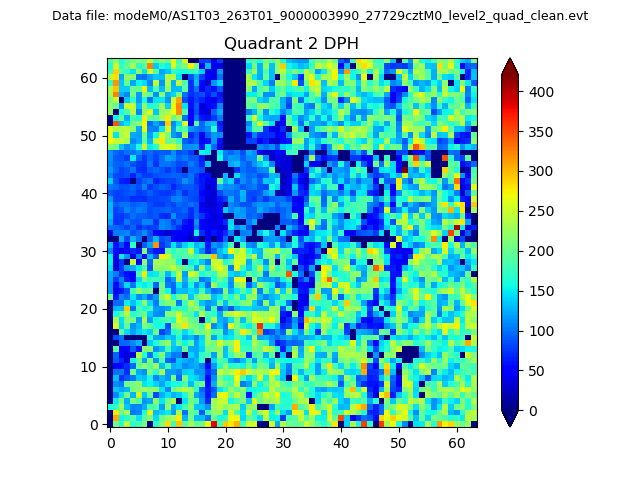 |
Quadrant C |
| Plot type | Count rate plots | Images |
|---|---|---|
| Comparison with Poisson distribution Blue bars denote a histogram of data divided into 1 sec bins. Red curve is a Poisson curve with rate = median count rate of data. |
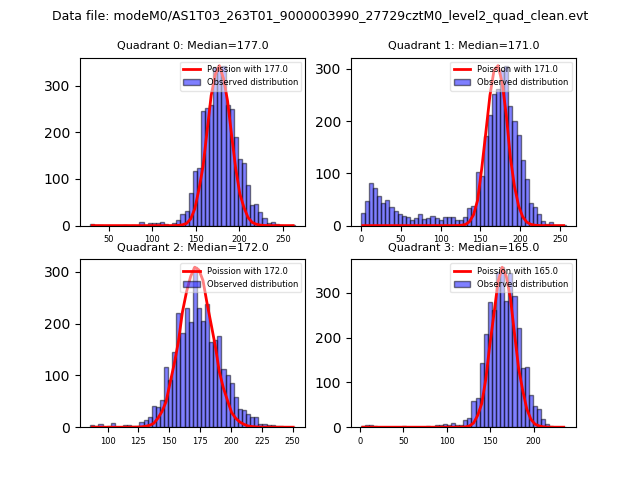 |
 |
| Quadrant-wise count rates Data is divided into 100 sec bins |
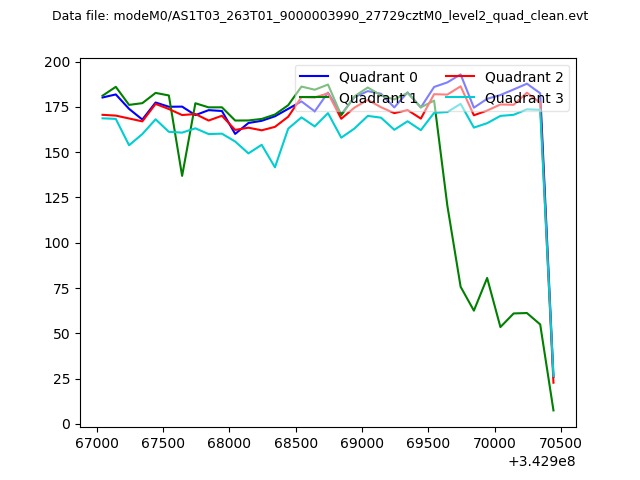 |
|
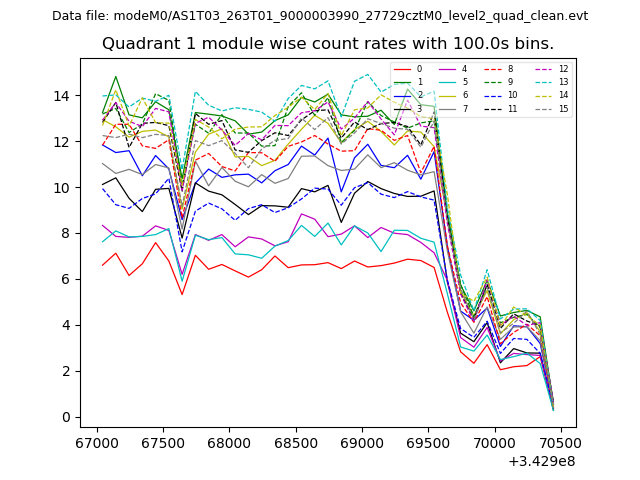
| Module-wise count rates for Quadrant A Data is divided into 100 sec bins |
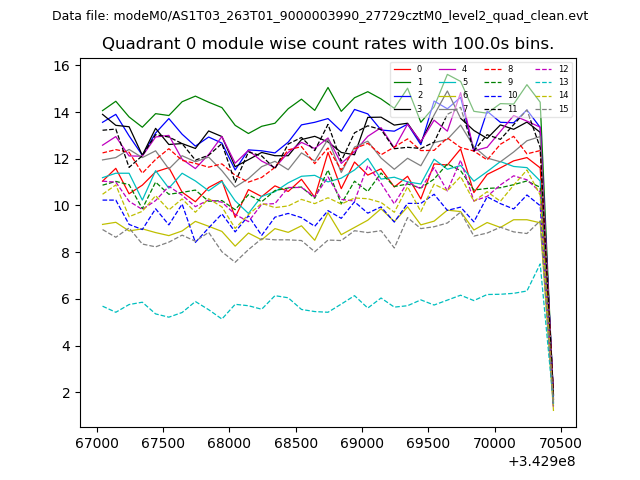 |
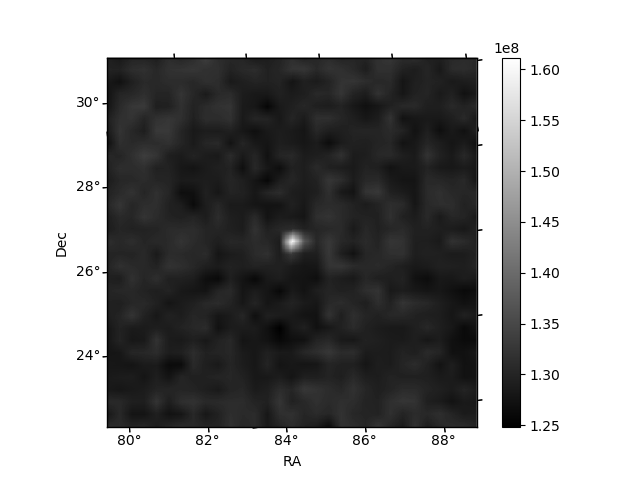 |
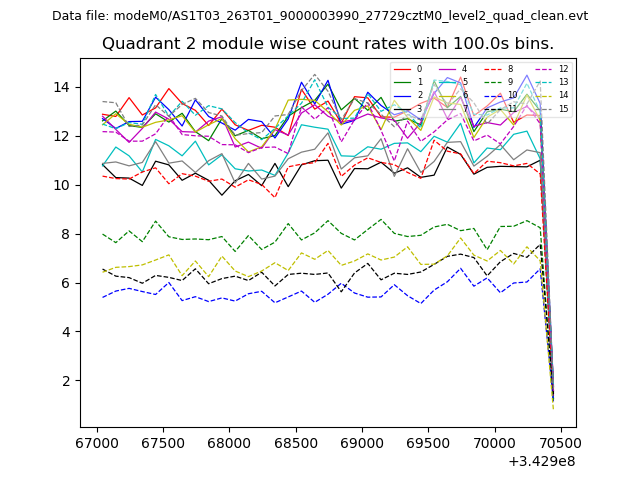
| Module-wise count rates for Quadrant B Data is divided into 100 sec bins |
 |
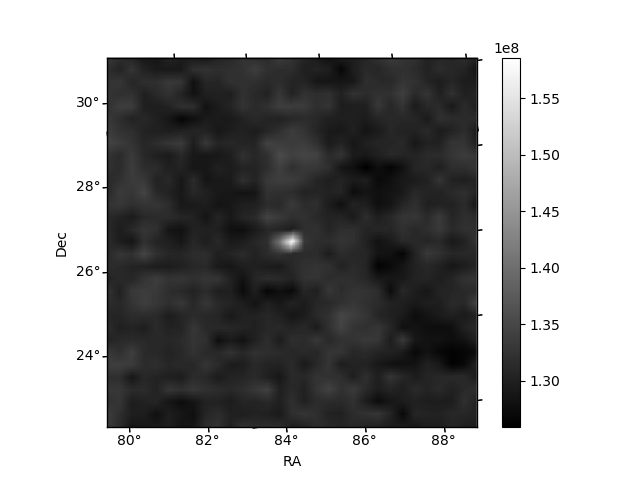 |
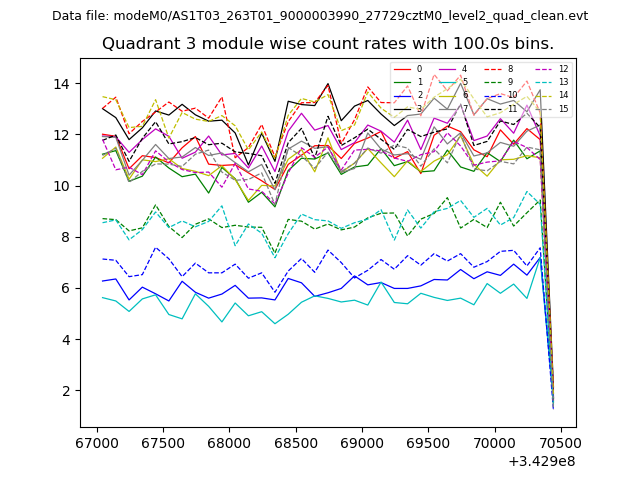
| Module-wise count rates for Quadrant C Data is divided into 100 sec bins |
 |
 |
| Module-wise count rates for Quadrant D Data is divided into 100 sec bins |
 |
 |
| Parameter | Plot |
|---|---|
| CZT HV Monitor | 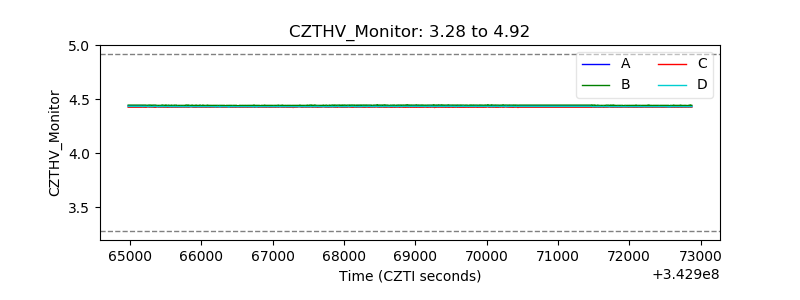 |
| D_VDD | 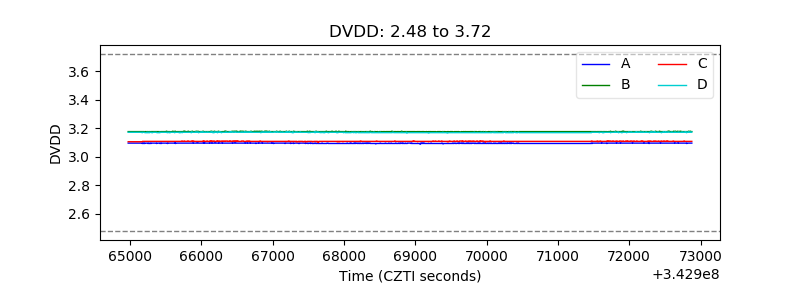 |
| Temperature 1 |  |
| Veto HV Monitor | 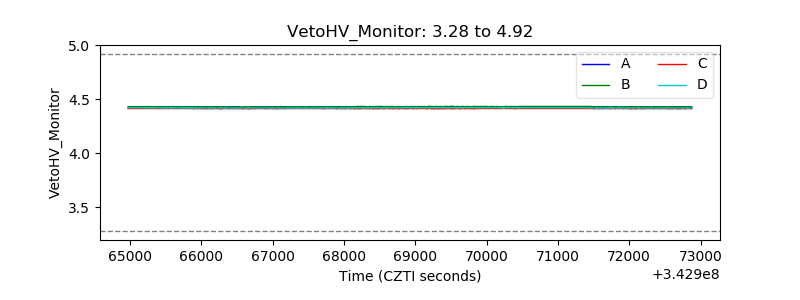 |
| Veto LLD | 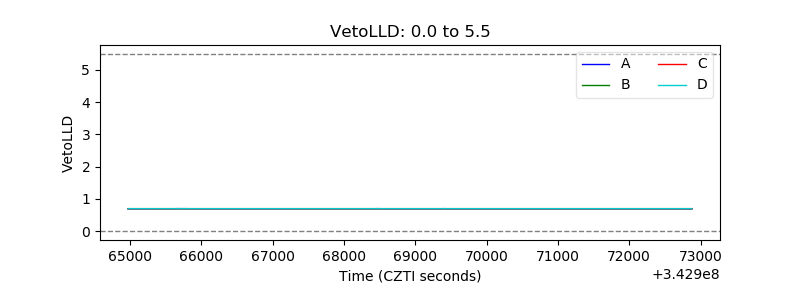 |
| Alpha Counter | 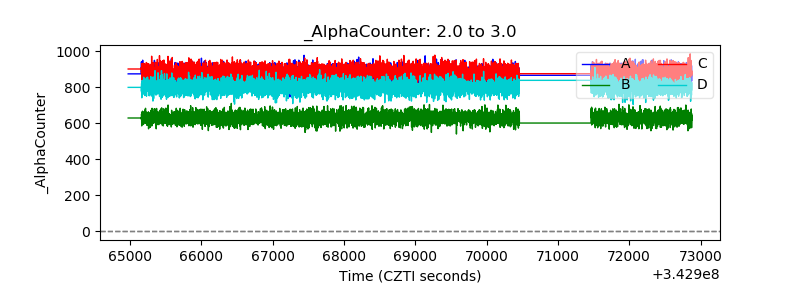 |
| _CPM_Rate | 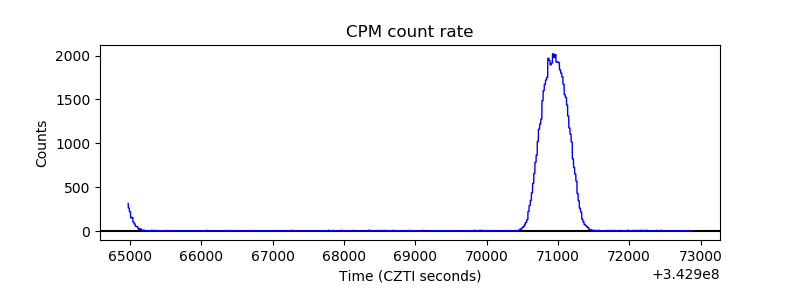 |
| CZT Counter | 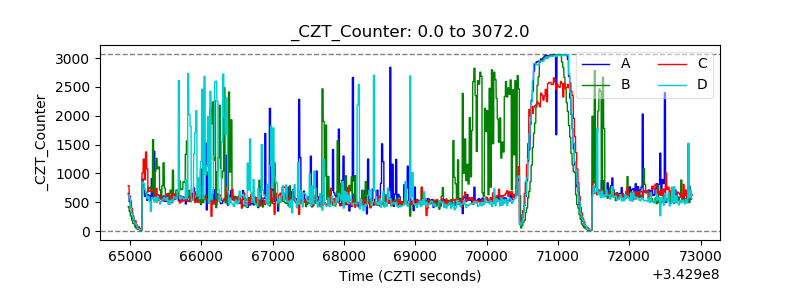 |
| +2.5 Volts monitor |  |
| +5 Volts monitor |  |
| _ROLL_ROT | 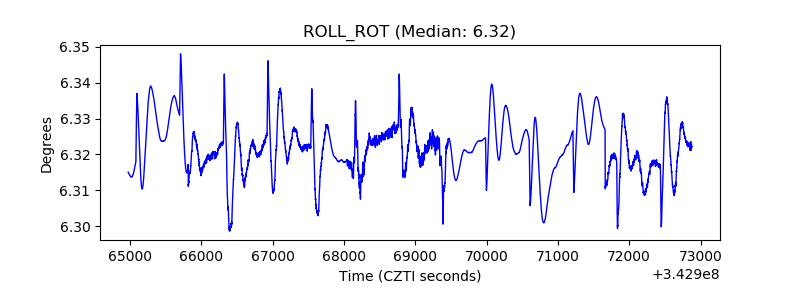 |
| _Roll_DEC | 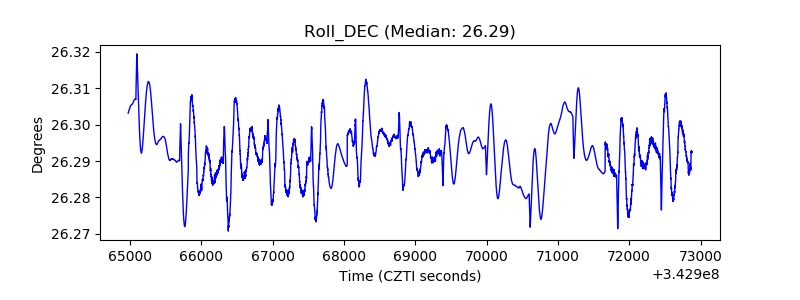 |
| _Roll_RA | 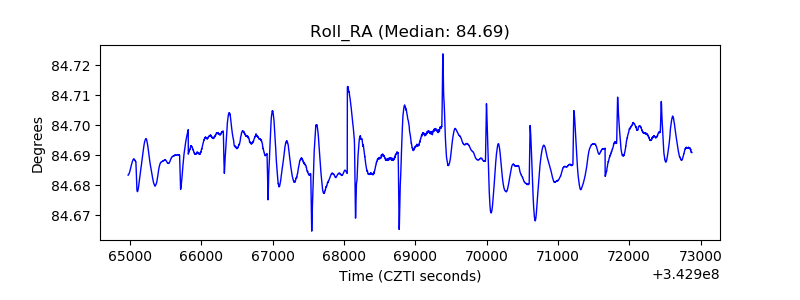 |
| Veto Counter |  |