| Param | Original file | Final file |
|---|---|---|
| Filename | modeM0/AS1T03_263T01_9000003990_27731cztM0_level2.evt | modeM0/AS1T03_263T01_9000003990_27731cztM0_level2_quad_clean.evt |
| Size (bytes) | 550,477,440 | 110,194,560 |
| Size | 525.0 MB | 105.1 MB |
| Events in quadrant A | 4,055,330 | 739,677 |
| Events in quadrant B | 4,271,031 | 736,345 |
| Events in quadrant C | 4,042,089 | 719,442 |
| Events in quadrant D | 3,863,428 | 689,612 |
| Mode M0 | |||
|---|---|---|---|
| Quadrant | BADHDUFLAG | Total packets | Discarded packets |
| A | 0 | 16363 | 0 |
| B | 0 | 16882 | 0 |
| C | 0 | 16730 | 0 |
| D | 0 | 15672 | 0 |
| Mode M9 | |||
|---|---|---|---|
| Quadrant | BADHDUFLAG | Total packets | Discarded packets |
| A | 0 | 21 | 0 |
| B | 0 | 21 | 0 |
| C | 0 | 21 | 0 |
| D | 0 | 21 | 0 |
| Quadrant | Total seconds | Saturated seconds | Saturation percentage |
|---|---|---|---|
| A | 6484 | 110 | 1.696484% |
| B | 6484 | 334 | 5.151141% |
| C | 6484 | 157 | 2.421345% |
| D | 6485 | 88 | 1.356978% |
Noise dominated data is calculated using 1-second bins in cleaned event files. If a bin has >2000 counts, and if more than 50% of those come from <1% of pixels, then it is considered to be noise-dominated and hence unusable.
| Quadrant | # 1 sec bins | Bins with >0 counts | Bins with >2000 counts | High rate bins dominated by noise | Noise dominated (total time) | Noise dominated (detector-on time) | Marked lightcurve |
|---|---|---|---|---|---|---|---|
| A | 8614 | 6484 | 13 | 13 | 0.15% | 0.20% | 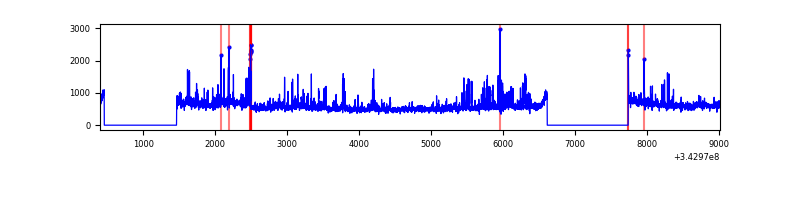 |
| B | 8614 | 6484 | 180 | 180 | 2.09% | 2.78% | 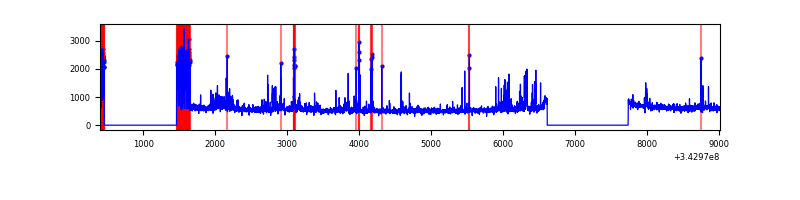 |
| C | 8614 | 6484 | 0 | 0 | 0.00% | 0.00% | 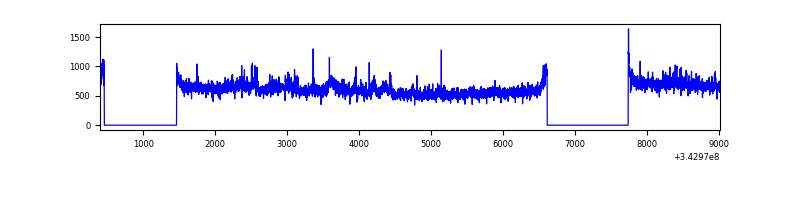 |
| D | 8615 | 6485 | 28 | 28 | 0.33% | 0.43% | 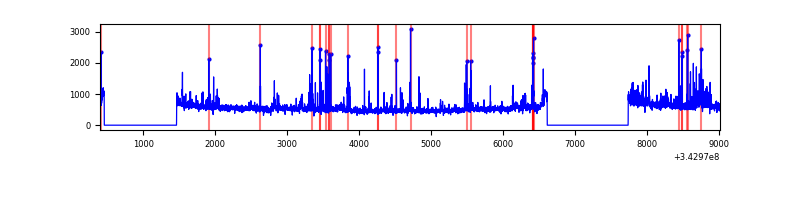 |
Top three noisy pixels from each quadrant. If the there are fewer than three noisy pixels in the level2.evt file, extra rows are filled as -1
| Pixel properties | Quadrant properties | ||||||
|---|---|---|---|---|---|---|---|
| Quadrant | DetID | PixID | Counts | Sigma | Mean | Median | Sigma |
| A | 6 | 16 | 477880 | 2425.14 | 924 | 910 | 196.7 |
| A | 13 | 254 | 10530 | 48.91 | 924 | 910 | 196.7 |
| A | 8 | 192 | 9657 | 44.47 | 924 | 910 | 196.7 |
| B | 3 | 64 | 711121 | 3957.57 | 897 | 878 | 179.5 |
| B | 5 | 255 | 23530 | 126.22 | 897 | 878 | 179.5 |
| B | 12 | 111 | 18744 | 99.55 | 897 | 878 | 179.5 |
| C | 3 | 233 | 393578 | 1769.8 | 899 | 907 | 221.9 |
| C | 14 | 238 | 146890 | 657.96 | 899 | 907 | 221.9 |
| C | 13 | 61 | 6160 | 23.68 | 899 | 907 | 221.9 |
| D | 1 | 52 | 238484 | 1053.6 | 902 | 881 | 225.5 |
| D | 11 | 176 | 103041 | 453.01 | 902 | 881 | 225.5 |
| D | 2 | 250 | 98915 | 434.71 | 902 | 881 | 225.5 |
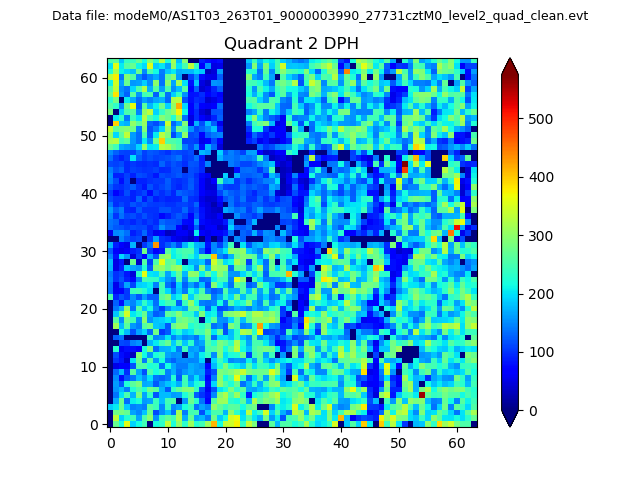
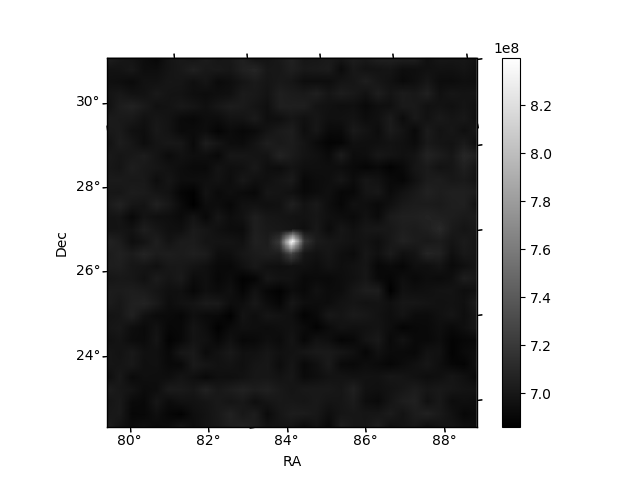
Histogram calculated using DETX and DETY for each event in the final _common_clean file
| Quadrant A | 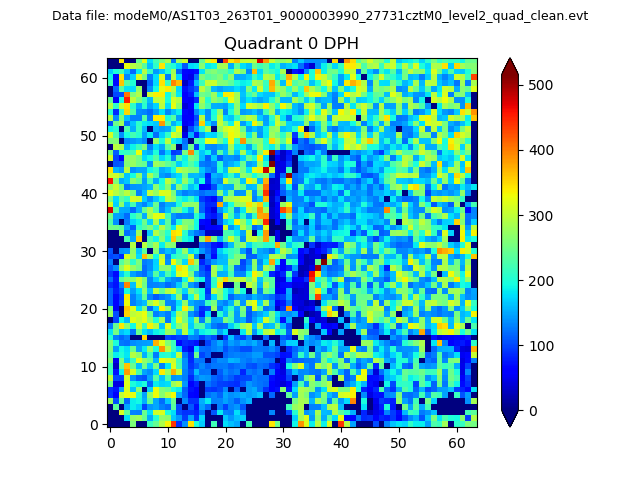 |
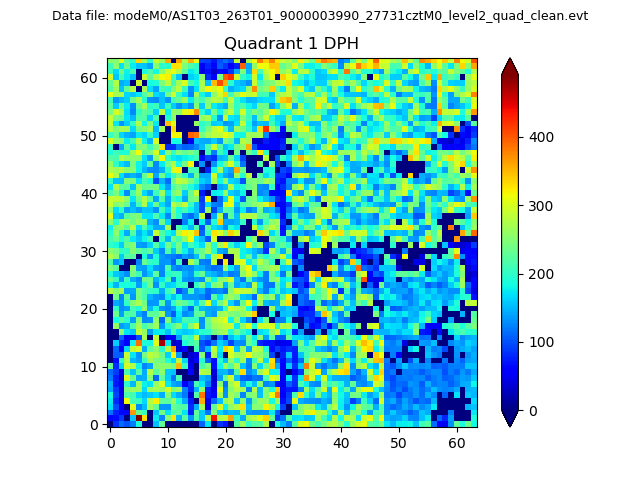 |
Quadrant B |
|---|---|---|---|
| Quadrant D | 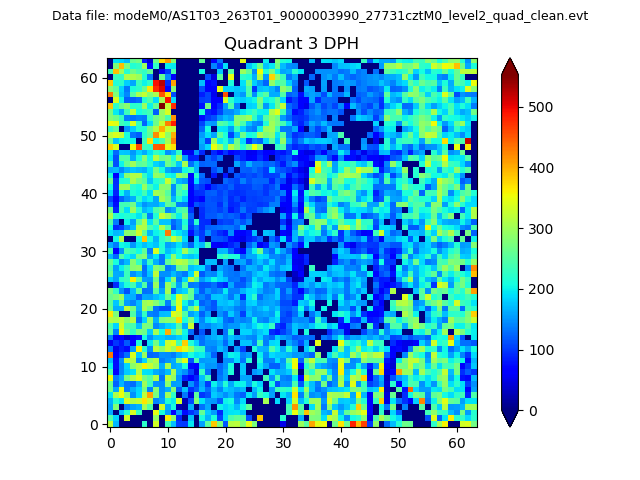 |
 |
Quadrant C |
| Plot type | Count rate plots | Images |
|---|---|---|
| Comparison with Poisson distribution Blue bars denote a histogram of data divided into 1 sec bins. Red curve is a Poisson curve with rate = median count rate of data. |
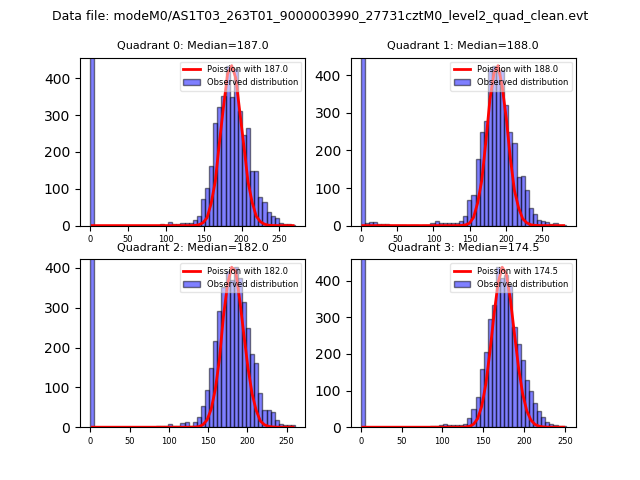 |
 |
| Quadrant-wise count rates Data is divided into 100 sec bins |
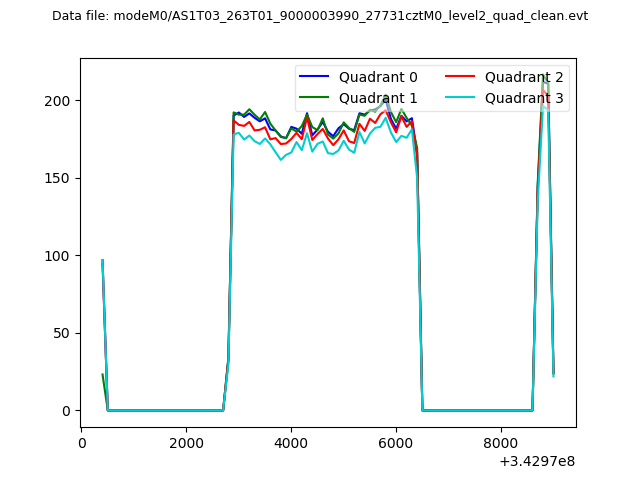 |
|
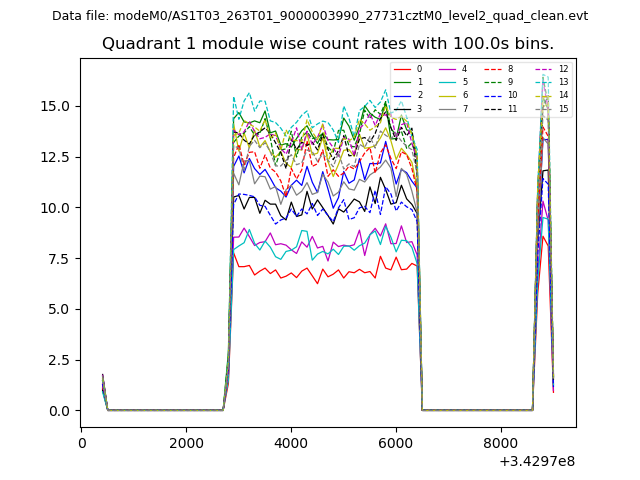
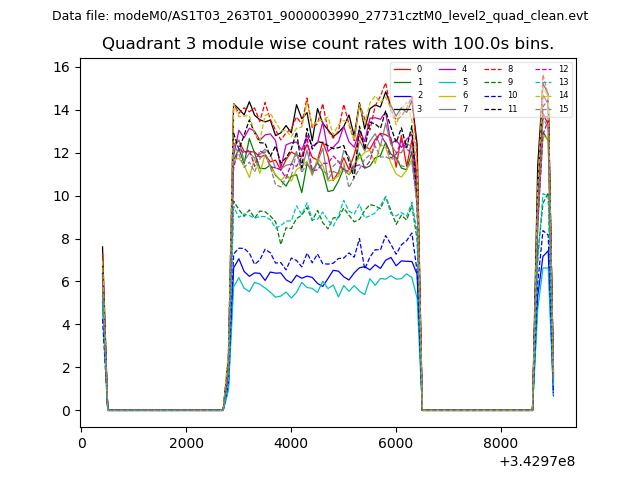
| Module-wise count rates for Quadrant A Data is divided into 100 sec bins |
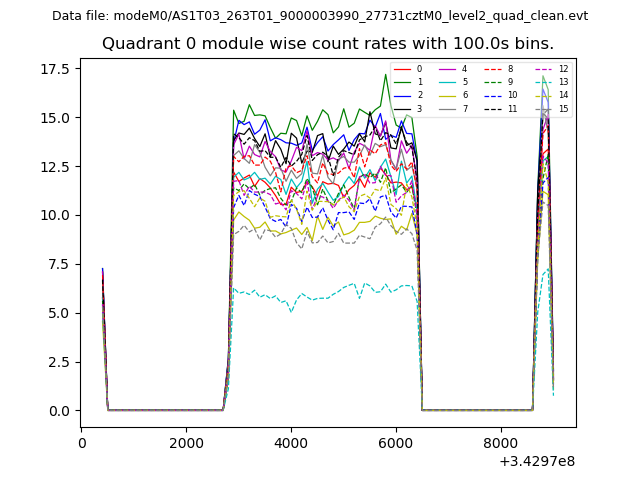 |
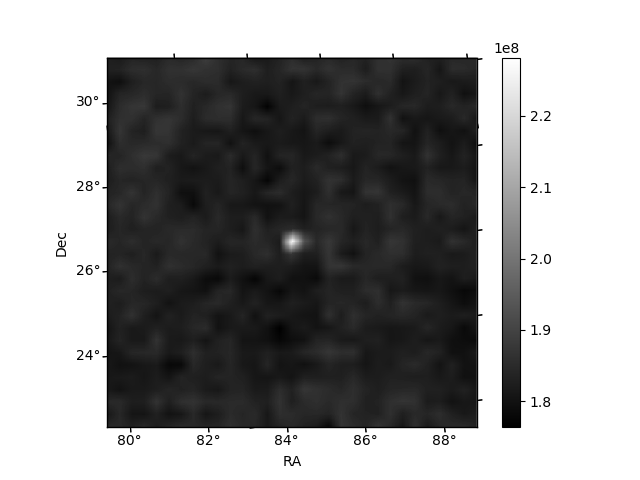 |
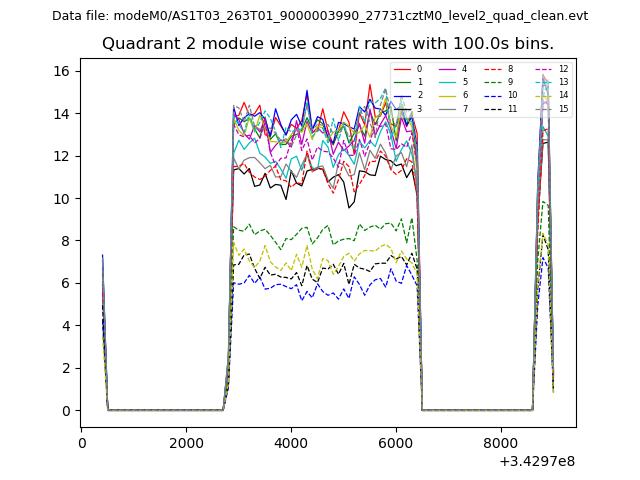
| Module-wise count rates for Quadrant B Data is divided into 100 sec bins |
 |
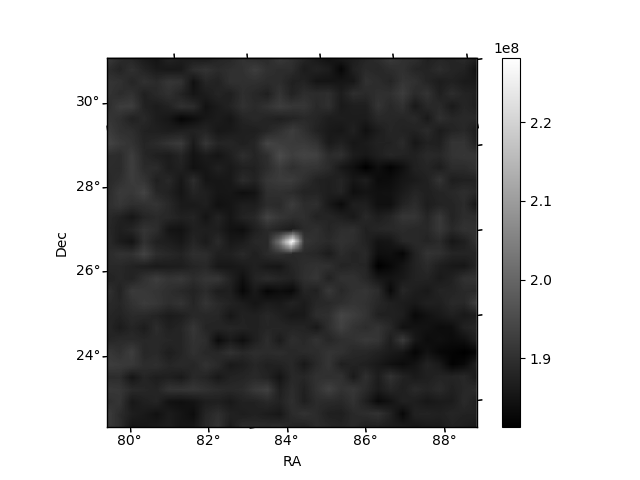 |
| Module-wise count rates for Quadrant C Data is divided into 100 sec bins |
 |
 |
| Module-wise count rates for Quadrant D Data is divided into 100 sec bins |
 |
 |
| Parameter | Plot |
|---|---|
| CZT HV Monitor | 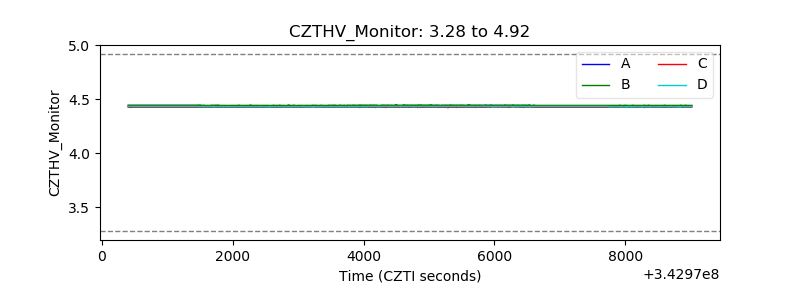 |
| D_VDD | 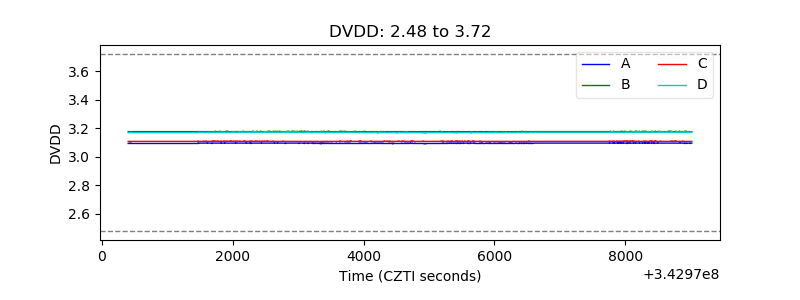 |
| Temperature 1 | 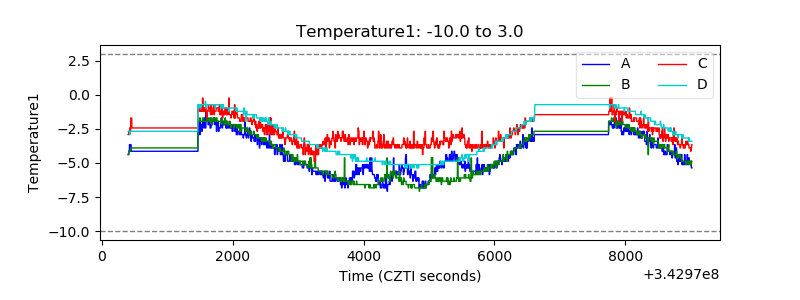 |
| Veto HV Monitor | 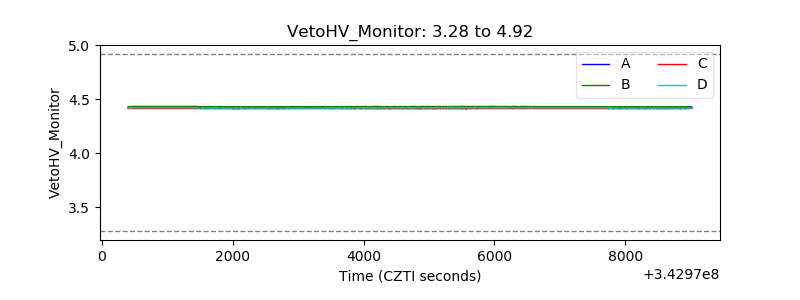 |
| Veto LLD | 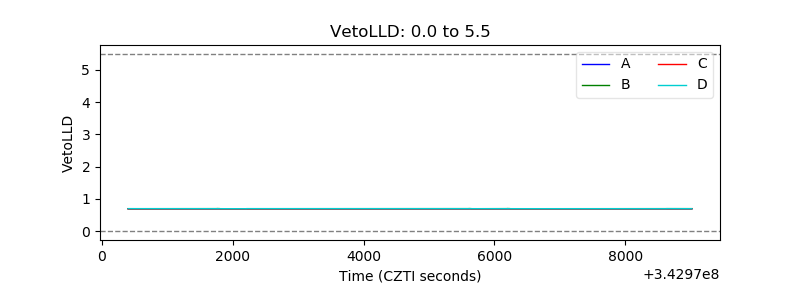 |
| Alpha Counter | 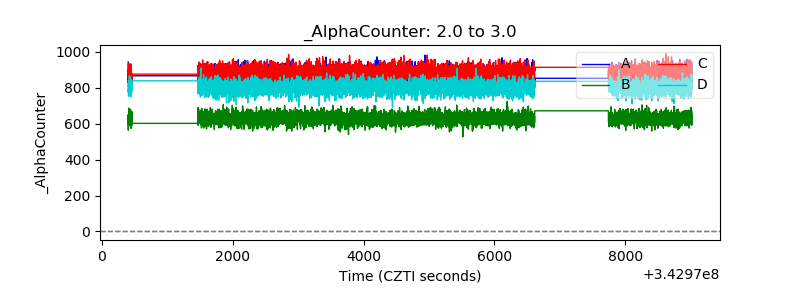 |
| _CPM_Rate | 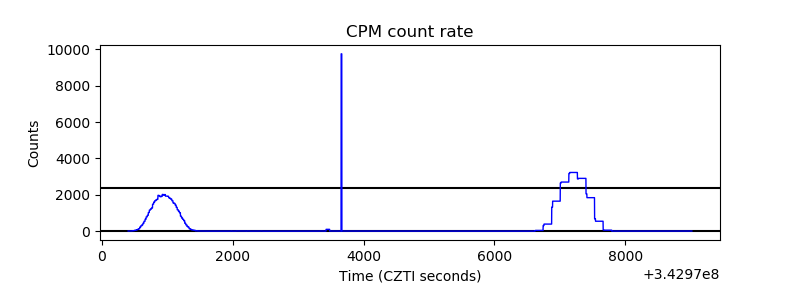 |
| CZT Counter | 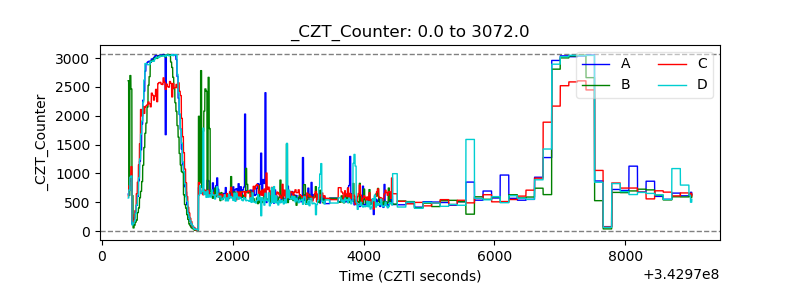 |
| +2.5 Volts monitor | 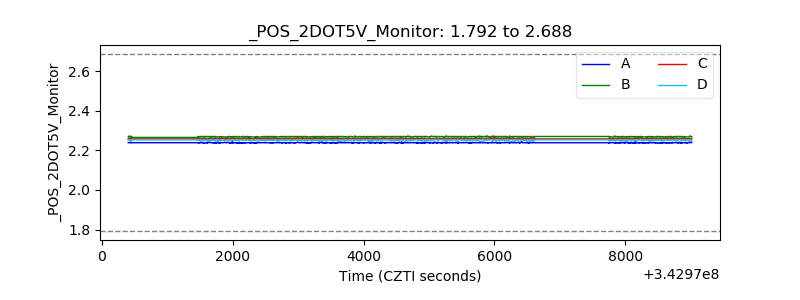 |
| +5 Volts monitor |  |
| _ROLL_ROT | 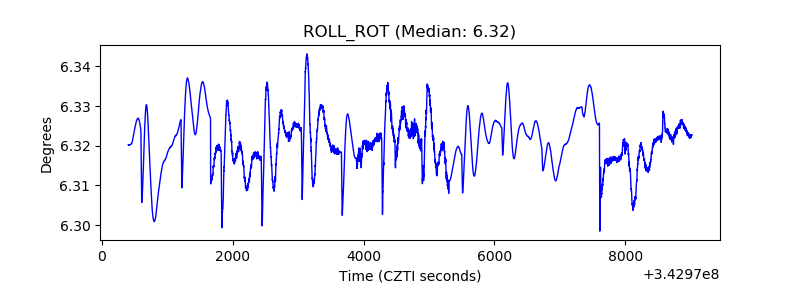 |
| _Roll_DEC | 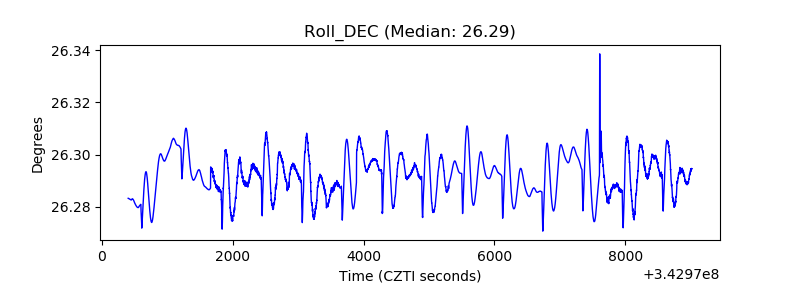 |
| _Roll_RA | 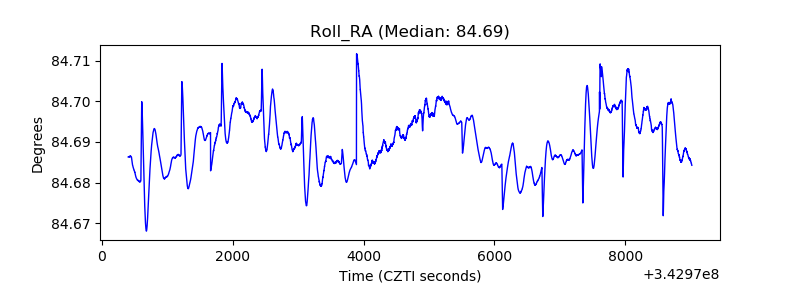 |
| Veto Counter |  |