| Param | Original file | Final file |
|---|---|---|
| Filename | modeM0/AS1T03_263T01_9000003990_27732cztM0_level2.evt | modeM0/AS1T03_263T01_9000003990_27732cztM0_level2_quad_clean.evt |
| Size (bytes) | 520,695,360 | 126,673,920 |
| Size | 496.6 MB | 120.8 MB |
| Events in quadrant A | 4,005,556 | 865,613 |
| Events in quadrant B | 3,654,590 | 879,301 |
| Events in quadrant C | 3,854,791 | 848,785 |
| Events in quadrant D | 3,831,259 | 807,072 |
| Mode M0 | |||
|---|---|---|---|
| Quadrant | BADHDUFLAG | Total packets | Discarded packets |
| A | 0 | 16117 | 0 |
| B | 0 | 14959 | 0 |
| C | 0 | 15813 | 0 |
| D | 0 | 15501 | 0 |
| Mode M9 | |||
|---|---|---|---|
| Quadrant | BADHDUFLAG | Total packets | Discarded packets |
| A | 0 | 13 | 0 |
| B | 0 | 13 | 0 |
| C | 0 | 13 | 0 |
| D | 0 | 13 | 0 |
| Quadrant | Total seconds | Saturated seconds | Saturation percentage |
|---|---|---|---|
| A | 6252 | 73 | 1.167626% |
| B | 6252 | 46 | 0.735765% |
| C | 6252 | 109 | 1.743442% |
| D | 6253 | 73 | 1.167440% |
Noise dominated data is calculated using 1-second bins in cleaned event files. If a bin has >2000 counts, and if more than 50% of those come from <1% of pixels, then it is considered to be noise-dominated and hence unusable.
| Quadrant | # 1 sec bins | Bins with >0 counts | Bins with >2000 counts | High rate bins dominated by noise | Noise dominated (total time) | Noise dominated (detector-on time) | Marked lightcurve |
|---|---|---|---|---|---|---|---|
| A | 7512 | 6252 | 9 | 9 | 0.12% | 0.14% | 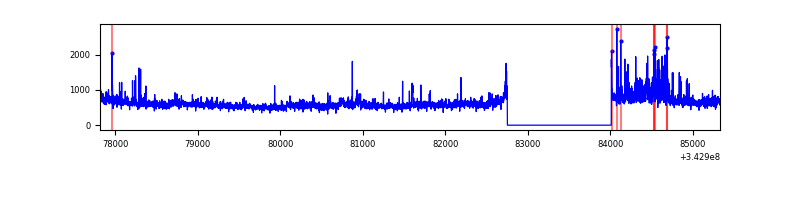 |
| B | 7512 | 6252 | 2 | 2 | 0.03% | 0.03% | 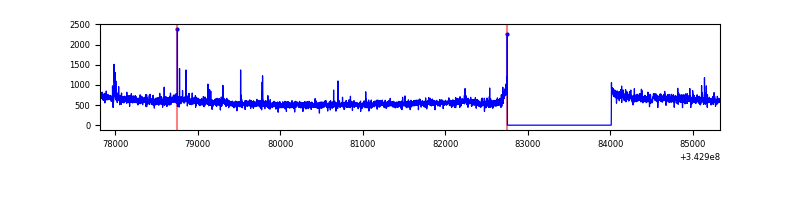 |
| C | 7512 | 6252 | 0 | 0 | 0.00% | 0.00% | 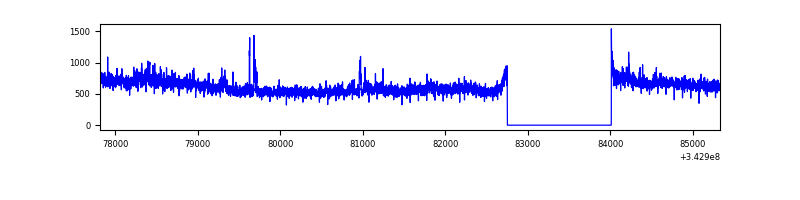 |
| D | 7513 | 6254 | 34 | 34 | 0.45% | 0.54% | 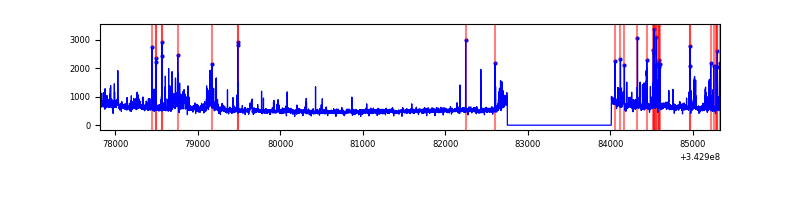 |
Top three noisy pixels from each quadrant. If the there are fewer than three noisy pixels in the level2.evt file, extra rows are filled as -1
| Pixel properties | Quadrant properties | ||||||
|---|---|---|---|---|---|---|---|
| Quadrant | DetID | PixID | Counts | Sigma | Mean | Median | Sigma |
| A | 6 | 16 | 302604 | 1521.78 | 913 | 899 | 198.3 |
| A | 0 | 13 | 172126 | 863.66 | 913 | 899 | 198.3 |
| A | 13 | 254 | 11352 | 52.72 | 913 | 899 | 198.3 |
| B | 5 | 255 | 22816 | 117.09 | 920 | 904 | 187.1 |
| B | 12 | 111 | 18625 | 94.69 | 920 | 904 | 187.1 |
| B | 0 | 230 | 17525 | 88.82 | 920 | 904 | 187.1 |
| C | 3 | 233 | 203789 | 915.73 | 896 | 907 | 221.6 |
| C | 14 | 238 | 147369 | 661.07 | 896 | 907 | 221.6 |
| C | 13 | 61 | 6163 | 23.72 | 896 | 907 | 221.6 |
| D | 1 | 52 | 267203 | 1187.87 | 888 | 866 | 224.2 |
| D | 2 | 250 | 98742 | 436.53 | 888 | 866 | 224.2 |
| D | 11 | 176 | 89559 | 395.57 | 888 | 866 | 224.2 |
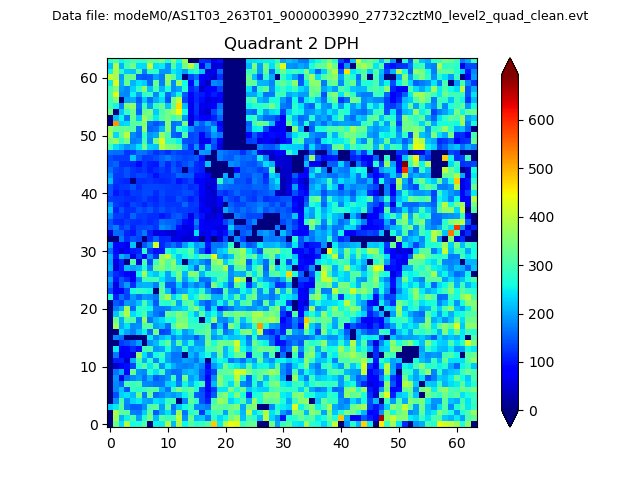
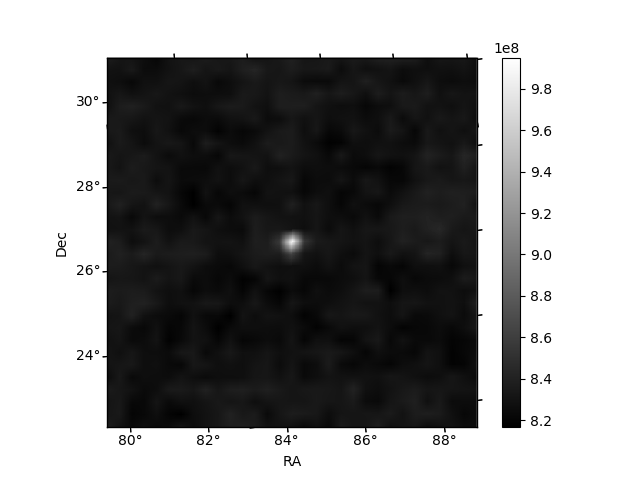
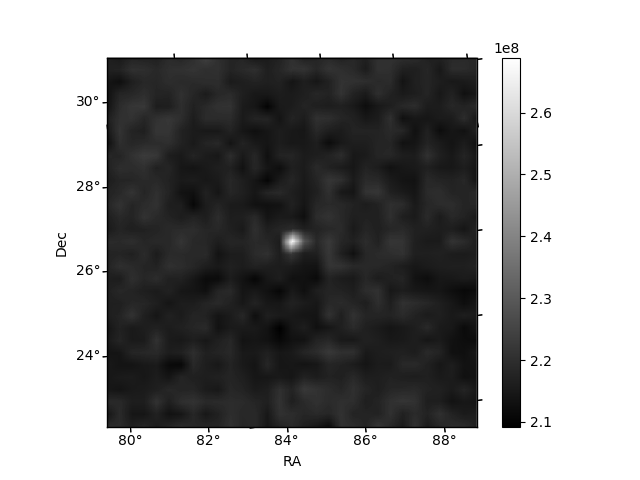
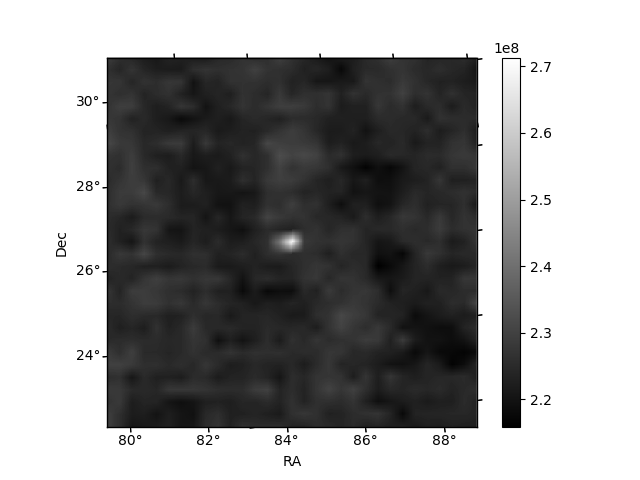
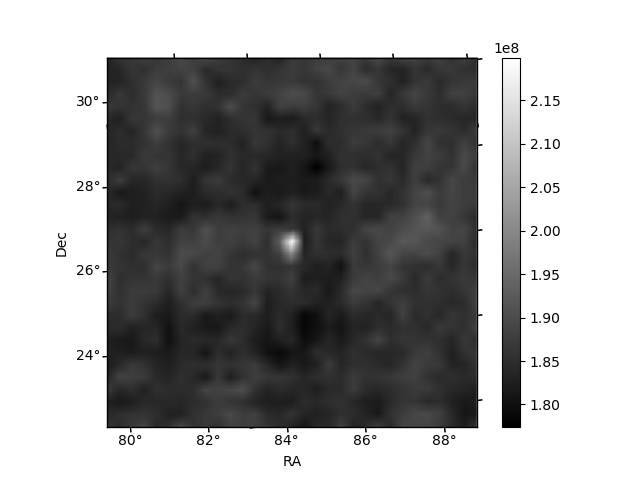
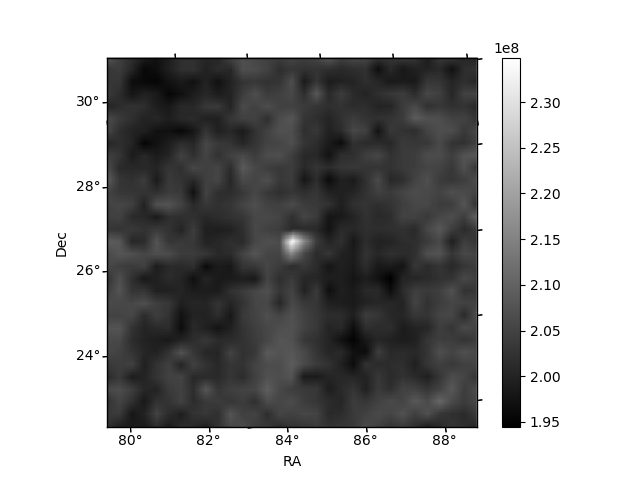
Histogram calculated using DETX and DETY for each event in the final _common_clean file
| Quadrant A | 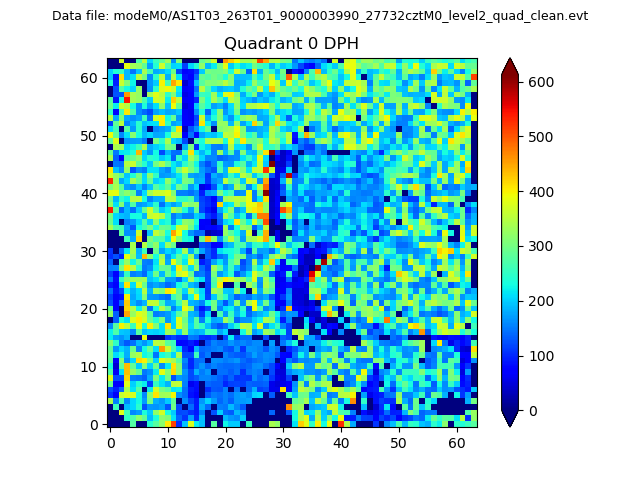 |
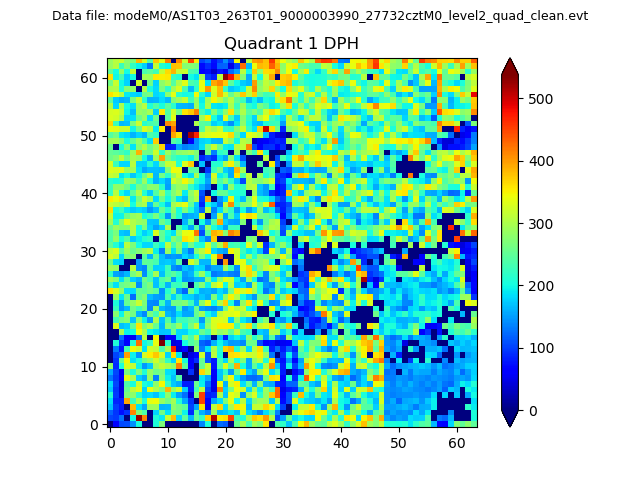 |
Quadrant B |
|---|---|---|---|
| Quadrant D | 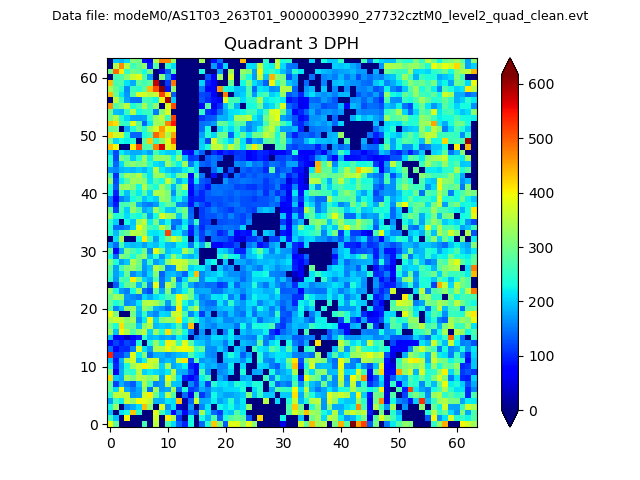 |
 |
Quadrant C |
| Plot type | Count rate plots | Images |
|---|---|---|
| Comparison with Poisson distribution Blue bars denote a histogram of data divided into 1 sec bins. Red curve is a Poisson curve with rate = median count rate of data. |
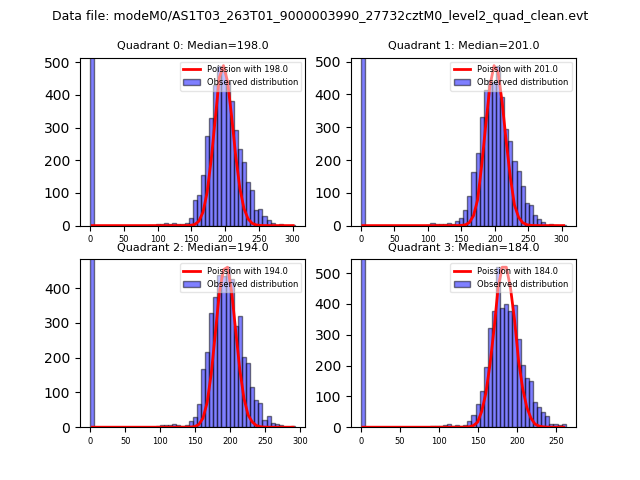 |
 |
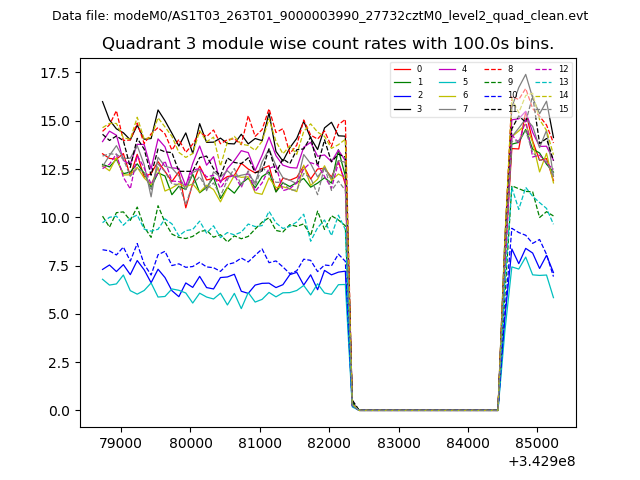
| Quadrant-wise count rates Data is divided into 100 sec bins |
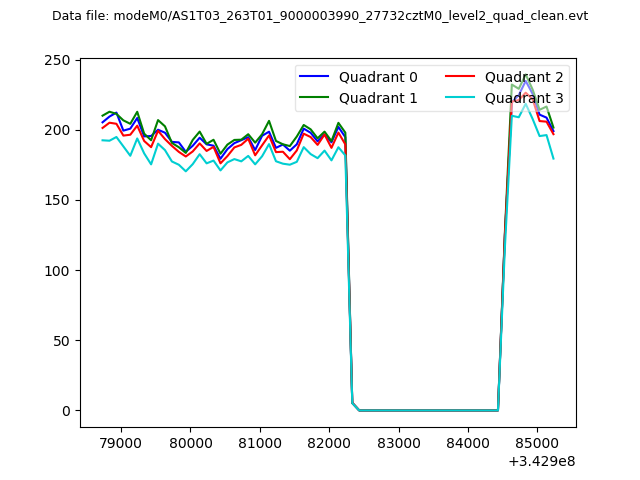 |
|
| Module-wise count rates for Quadrant A Data is divided into 100 sec bins |
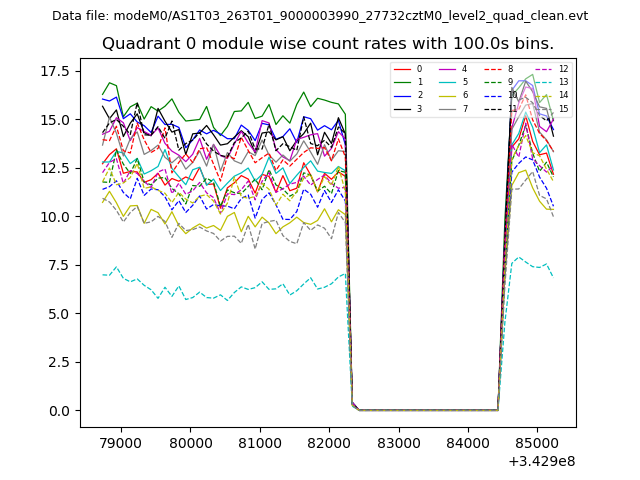 |
 |
| Module-wise count rates for Quadrant B Data is divided into 100 sec bins |
 |
 |
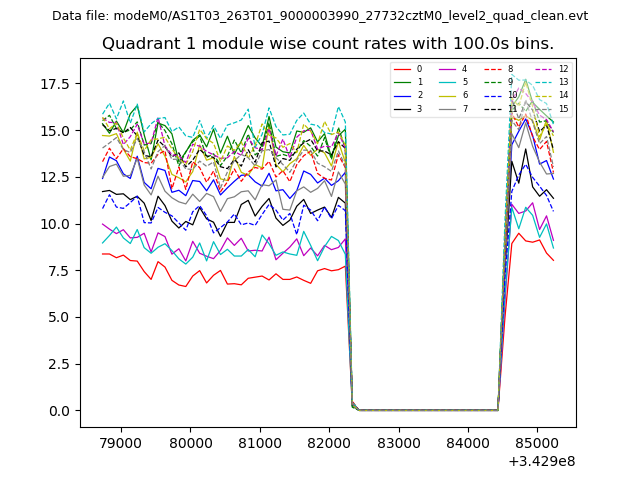
| Module-wise count rates for Quadrant C Data is divided into 100 sec bins |
 |
 |
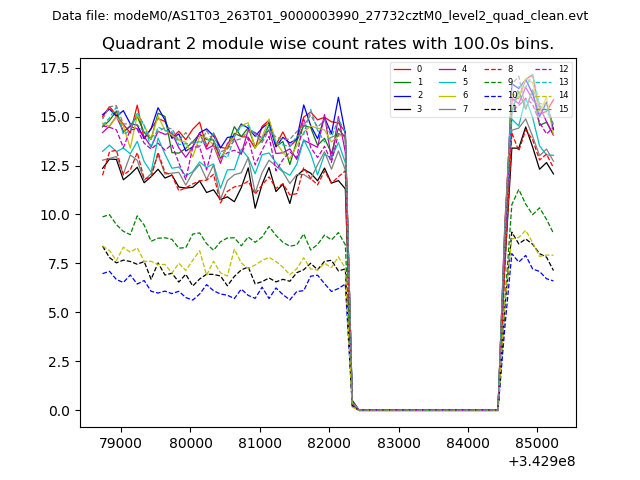
| Module-wise count rates for Quadrant D Data is divided into 100 sec bins |
 |
 |
| Parameter | Plot |
|---|---|
| CZT HV Monitor | 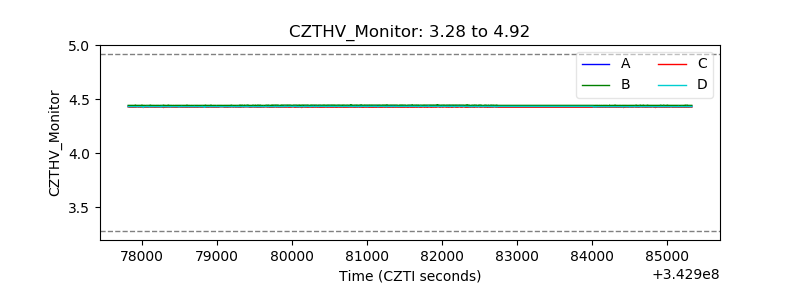 |
| D_VDD |  |
| Temperature 1 |  |
| Veto HV Monitor | 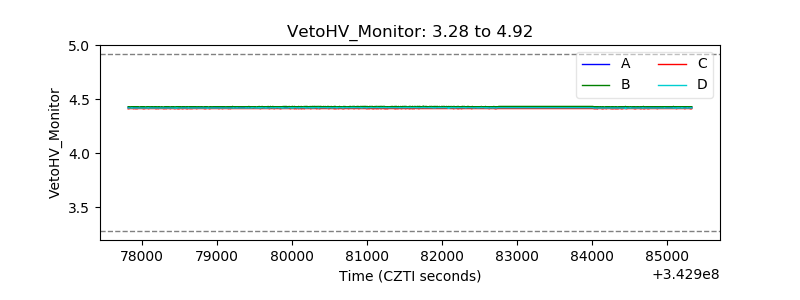 |
| Veto LLD | 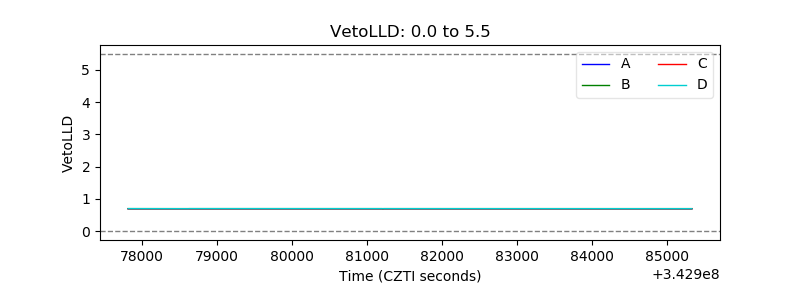 |
| Alpha Counter | 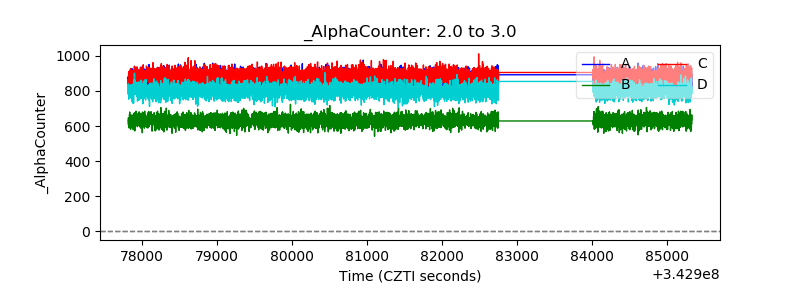 |
| _CPM_Rate | 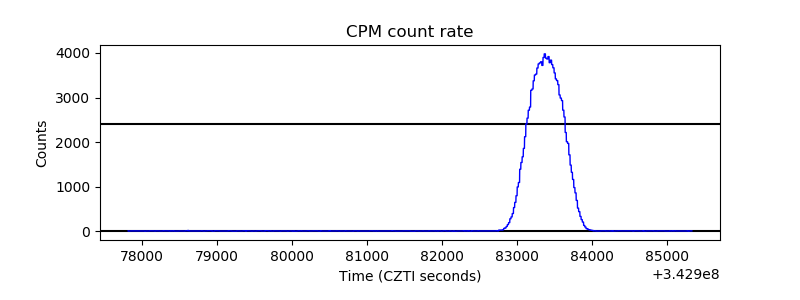 |
| CZT Counter | 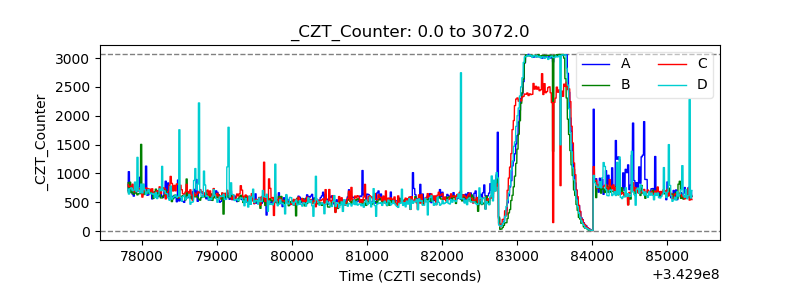 |
| +2.5 Volts monitor |  |
| +5 Volts monitor | 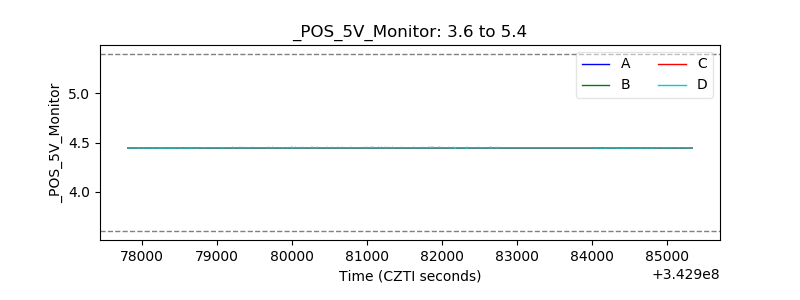 |
| _ROLL_ROT | 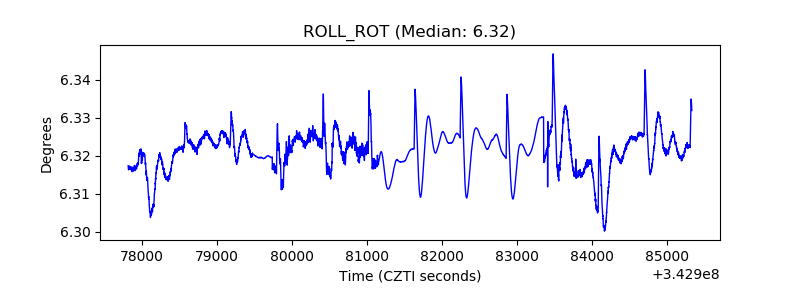 |
| _Roll_DEC | 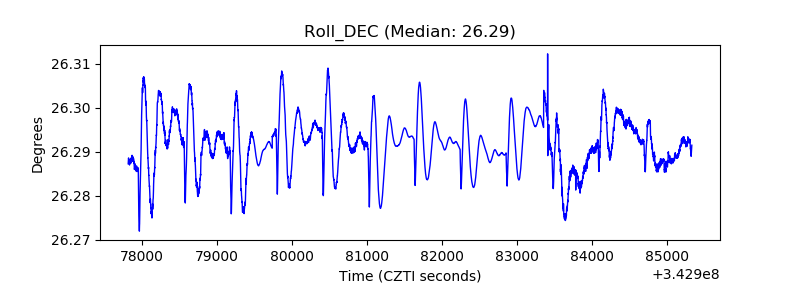 |
| _Roll_RA | 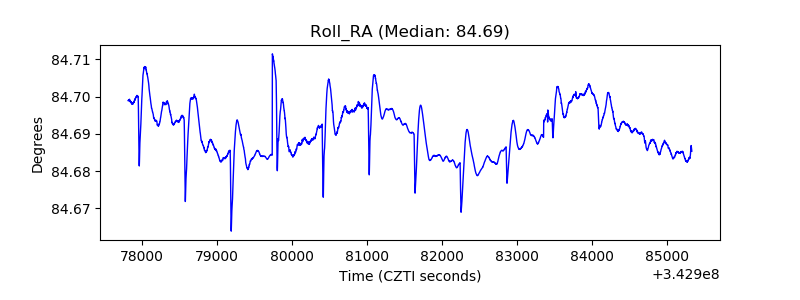 |
| Veto Counter |  |