| Param | Original file | Final file |
|---|---|---|
| Filename | modeM0/AS1T03_263T01_9000003990_27733cztM0_level2.evt | modeM0/AS1T03_263T01_9000003990_27733cztM0_level2_quad_clean.evt |
| Size (bytes) | 478,368,000 | 140,088,960 |
| Size | 456.2 MB | 133.6 MB |
| Events in quadrant A | 3,886,367 | 977,219 |
| Events in quadrant B | 3,467,948 | 998,945 |
| Events in quadrant C | 3,355,828 | 961,088 |
| Events in quadrant D | 3,392,731 | 909,386 |
| Mode M0 | |||
|---|---|---|---|
| Quadrant | BADHDUFLAG | Total packets | Discarded packets |
| A | 0 | 15912 | 0 |
| B | 0 | 14064 | 0 |
| C | 0 | 13642 | 0 |
| D | 0 | 13618 | 0 |
| Mode M9 | |||
|---|---|---|---|
| Quadrant | BADHDUFLAG | Total packets | Discarded packets |
| A | 0 | 13 | 0 |
| B | 0 | 13 | 0 |
| C | 0 | 13 | 0 |
| D | 0 | 13 | 0 |
| Quadrant | Total seconds | Saturated seconds | Saturation percentage |
|---|---|---|---|
| A | 5670 | 62 | 1.093474% |
| B | 5671 | 104 | 1.833892% |
| C | 5671 | 97 | 1.710457% |
| D | 5671 | 66 | 1.163816% |
Noise dominated data is calculated using 1-second bins in cleaned event files. If a bin has >2000 counts, and if more than 50% of those come from <1% of pixels, then it is considered to be noise-dominated and hence unusable.
| Quadrant | # 1 sec bins | Bins with >0 counts | Bins with >2000 counts | High rate bins dominated by noise | Noise dominated (total time) | Noise dominated (detector-on time) | Marked lightcurve |
|---|---|---|---|---|---|---|---|
| A | 6985 | 5670 | 5 | 5 | 0.07% | 0.09% | 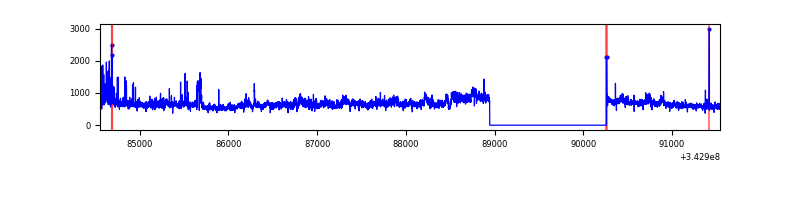 |
| B | 6986 | 5671 | 18 | 18 | 0.26% | 0.32% | 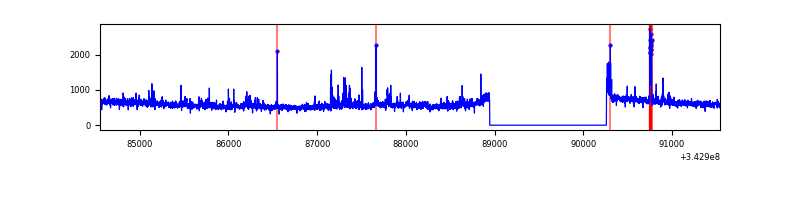 |
| C | 6986 | 5671 | 0 | 0 | 0.00% | 0.00% | 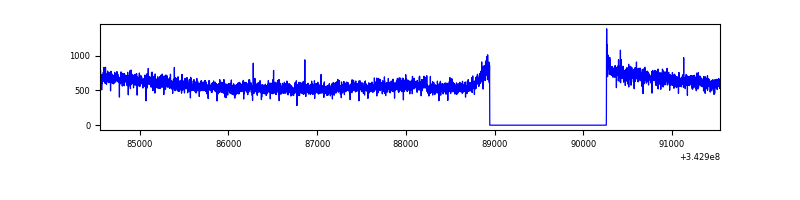 |
| D | 6986 | 5672 | 32 | 32 | 0.46% | 0.56% | 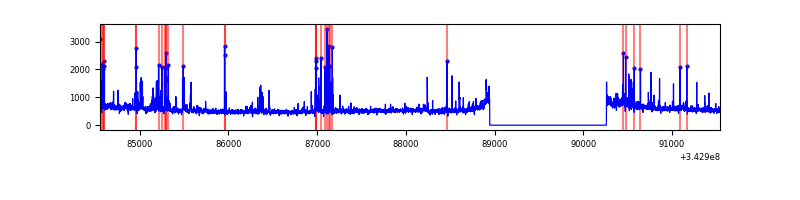 |
Top three noisy pixels from each quadrant. If the there are fewer than three noisy pixels in the level2.evt file, extra rows are filled as -1
| Pixel properties | Quadrant properties | ||||||
|---|---|---|---|---|---|---|---|
| Quadrant | DetID | PixID | Counts | Sigma | Mean | Median | Sigma |
| A | 6 | 16 | 586751 | 3121.95 | 834 | 819 | 187.7 |
| A | 0 | 13 | 76907 | 405.41 | 834 | 819 | 187.7 |
| A | 13 | 254 | 9978 | 48.8 | 834 | 819 | 187.7 |
| B | 4 | 171 | 65933 | 370.64 | 839 | 824 | 175.7 |
| B | 5 | 255 | 63412 | 356.29 | 839 | 824 | 175.7 |
| B | 0 | 230 | 41264 | 230.21 | 839 | 824 | 175.7 |
| C | 14 | 238 | 136430 | 655.64 | 818 | 829 | 206.8 |
| C | 3 | 233 | 29892 | 140.52 | 818 | 829 | 206.8 |
| C | 13 | 61 | 5473 | 22.45 | 818 | 829 | 206.8 |
| D | 1 | 52 | 156537 | 737.93 | 806 | 785 | 211.1 |
| D | 11 | 176 | 142905 | 673.34 | 806 | 785 | 211.1 |
| D | 2 | 250 | 28862 | 133.02 | 806 | 785 | 211.1 |
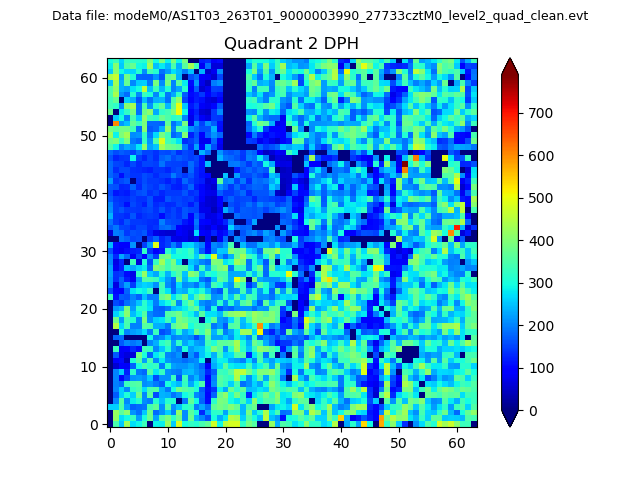
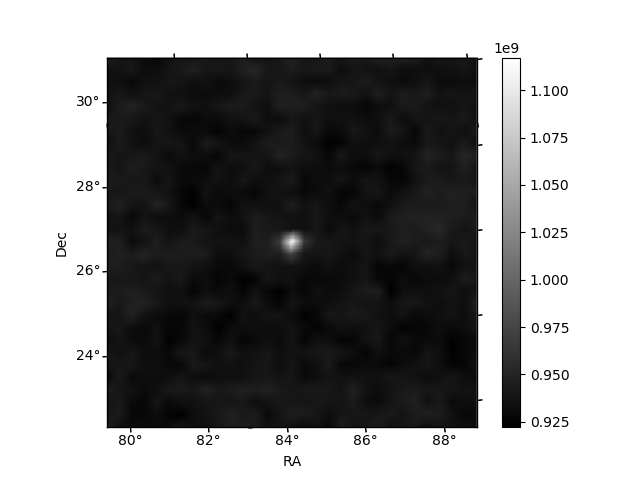
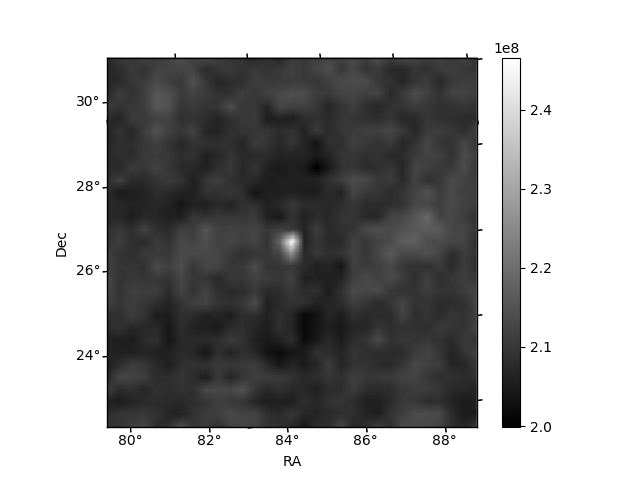
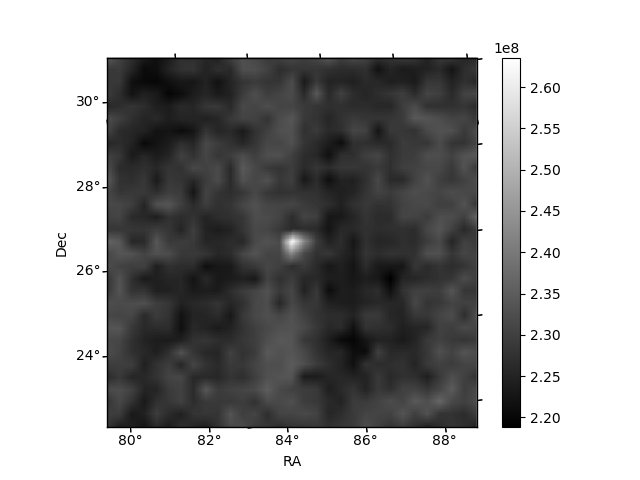
Histogram calculated using DETX and DETY for each event in the final _common_clean file
| Quadrant A | 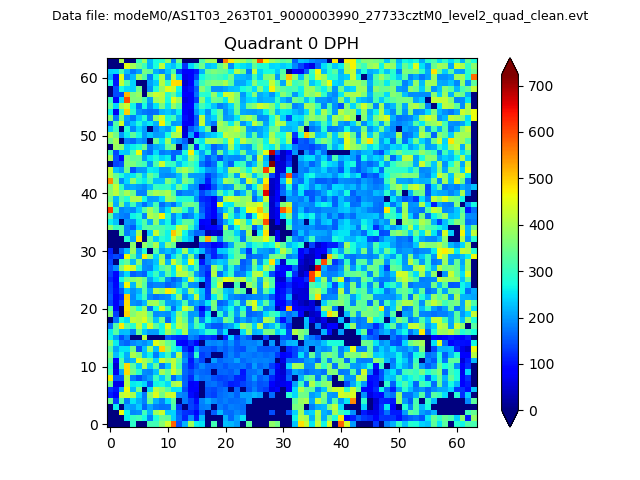 |
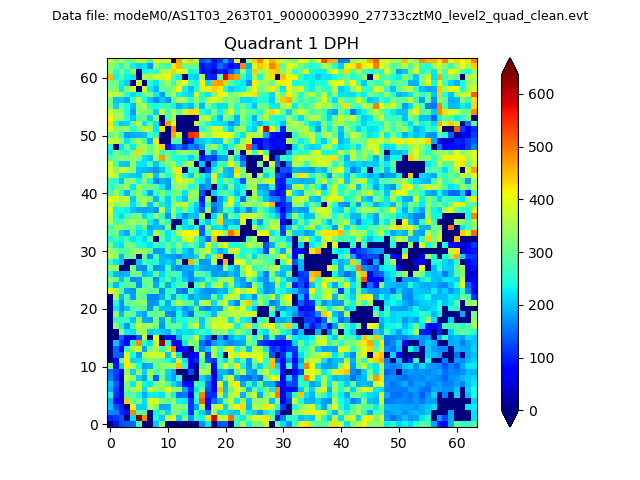 |
Quadrant B |
|---|---|---|---|
| Quadrant D | 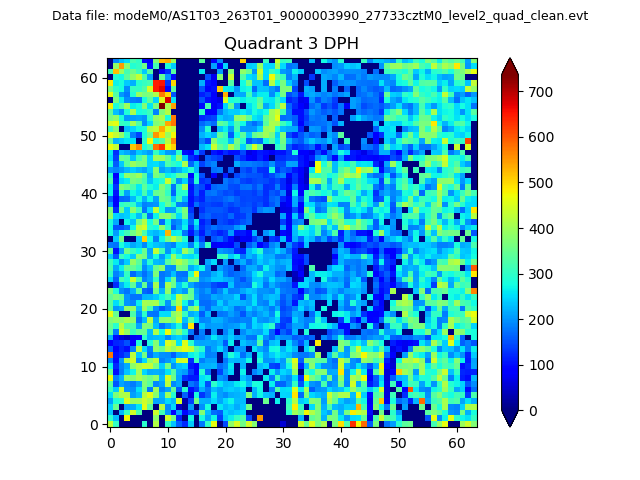 |
 |
Quadrant C |
| Plot type | Count rate plots | Images |
|---|---|---|
| Comparison with Poisson distribution Blue bars denote a histogram of data divided into 1 sec bins. Red curve is a Poisson curve with rate = median count rate of data. |
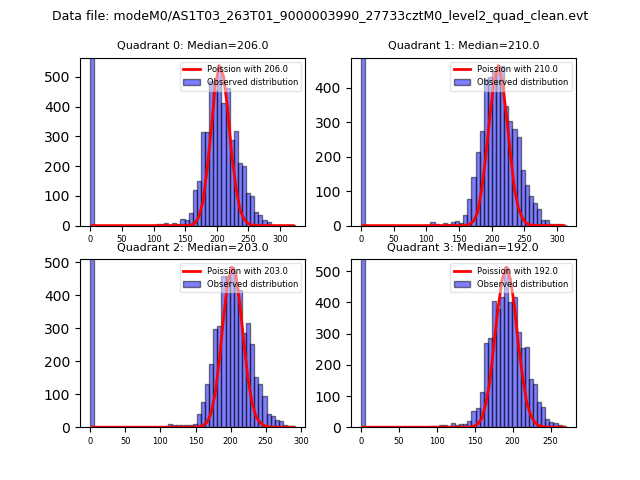 |
 |
| Quadrant-wise count rates Data is divided into 100 sec bins |
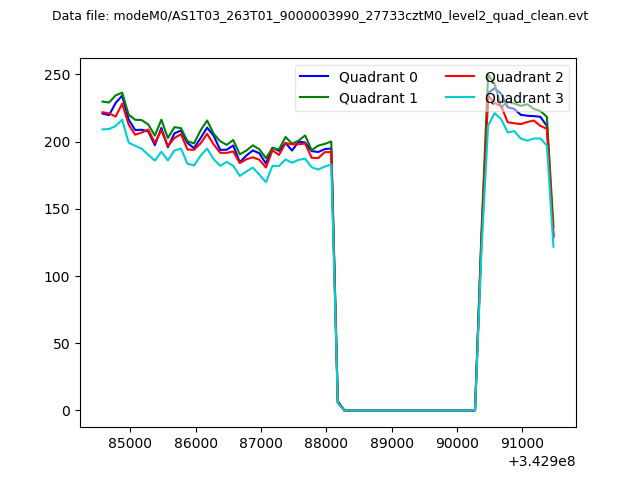 |
|
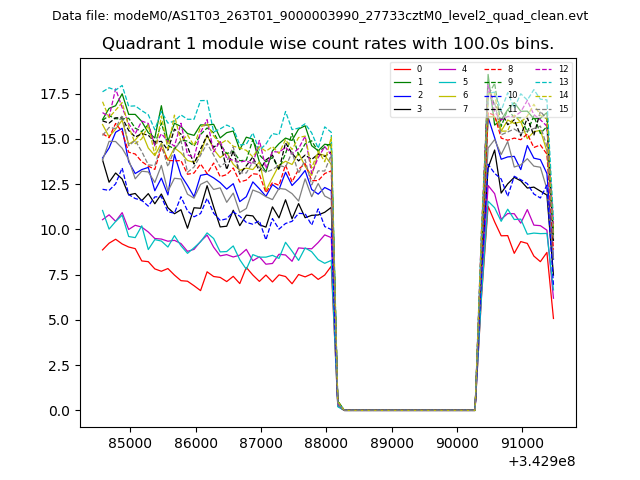
| Module-wise count rates for Quadrant A Data is divided into 100 sec bins |
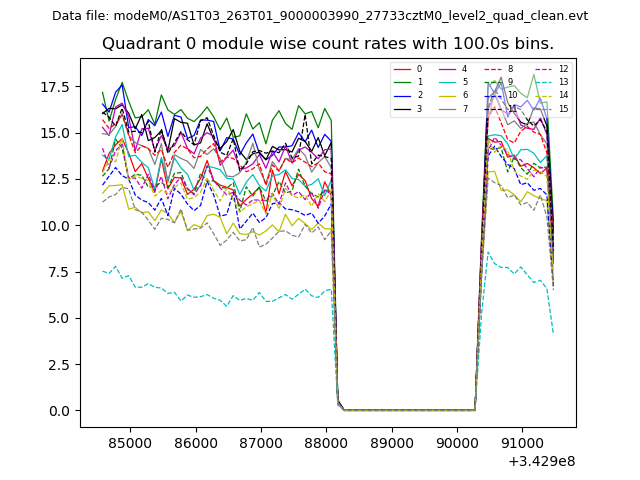 |
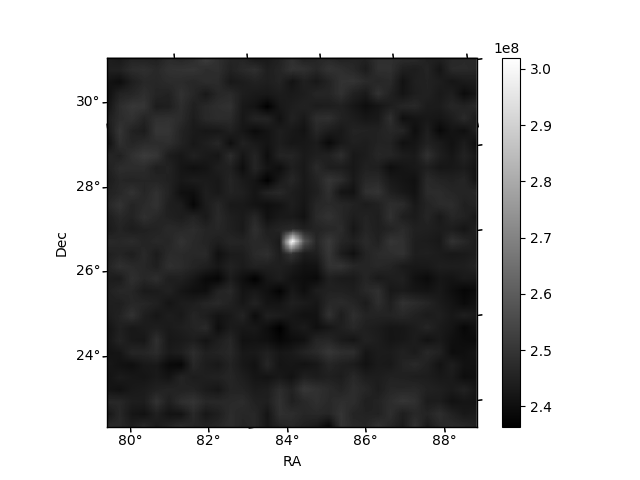 |
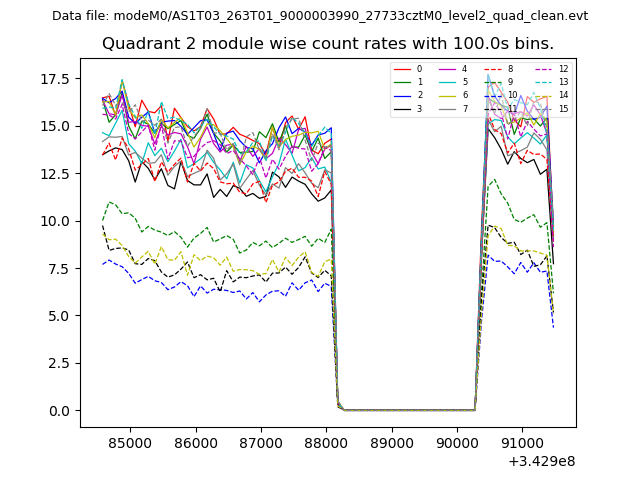
| Module-wise count rates for Quadrant B Data is divided into 100 sec bins |
 |
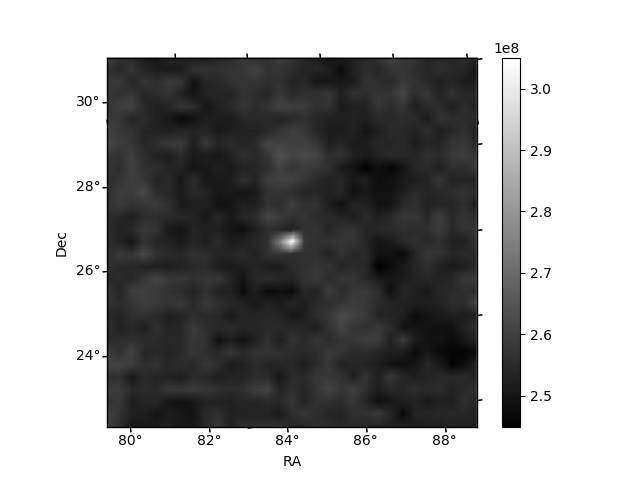 |
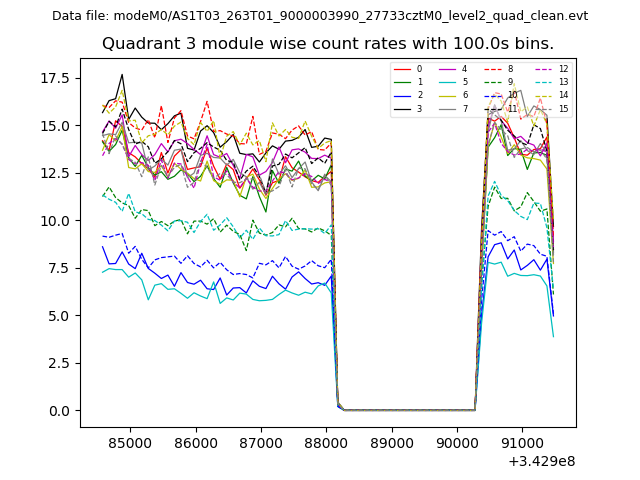
| Module-wise count rates for Quadrant C Data is divided into 100 sec bins |
 |
 |
| Module-wise count rates for Quadrant D Data is divided into 100 sec bins |
 |
 |
| Parameter | Plot |
|---|---|
| CZT HV Monitor | 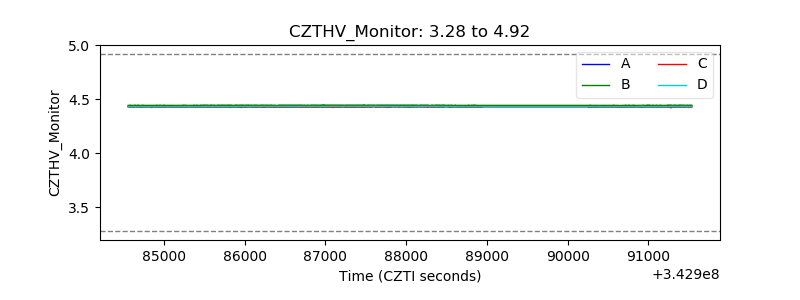 |
| D_VDD | 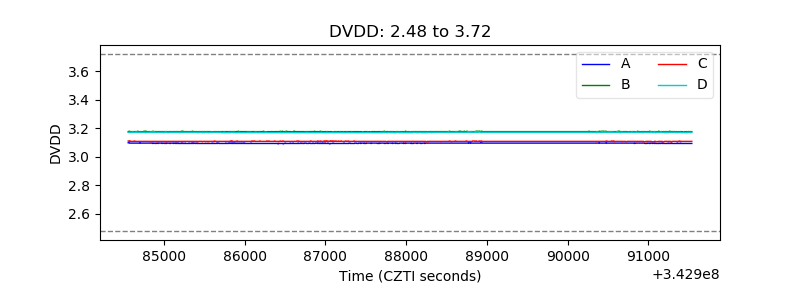 |
| Temperature 1 | 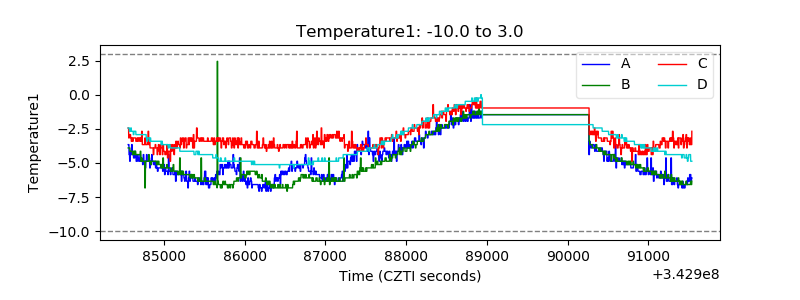 |
| Veto HV Monitor | 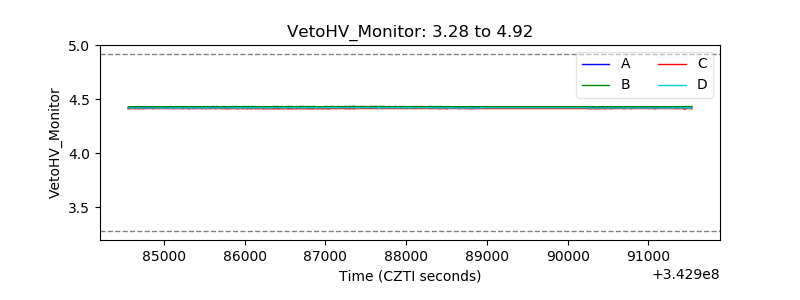 |
| Veto LLD | 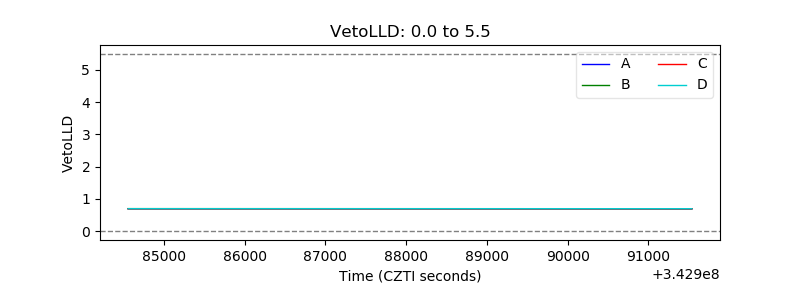 |
| Alpha Counter | 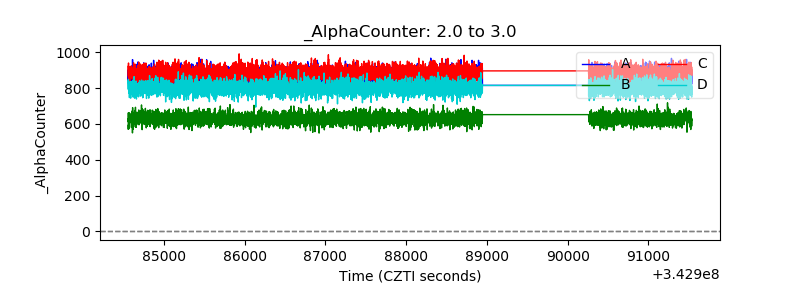 |
| _CPM_Rate | 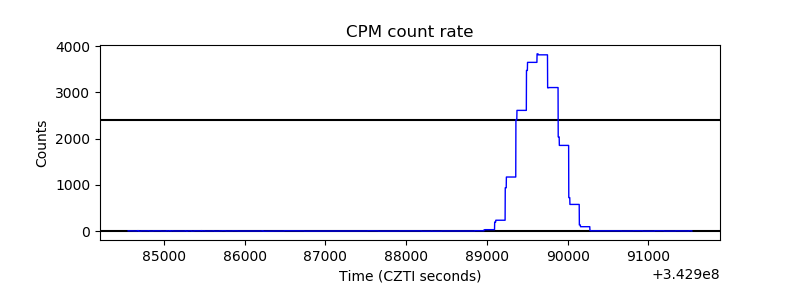 |
| CZT Counter | 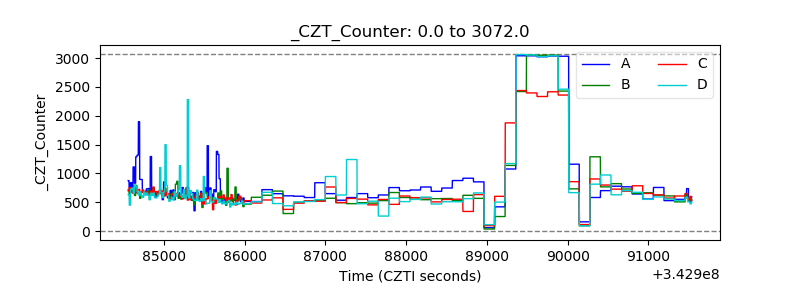 |
| +2.5 Volts monitor |  |
| +5 Volts monitor |  |
| _ROLL_ROT | 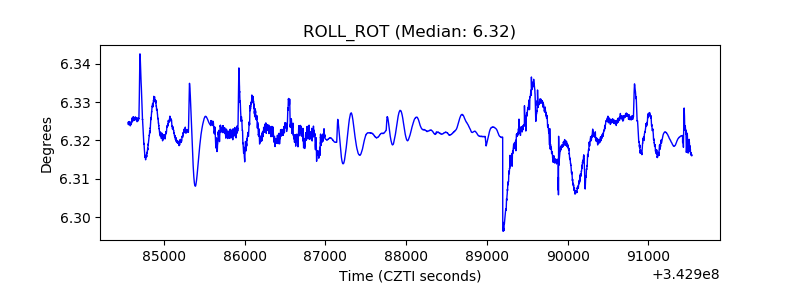 |
| _Roll_DEC | 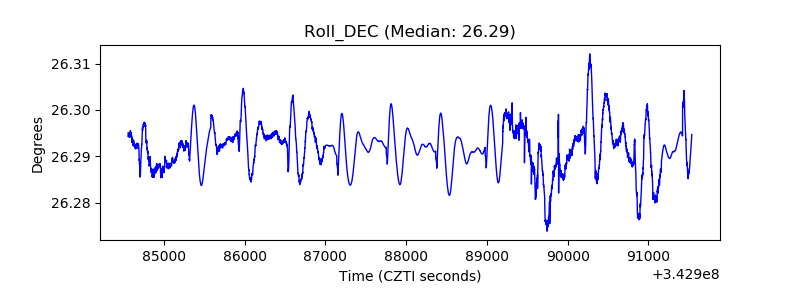 |
| _Roll_RA | 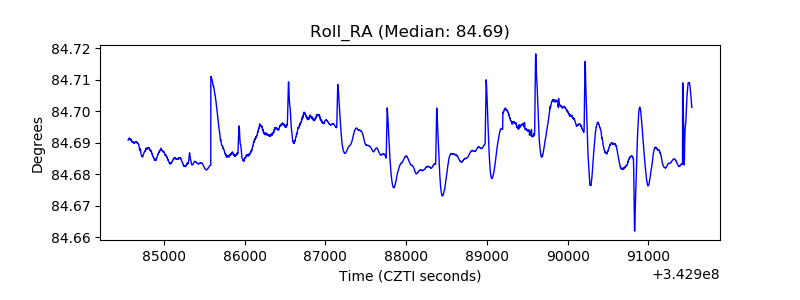 |
| Veto Counter | 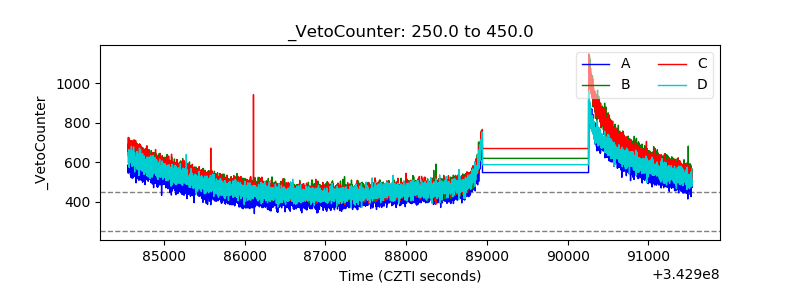 |