| Param | Original file | Final file |
|---|---|---|
| Filename | modeM0/AS1T03_263T01_9000003990_27734cztM0_level2.evt | modeM0/AS1T03_263T01_9000003990_27734cztM0_level2_quad_clean.evt |
| Size (bytes) | 516,470,400 | 147,087,360 |
| Size | 492.5 MB | 140.3 MB |
| Events in quadrant A | 3,924,614 | 1,027,553 |
| Events in quadrant B | 3,760,992 | 1,051,476 |
| Events in quadrant C | 3,738,185 | 1,001,960 |
| Events in quadrant D | 3,799,633 | 943,835 |
| Mode M0 | |||
|---|---|---|---|
| Quadrant | BADHDUFLAG | Total packets | Discarded packets |
| A | 0 | 15592 | 0 |
| B | 0 | 15135 | 0 |
| C | 0 | 15185 | 0 |
| D | 0 | 15208 | 0 |
| Mode M9 | |||
|---|---|---|---|
| Quadrant | BADHDUFLAG | Total packets | Discarded packets |
| A | 0 | 14 | 0 |
| B | 0 | 14 | 0 |
| C | 0 | 14 | 0 |
| D | 0 | 14 | 0 |
| Quadrant | Total seconds | Saturated seconds | Saturation percentage |
|---|---|---|---|
| A | 6173 | 83 | 1.344565% |
| B | 6174 | 110 | 1.781665% |
| C | 6174 | 159 | 2.575316% |
| D | 6174 | 113 | 1.830256% |
Noise dominated data is calculated using 1-second bins in cleaned event files. If a bin has >2000 counts, and if more than 50% of those come from <1% of pixels, then it is considered to be noise-dominated and hence unusable.
| Quadrant | # 1 sec bins | Bins with >0 counts | Bins with >2000 counts | High rate bins dominated by noise | Noise dominated (total time) | Noise dominated (detector-on time) | Marked lightcurve |
|---|---|---|---|---|---|---|---|
| A | 7503 | 6174 | 3 | 3 | 0.04% | 0.05% | 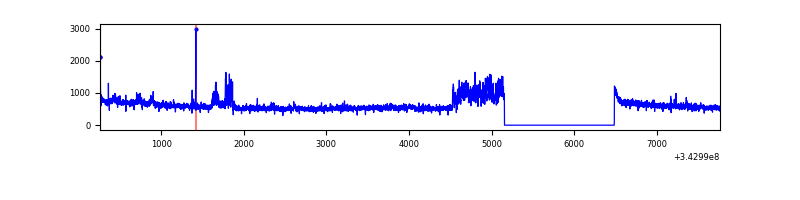 |
| B | 7504 | 6174 | 18 | 18 | 0.24% | 0.29% | 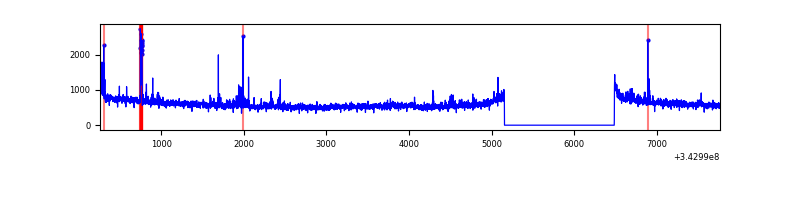 |
| C | 7504 | 6174 | 0 | 0 | 0.00% | 0.00% | 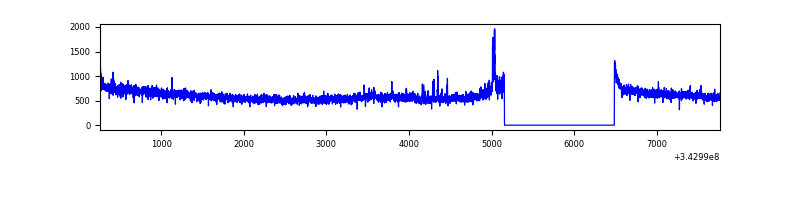 |
| D | 7504 | 6175 | 78 | 78 | 1.04% | 1.26% | 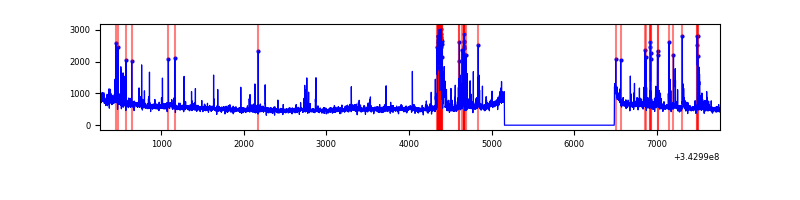 |
Top three noisy pixels from each quadrant. If the there are fewer than three noisy pixels in the level2.evt file, extra rows are filled as -1
| Pixel properties | Quadrant properties | ||||||
|---|---|---|---|---|---|---|---|
| Quadrant | DetID | PixID | Counts | Sigma | Mean | Median | Sigma |
| A | 6 | 16 | 395440 | 1953.71 | 912 | 897 | 201.9 |
| A | 0 | 13 | 9952 | 44.84 | 912 | 897 | 201.9 |
| A | 13 | 254 | 9735 | 43.76 | 912 | 897 | 201.9 |
| B | 5 | 255 | 44756 | 230.66 | 922 | 907 | 190.1 |
| B | 0 | 230 | 40898 | 210.37 | 922 | 907 | 190.1 |
| B | 4 | 171 | 38616 | 198.36 | 922 | 907 | 190.1 |
| C | 14 | 238 | 148952 | 664.64 | 889 | 897 | 222.8 |
| C | 3 | 233 | 119723 | 533.42 | 889 | 897 | 222.8 |
| C | 15 | 208 | 6193 | 23.77 | 889 | 897 | 222.8 |
| D | 11 | 176 | 239234 | 1047.36 | 876 | 853 | 227.6 |
| D | 2 | 250 | 116428 | 507.79 | 876 | 853 | 227.6 |
| D | 1 | 52 | 98848 | 430.55 | 876 | 853 | 227.6 |
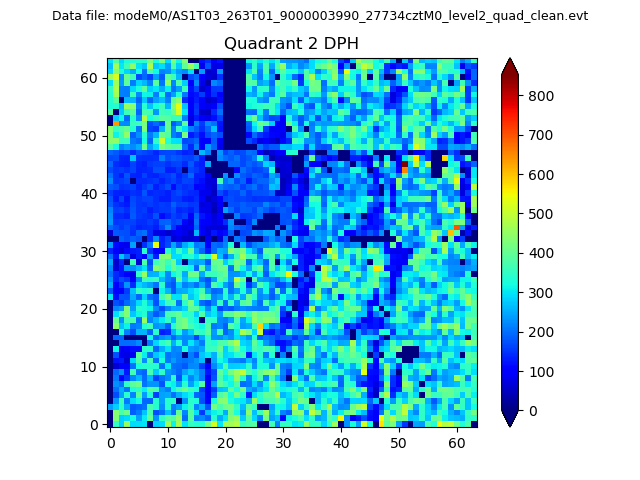
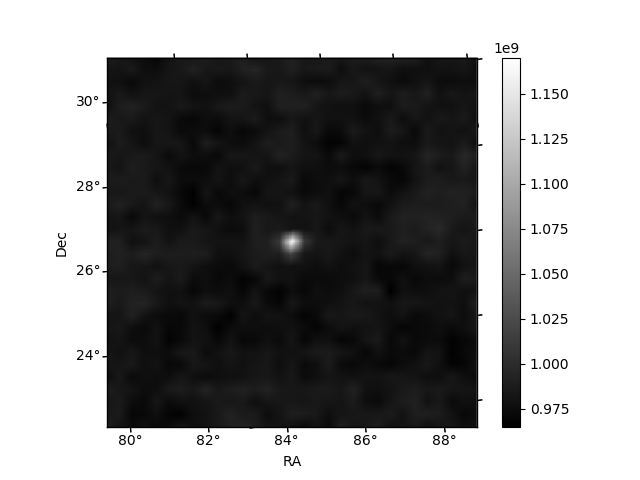
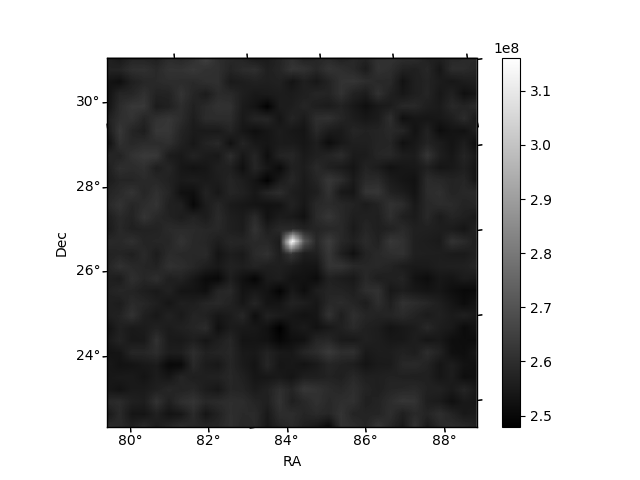
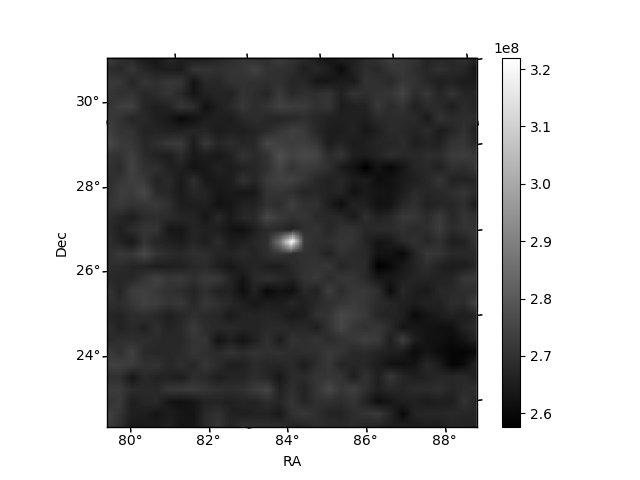
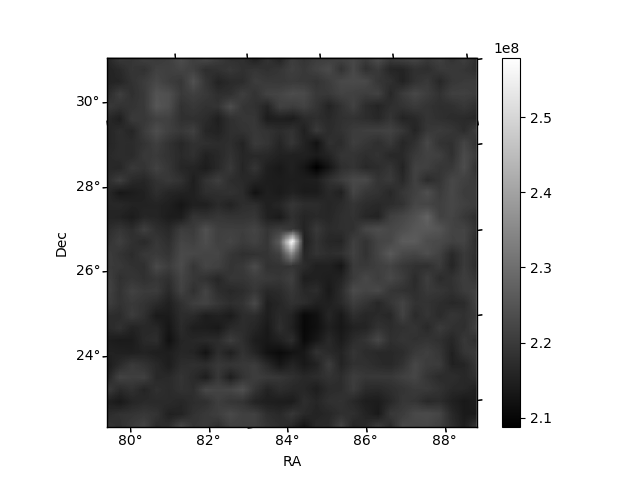
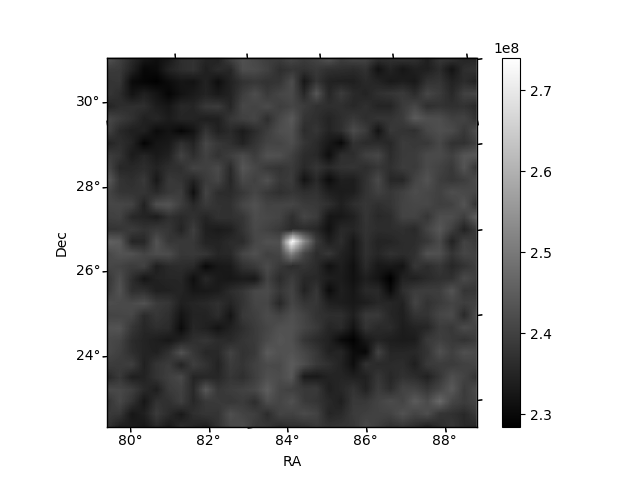
Histogram calculated using DETX and DETY for each event in the final _common_clean file
| Quadrant A | 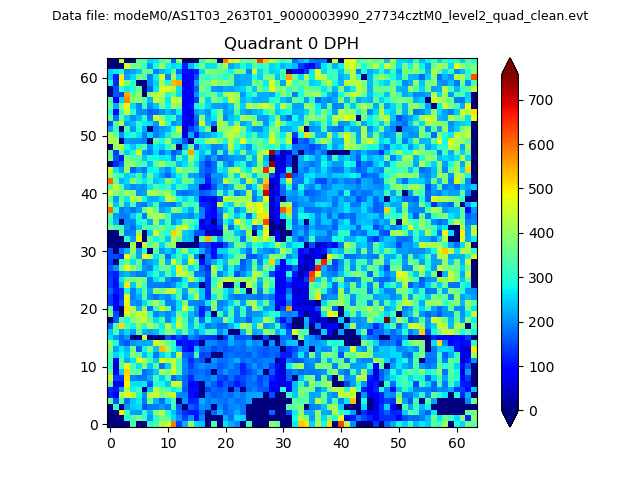 |
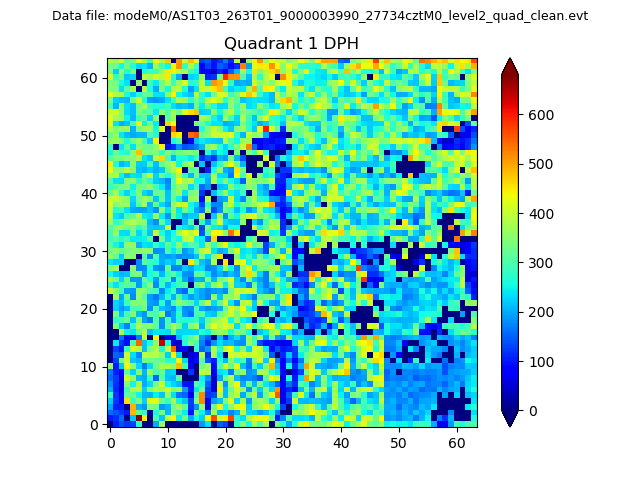 |
Quadrant B |
|---|---|---|---|
| Quadrant D | 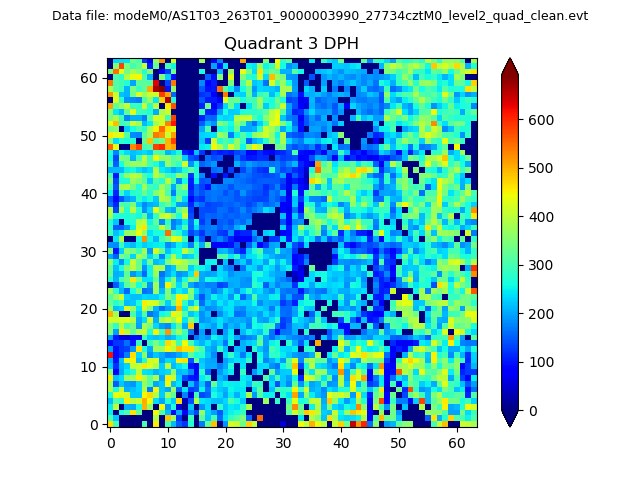 |
 |
Quadrant C |
| Plot type | Count rate plots | Images |
|---|---|---|
| Comparison with Poisson distribution Blue bars denote a histogram of data divided into 1 sec bins. Red curve is a Poisson curve with rate = median count rate of data. |
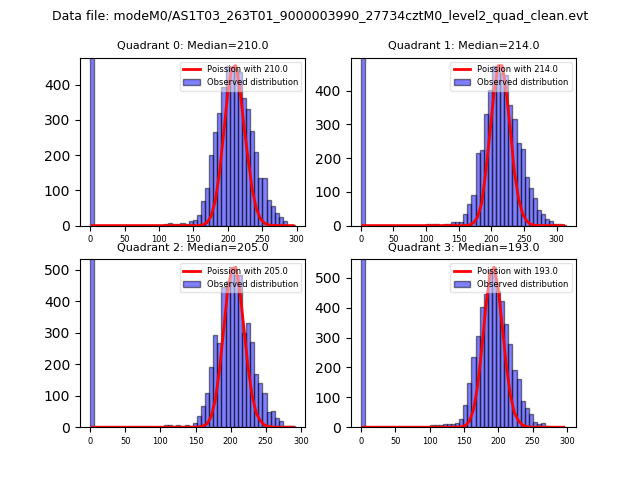 |
 |
| Quadrant-wise count rates Data is divided into 100 sec bins |
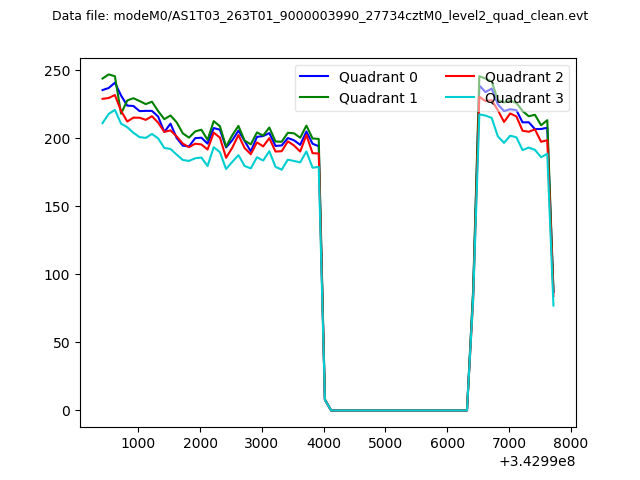 |
|
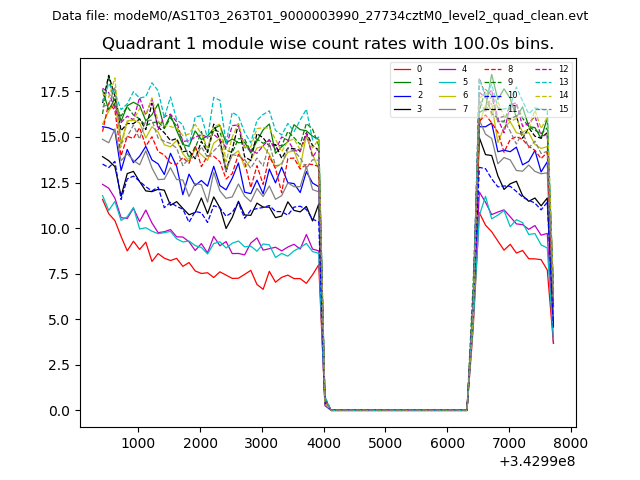
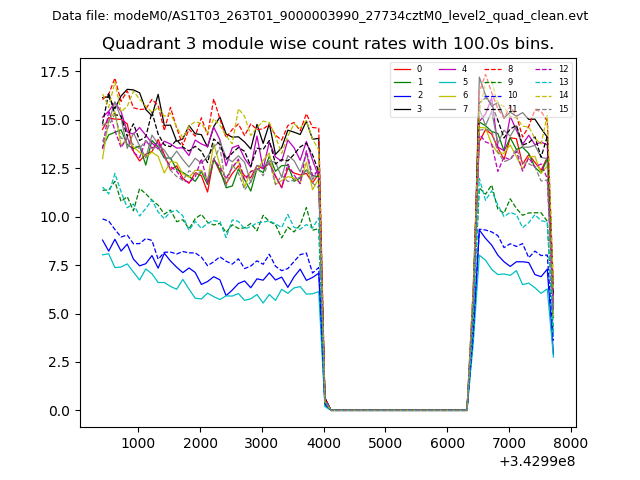
| Module-wise count rates for Quadrant A Data is divided into 100 sec bins |
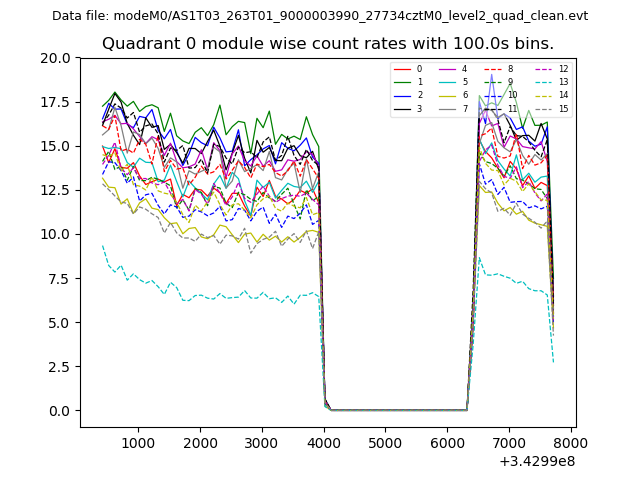 |
 |
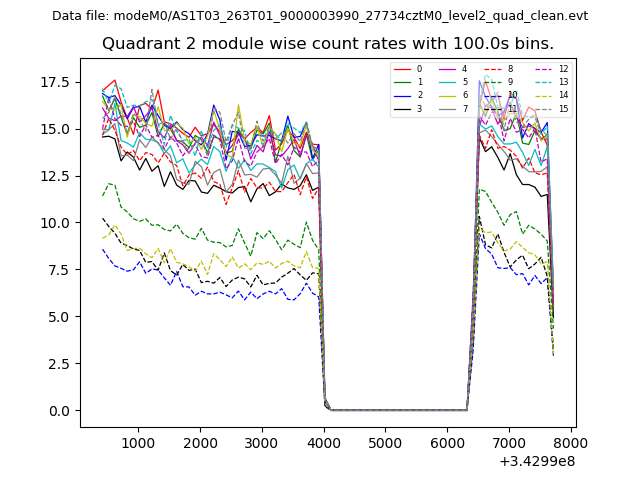
| Module-wise count rates for Quadrant B Data is divided into 100 sec bins |
 |
 |
| Module-wise count rates for Quadrant C Data is divided into 100 sec bins |
 |
 |
| Module-wise count rates for Quadrant D Data is divided into 100 sec bins |
 |
 |
| Parameter | Plot |
|---|---|
| CZT HV Monitor |  |
| D_VDD | 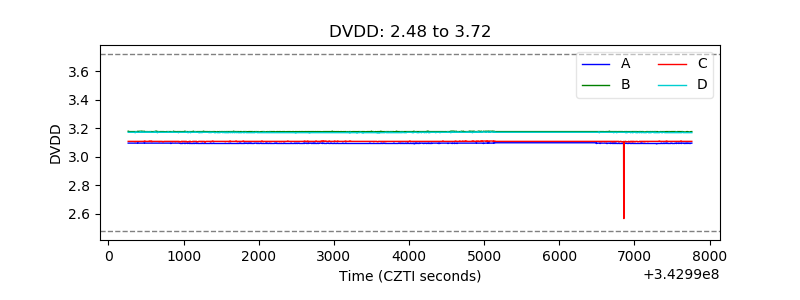 |
| Temperature 1 | 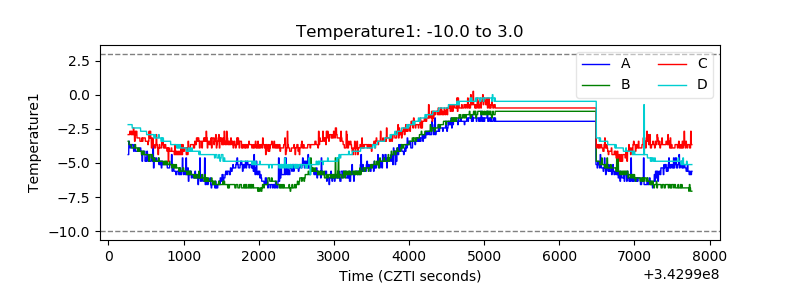 |
| Veto HV Monitor | 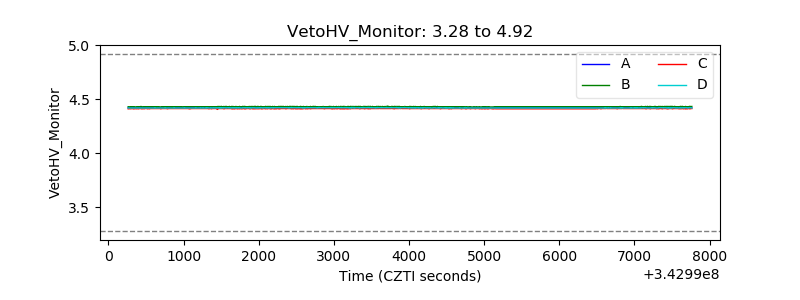 |
| Veto LLD | 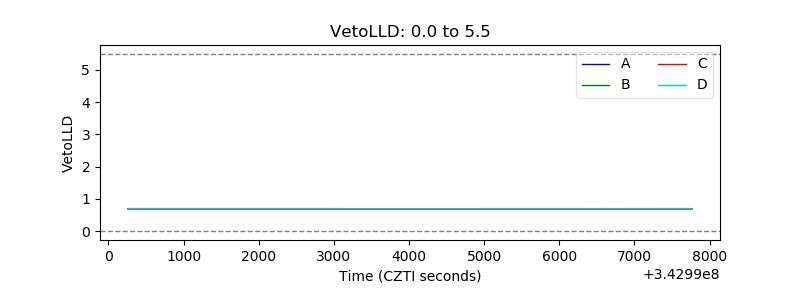 |
| Alpha Counter | 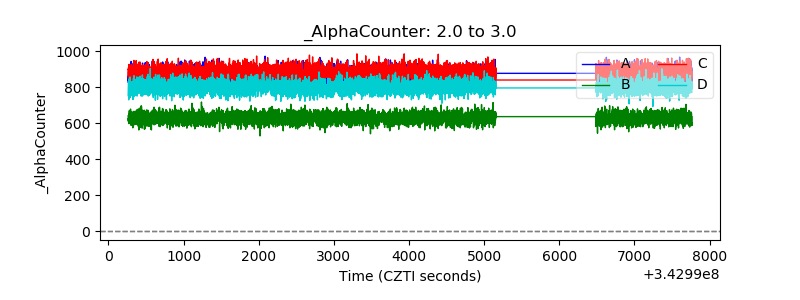 |
| _CPM_Rate | 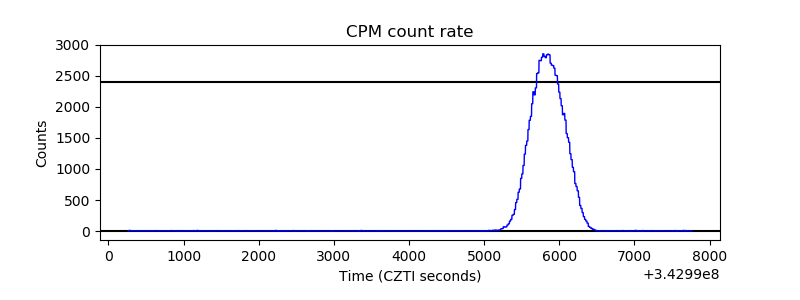 |
| CZT Counter | 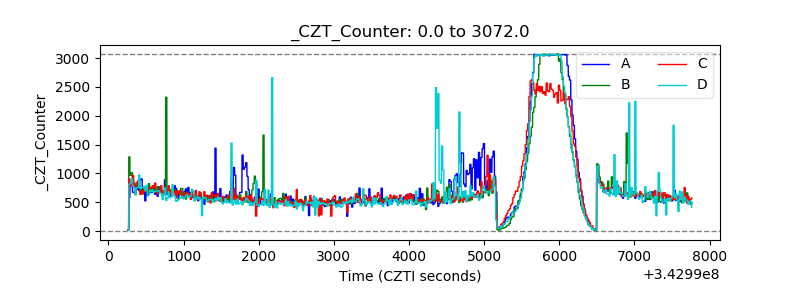 |
| +2.5 Volts monitor | 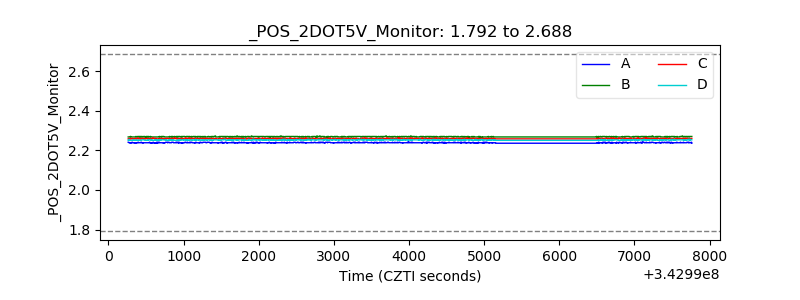 |
| +5 Volts monitor |  |
| _ROLL_ROT | 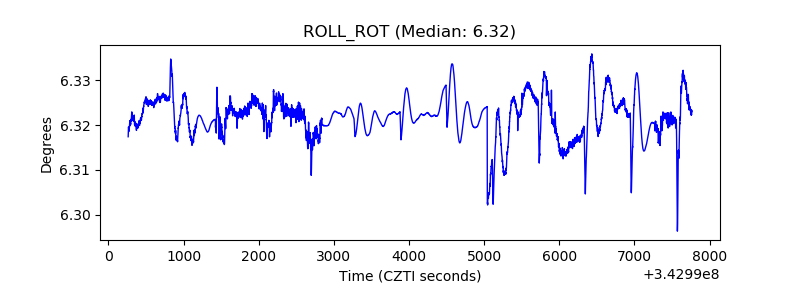 |
| _Roll_DEC | 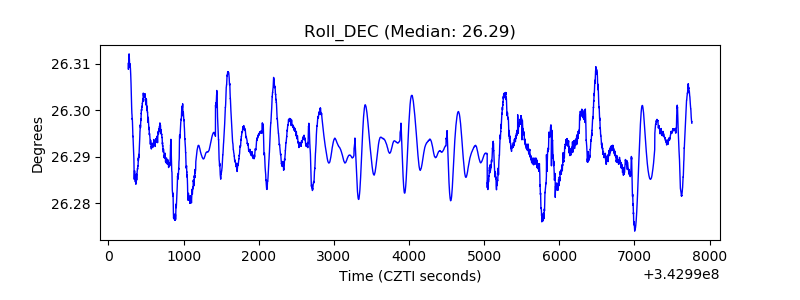 |
| _Roll_RA | 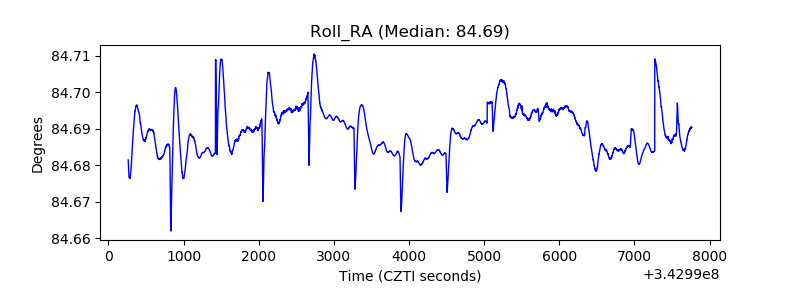 |
| Veto Counter | 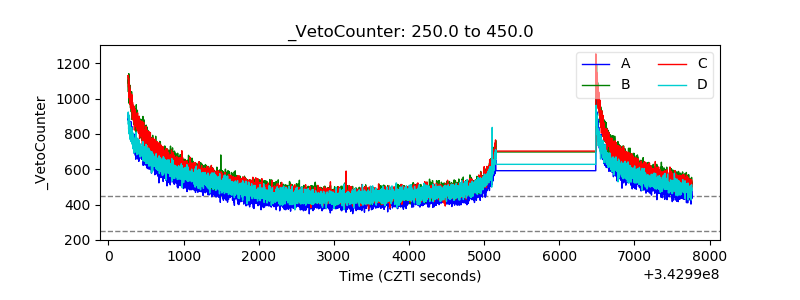 |