| Param | Original file | Final file |
|---|---|---|
| Filename | modeM0/AS1T03_263T01_9000003990_27735cztM0_level2.evt | modeM0/AS1T03_263T01_9000003990_27735cztM0_level2_quad_clean.evt |
| Size (bytes) | 466,810,560 | 123,220,800 |
| Size | 445.2 MB | 117.5 MB |
| Events in quadrant A | 3,190,354 | 850,493 |
| Events in quadrant B | 3,580,296 | 871,321 |
| Events in quadrant C | 3,552,456 | 825,787 |
| Events in quadrant D | 3,420,583 | 779,181 |
| Mode M0 | |||
|---|---|---|---|
| Quadrant | BADHDUFLAG | Total packets | Discarded packets |
| A | 0 | 12810 | 0 |
| B | 0 | 14168 | 0 |
| C | 0 | 14281 | 0 |
| D | 0 | 13688 | 0 |
| Mode M9 | |||
|---|---|---|---|
| Quadrant | BADHDUFLAG | Total packets | Discarded packets |
| A | 0 | 13 | 0 |
| B | 0 | 13 | 0 |
| C | 0 | 13 | 0 |
| D | 0 | 13 | 0 |
| Quadrant | Total seconds | Saturated seconds | Saturation percentage |
|---|---|---|---|
| A | 5799 | 43 | 0.741507% |
| B | 5800 | 211 | 3.637931% |
| C | 5800 | 114 | 1.965517% |
| D | 5800 | 95 | 1.637931% |
Noise dominated data is calculated using 1-second bins in cleaned event files. If a bin has >2000 counts, and if more than 50% of those come from <1% of pixels, then it is considered to be noise-dominated and hence unusable.
| Quadrant | # 1 sec bins | Bins with >0 counts | Bins with >2000 counts | High rate bins dominated by noise | Noise dominated (total time) | Noise dominated (detector-on time) | Marked lightcurve |
|---|---|---|---|---|---|---|---|
| A | 7074 | 5800 | 3 | 3 | 0.04% | 0.05% | 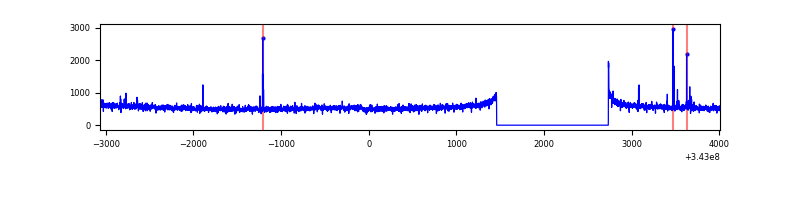 |
| B | 7075 | 5800 | 31 | 31 | 0.44% | 0.53% | 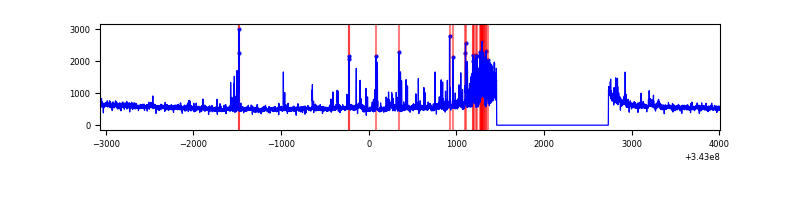 |
| C | 7075 | 5800 | 2 | 2 | 0.03% | 0.03% | 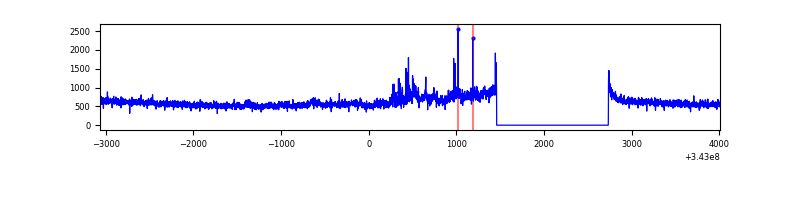 |
| D | 7075 | 5801 | 49 | 49 | 0.69% | 0.84% | 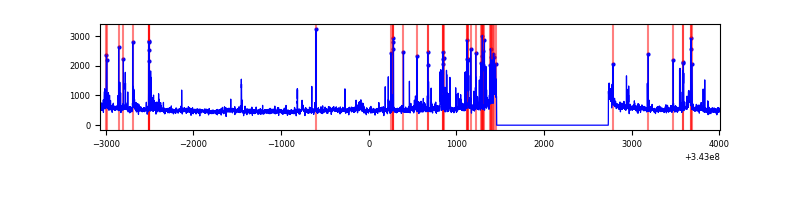 |
Top three noisy pixels from each quadrant. If the there are fewer than three noisy pixels in the level2.evt file, extra rows are filled as -1
| Pixel properties | Quadrant properties | ||||||
|---|---|---|---|---|---|---|---|
| Quadrant | DetID | PixID | Counts | Sigma | Mean | Median | Sigma |
| A | 0 | 13 | 33798 | 185.08 | 814 | 800 | 178.3 |
| A | 6 | 16 | 14657 | 77.72 | 814 | 800 | 178.3 |
| A | 13 | 254 | 9300 | 47.67 | 814 | 800 | 178.3 |
| B | 3 | 64 | 351704 | 2097.67 | 809 | 794 | 167.3 |
| B | 5 | 255 | 27971 | 162.46 | 809 | 794 | 167.3 |
| B | 0 | 230 | 18901 | 108.24 | 809 | 794 | 167.3 |
| C | 3 | 233 | 338554 | 1708.64 | 787 | 794 | 197.7 |
| C | 14 | 238 | 131509 | 661.25 | 787 | 794 | 197.7 |
| C | 15 | 208 | 12862 | 61.05 | 787 | 794 | 197.7 |
| D | 1 | 52 | 203326 | 1012.34 | 776 | 756 | 200.1 |
| D | 11 | 176 | 158321 | 787.43 | 776 | 756 | 200.1 |
| D | 2 | 250 | 99754 | 494.74 | 776 | 756 | 200.1 |
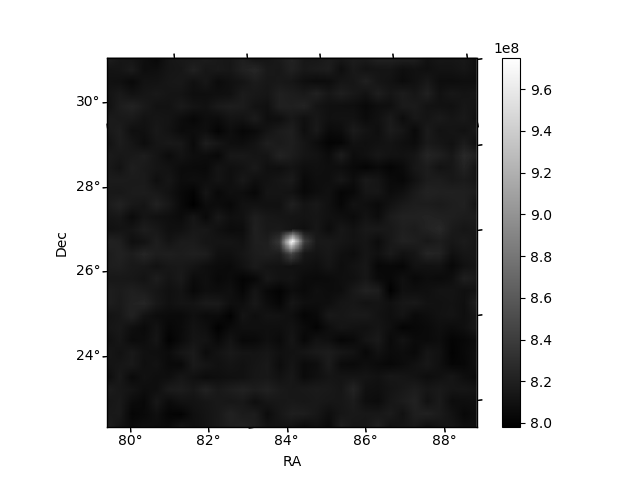
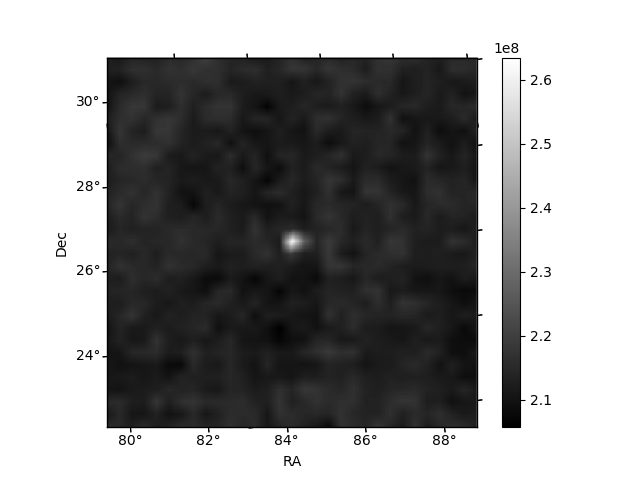
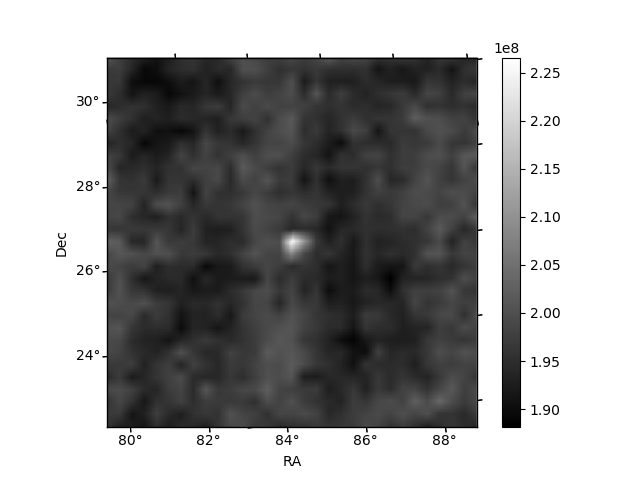
Histogram calculated using DETX and DETY for each event in the final _common_clean file
| Quadrant A | 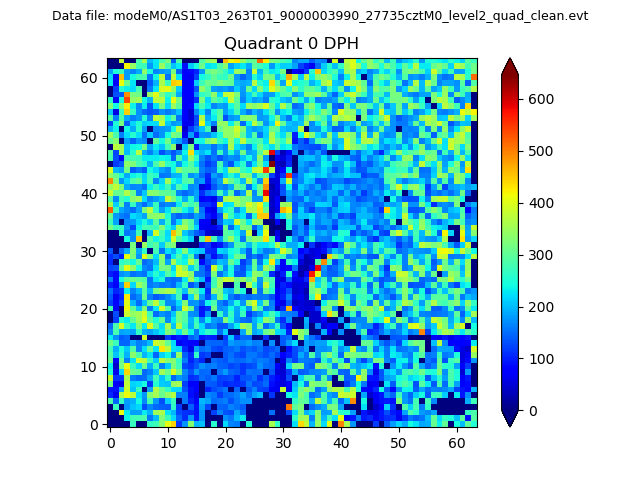 |
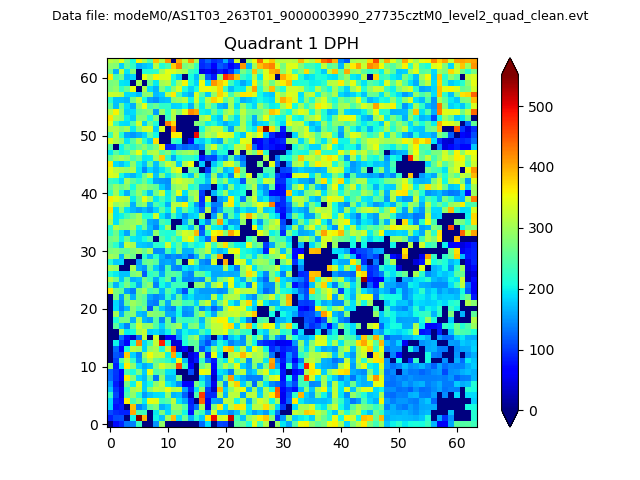 |
Quadrant B |
|---|---|---|---|
| Quadrant D |  |
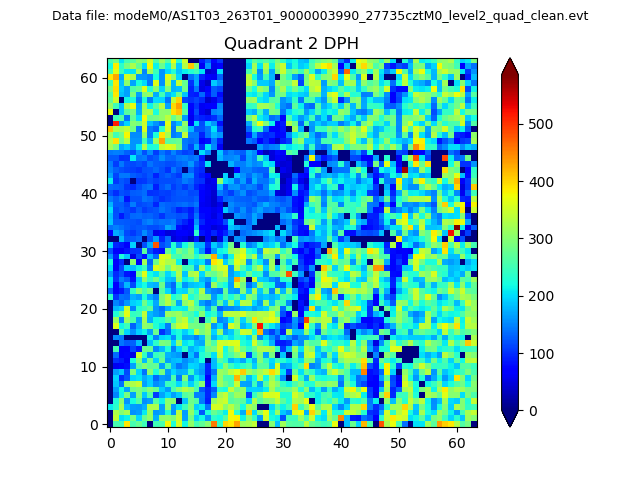 |
Quadrant C |
| Plot type | Count rate plots | Images |
|---|---|---|
| Comparison with Poisson distribution Blue bars denote a histogram of data divided into 1 sec bins. Red curve is a Poisson curve with rate = median count rate of data. |
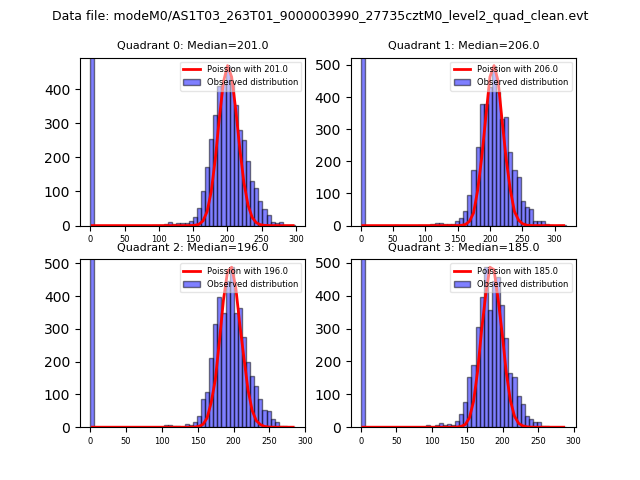 |
 |
| Quadrant-wise count rates Data is divided into 100 sec bins |
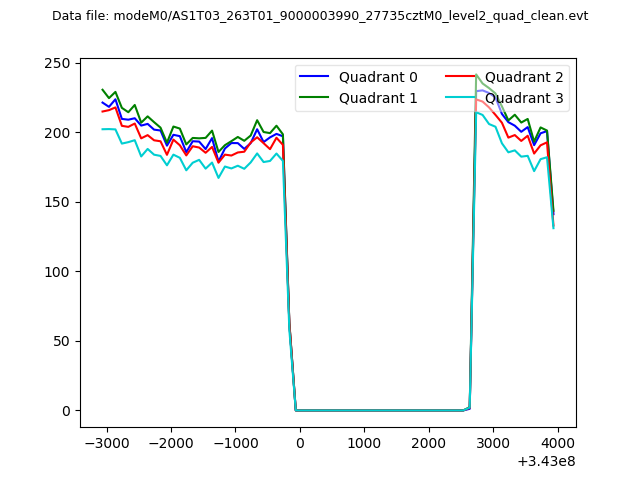 |
|
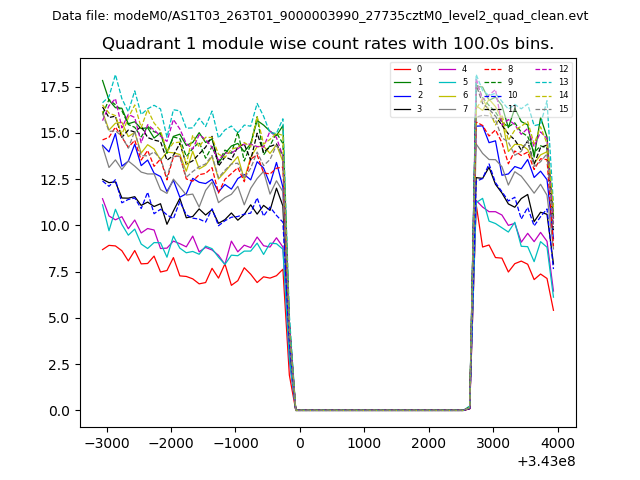
| Module-wise count rates for Quadrant A Data is divided into 100 sec bins |
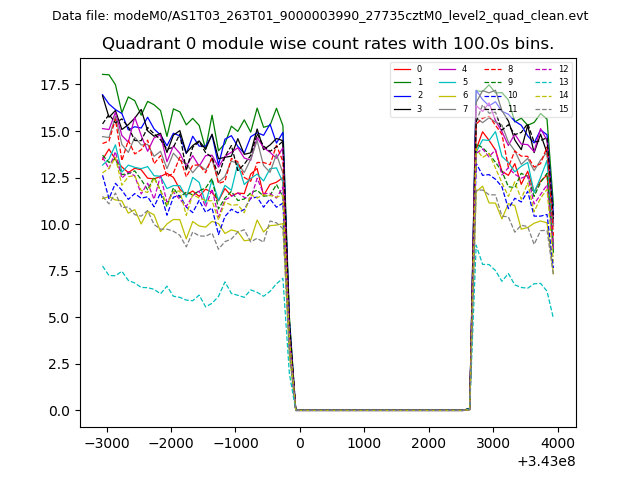 |
 |
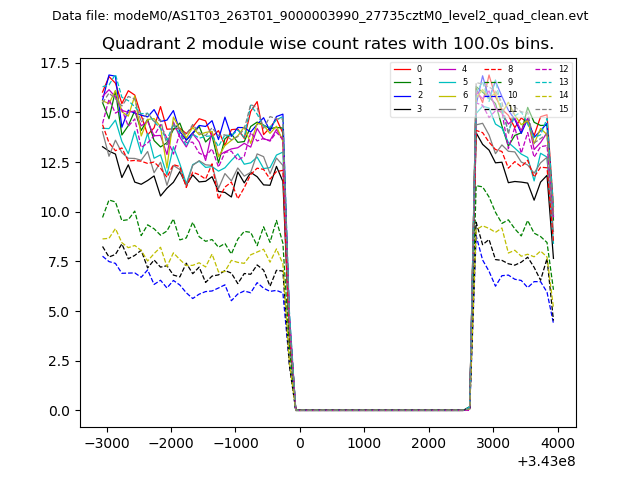
| Module-wise count rates for Quadrant B Data is divided into 100 sec bins |
 |
 |
| Module-wise count rates for Quadrant C Data is divided into 100 sec bins |
 |
 |
| Module-wise count rates for Quadrant D Data is divided into 100 sec bins |
 |
 |
| Parameter | Plot |
|---|---|
| CZT HV Monitor | 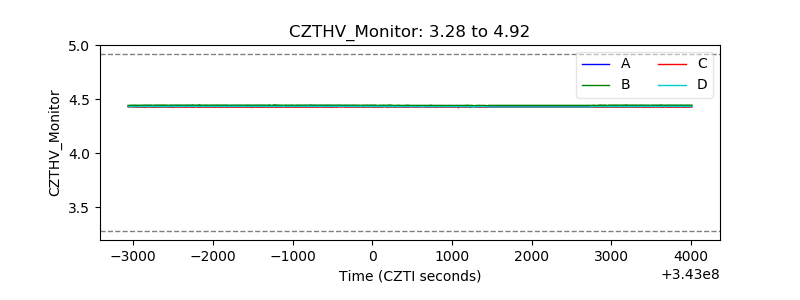 |
| D_VDD | 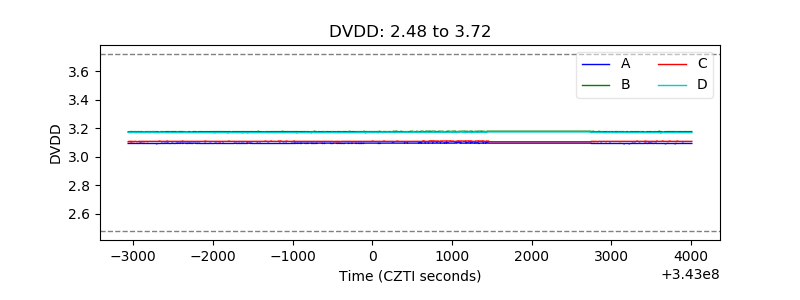 |
| Temperature 1 | 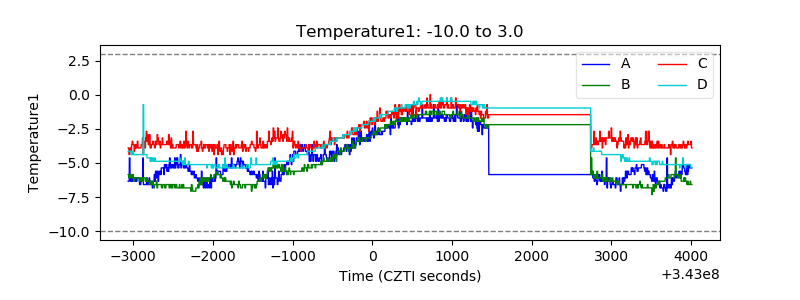 |
| Veto HV Monitor | 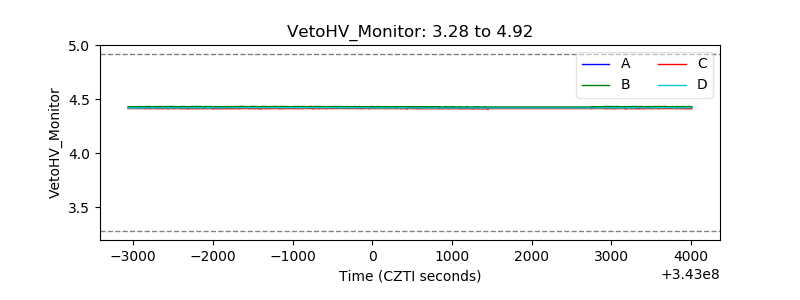 |
| Veto LLD | 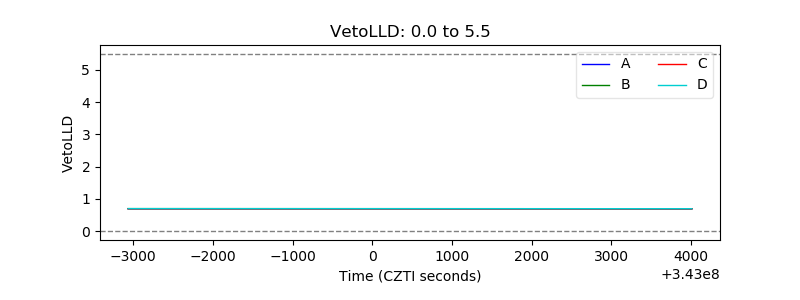 |
| Alpha Counter | 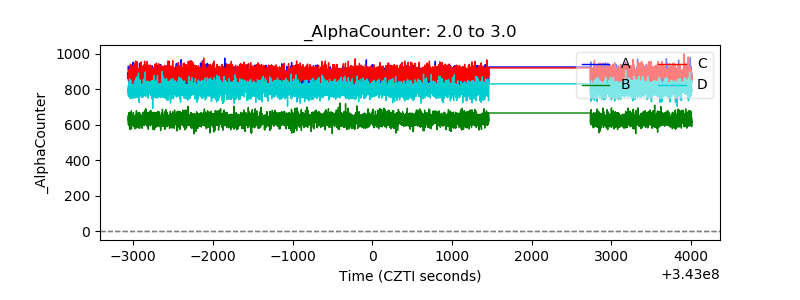 |
| _CPM_Rate | 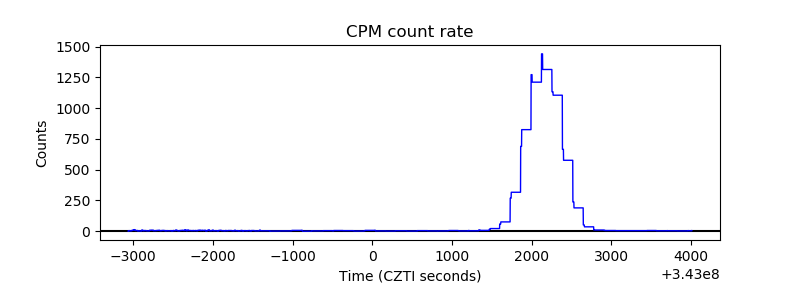 |
| CZT Counter | 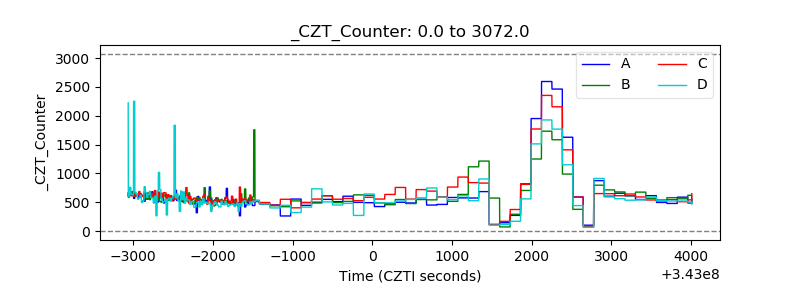 |
| +2.5 Volts monitor |  |
| +5 Volts monitor |  |
| _ROLL_ROT |  |
| _Roll_DEC | 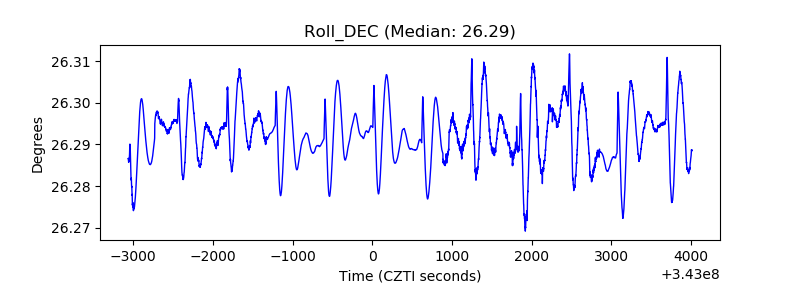 |
| _Roll_RA | 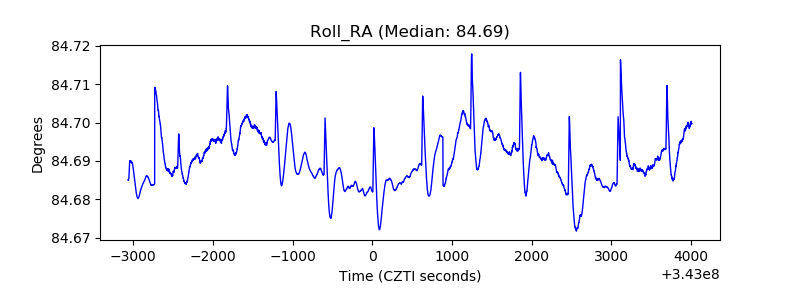 |
| Veto Counter |  |