| Param | Original file | Final file |
|---|---|---|
| Filename | modeM0/AS1T03_263T01_9000003990_27737cztM0_level2.evt | modeM0/AS1T03_263T01_9000003990_27737cztM0_level2_quad_clean.evt |
| Size (bytes) | 433,520,640 | 102,084,480 |
| Size | 413.4 MB | 97.4 MB |
| Events in quadrant A | 3,060,835 | 688,587 |
| Events in quadrant B | 3,226,681 | 698,005 |
| Events in quadrant C | 3,239,310 | 669,587 |
| Events in quadrant D | 3,211,346 | 633,347 |
| Mode M0 | |||
|---|---|---|---|
| Quadrant | BADHDUFLAG | Total packets | Discarded packets |
| A | 0 | 12449 | 0 |
| B | 0 | 13064 | 0 |
| C | 0 | 13100 | 0 |
| D | 0 | 13251 | 0 |
| Mode M9 | |||
|---|---|---|---|
| Quadrant | BADHDUFLAG | Total packets | Discarded packets |
| A | 0 | 7 | 0 |
| B | 0 | 7 | 0 |
| C | 0 | 7 | 0 |
| D | 0 | 7 | 0 |
| Quadrant | Total seconds | Saturated seconds | Saturation percentage |
|---|---|---|---|
| A | 5756 | 86 | 1.494093% |
| B | 5757 | 150 | 2.605524% |
| C | 5757 | 149 | 2.588154% |
| D | 5757 | 82 | 1.424353% |
Noise dominated data is calculated using 1-second bins in cleaned event files. If a bin has >2000 counts, and if more than 50% of those come from <1% of pixels, then it is considered to be noise-dominated and hence unusable.
| Quadrant | # 1 sec bins | Bins with >0 counts | Bins with >2000 counts | High rate bins dominated by noise | Noise dominated (total time) | Noise dominated (detector-on time) | Marked lightcurve |
|---|---|---|---|---|---|---|---|
| A | 6376 | 5756 | 1 | 1 | 0.02% | 0.02% | 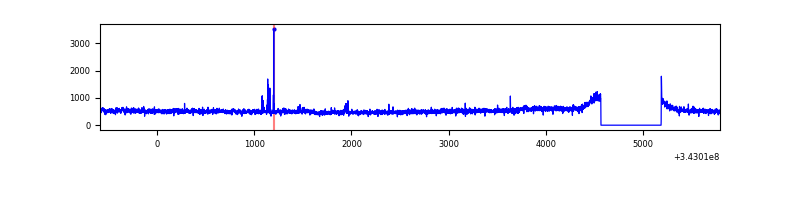 |
| B | 6377 | 5757 | 30 | 30 | 0.47% | 0.52% | 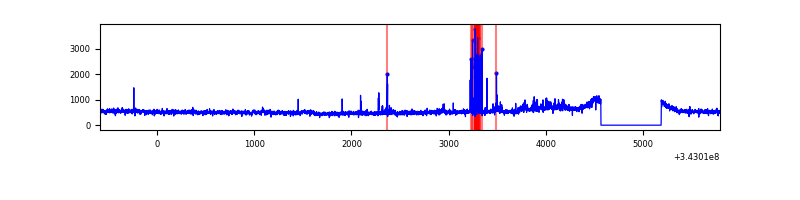 |
| C | 6377 | 5757 | 1 | 1 | 0.02% | 0.02% | 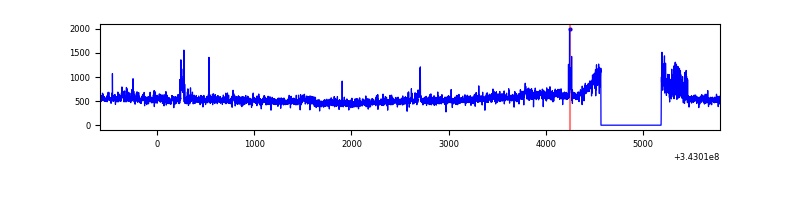 |
| D | 6377 | 5757 | 28 | 28 | 0.44% | 0.49% |  |
Top three noisy pixels from each quadrant. If the there are fewer than three noisy pixels in the level2.evt file, extra rows are filled as -1
| Pixel properties | Quadrant properties | ||||||
|---|---|---|---|---|---|---|---|
| Quadrant | DetID | PixID | Counts | Sigma | Mean | Median | Sigma |
| A | 0 | 13 | 26292 | 146.75 | 784 | 771 | 173.9 |
| A | 13 | 254 | 9477 | 50.06 | 784 | 771 | 173.9 |
| A | 6 | 16 | 7338 | 37.76 | 784 | 771 | 173.9 |
| B | 3 | 64 | 153778 | 934.71 | 778 | 763 | 163.7 |
| B | 4 | 200 | 16954 | 98.9 | 778 | 763 | 163.7 |
| B | 12 | 111 | 16862 | 98.34 | 778 | 763 | 163.7 |
| C | 3 | 233 | 175752 | 916.74 | 753 | 760 | 190.9 |
| C | 14 | 238 | 122308 | 636.76 | 753 | 760 | 190.9 |
| C | 10 | 22 | 11051 | 53.91 | 753 | 760 | 190.9 |
| D | 1 | 52 | 236650 | 1196.12 | 752 | 731 | 197.2 |
| D | 11 | 176 | 74267 | 372.83 | 752 | 731 | 197.2 |
| D | 2 | 250 | 52436 | 262.15 | 752 | 731 | 197.2 |
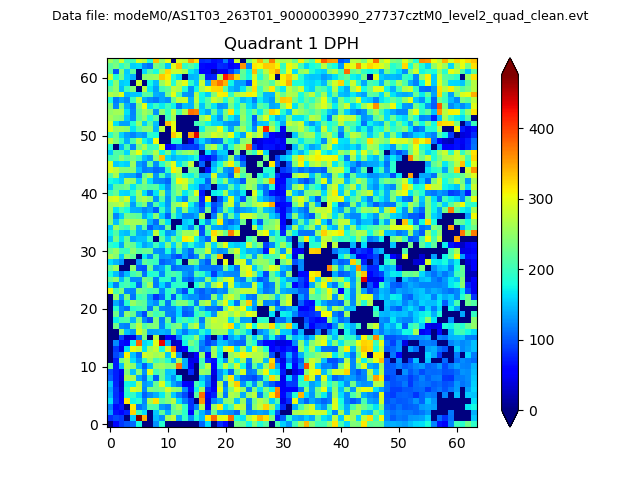
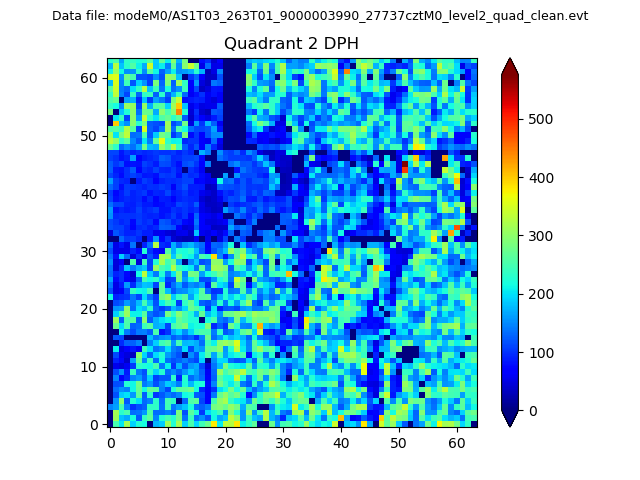
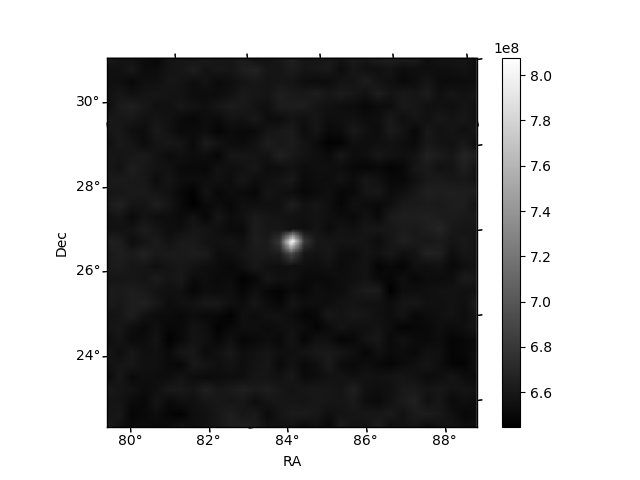
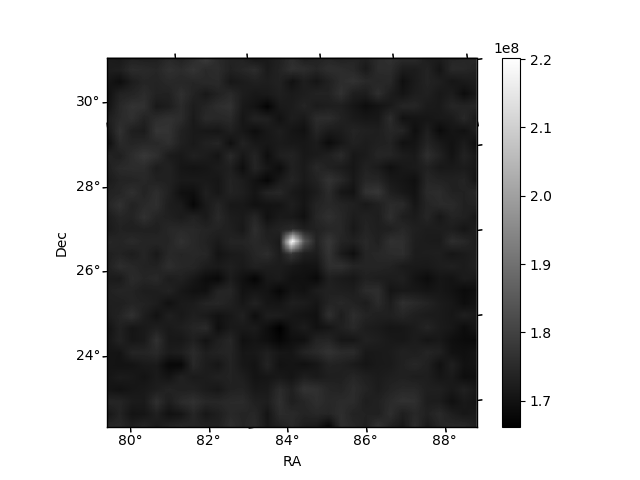
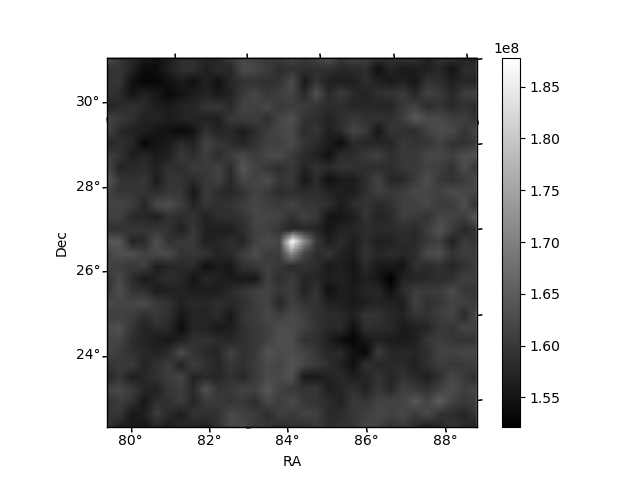
Histogram calculated using DETX and DETY for each event in the final _common_clean file
| Quadrant A | 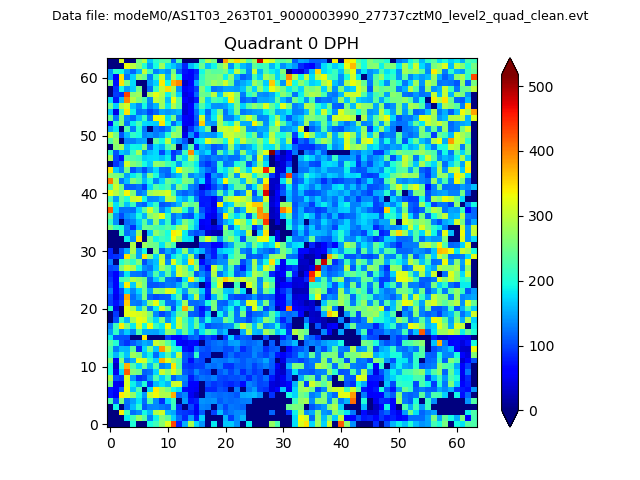 |
 |
Quadrant B |
|---|---|---|---|
| Quadrant D | 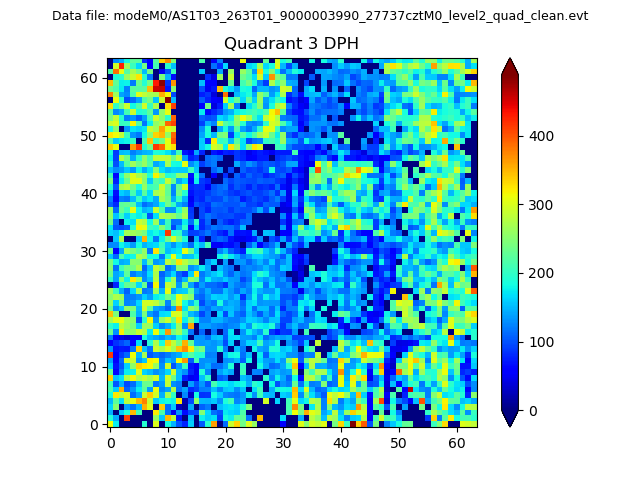 |
 |
Quadrant C |
| Plot type | Count rate plots | Images |
|---|---|---|
| Comparison with Poisson distribution Blue bars denote a histogram of data divided into 1 sec bins. Red curve is a Poisson curve with rate = median count rate of data. |
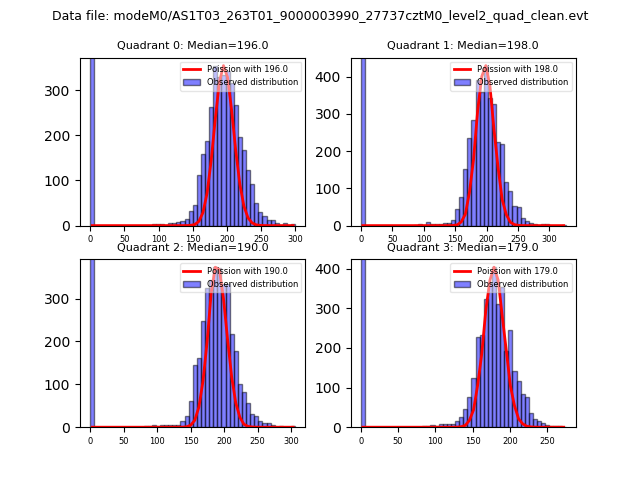 |
 |
| Quadrant-wise count rates Data is divided into 100 sec bins |
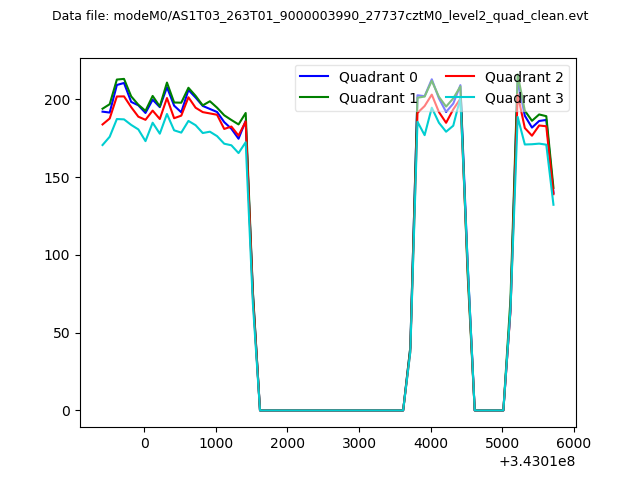 |
|
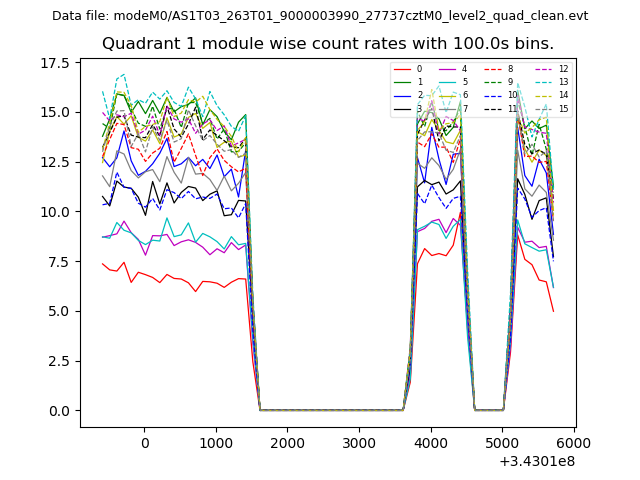
| Module-wise count rates for Quadrant A Data is divided into 100 sec bins |
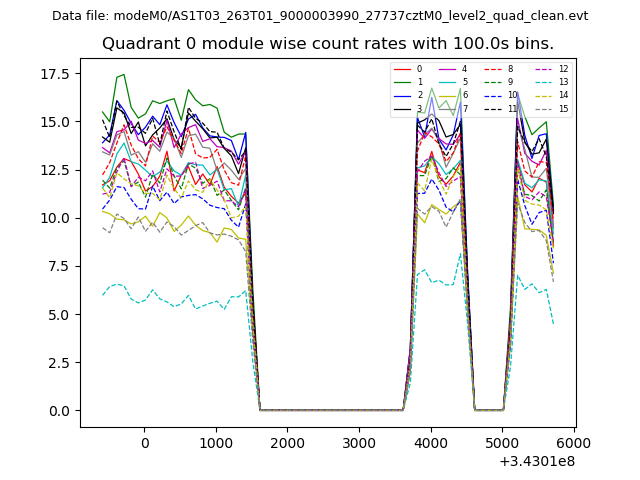 |
 |
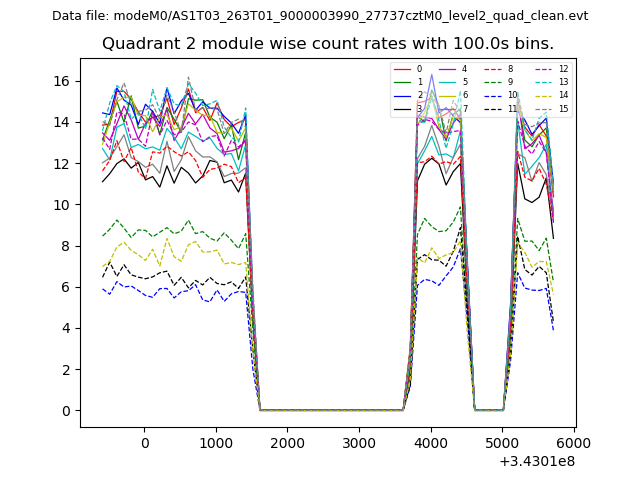
| Module-wise count rates for Quadrant B Data is divided into 100 sec bins |
 |
 |
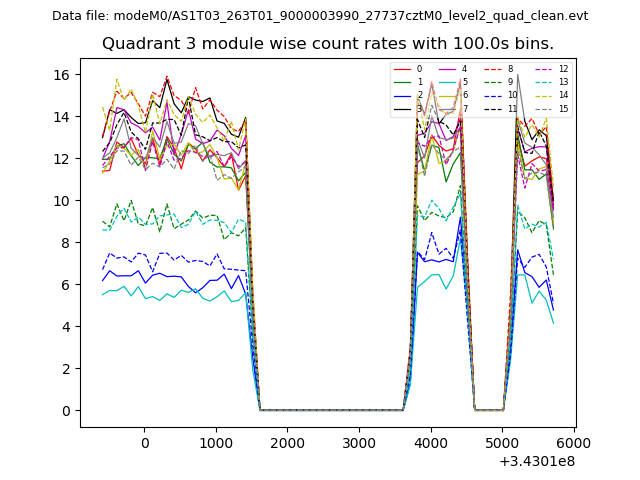
| Module-wise count rates for Quadrant C Data is divided into 100 sec bins |
 |
 |
| Module-wise count rates for Quadrant D Data is divided into 100 sec bins |
 |
 |
| Parameter | Plot |
|---|---|
| CZT HV Monitor | 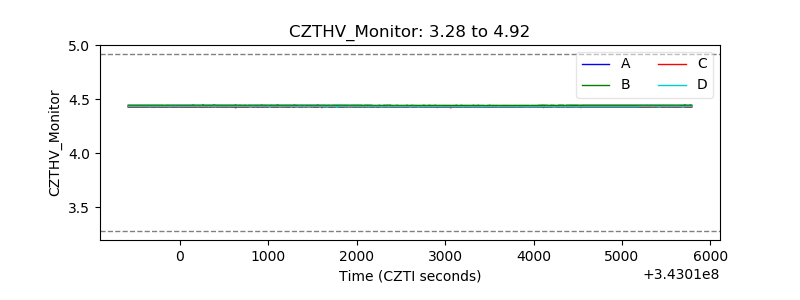 |
| D_VDD | 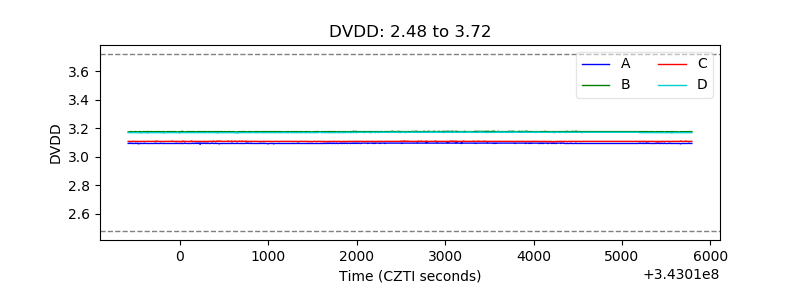 |
| Temperature 1 | 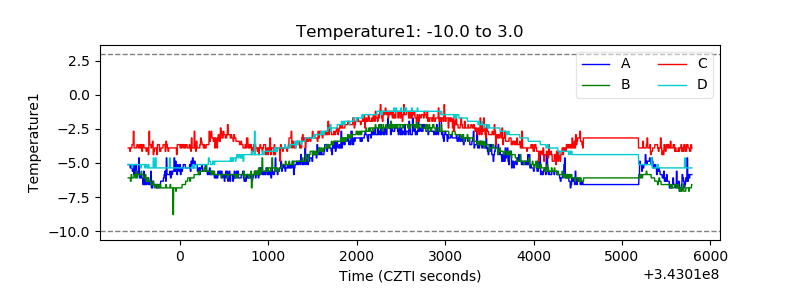 |
| Veto HV Monitor | 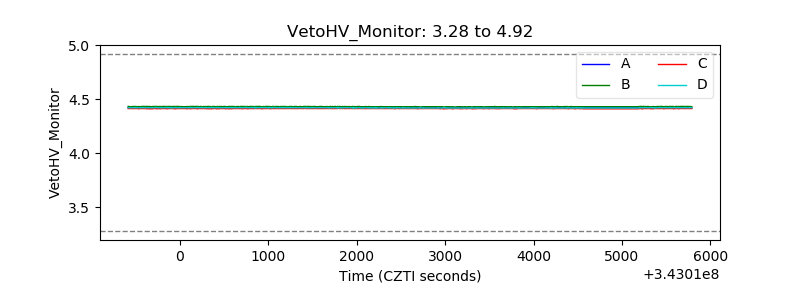 |
| Veto LLD | 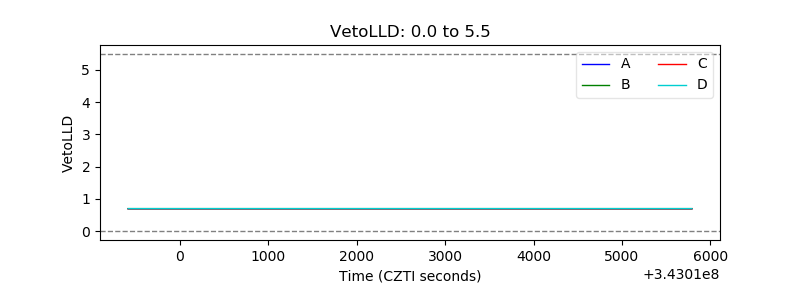 |
| Alpha Counter | 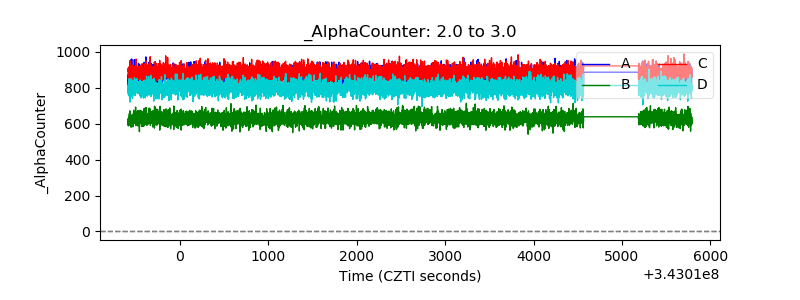 |
| _CPM_Rate | 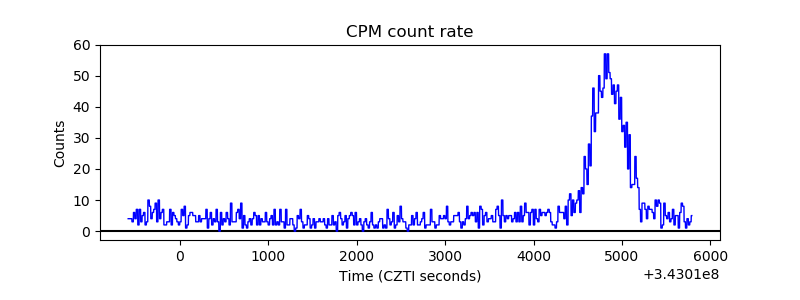 |
| CZT Counter | 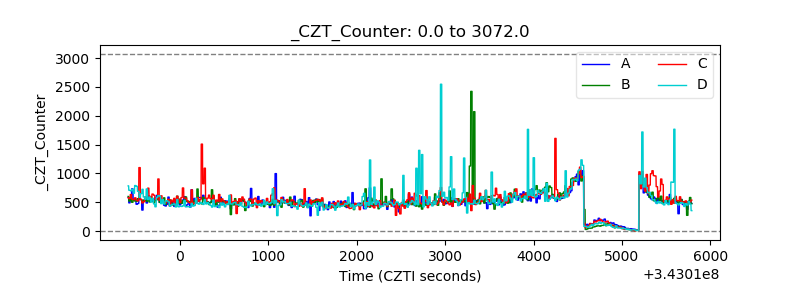 |
| +2.5 Volts monitor |  |
| +5 Volts monitor |  |
| _ROLL_ROT | 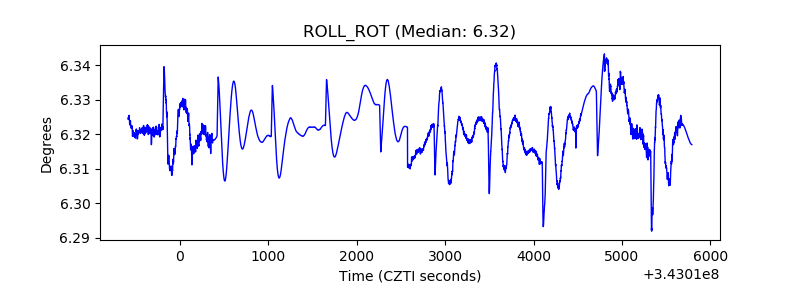 |
| _Roll_DEC | 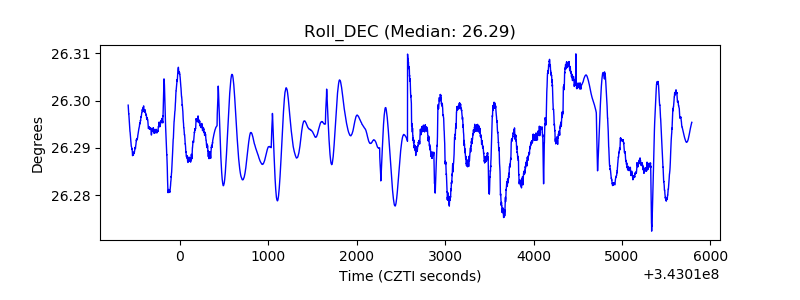 |
| _Roll_RA | 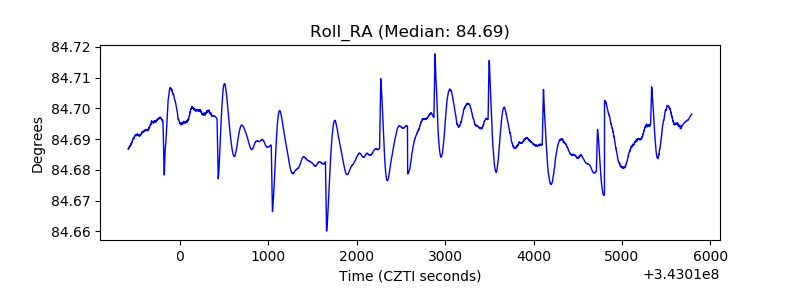 |
| Veto Counter | 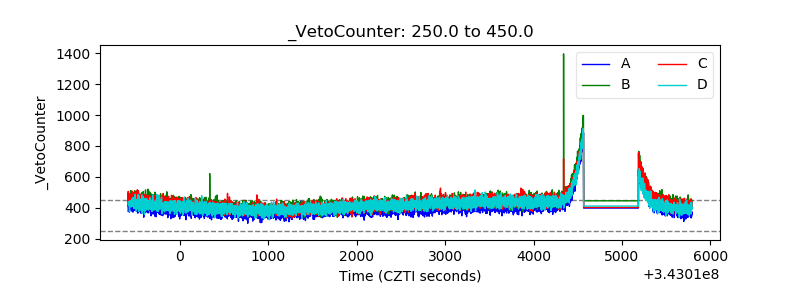 |