| Param | Original file | Final file |
|---|---|---|
| Filename | modeM0/AS1A09_038T42_9000003992cztM0_level2.fits | modeM0/AS1A09_038T42_9000003992cztM0_level2_quad_clean.evt |
| Size (bytes) | 86,555,520 | 89,271,360 |
| Size | 82.5 MB | 85.1 MB |
| Events in quadrant A | 522,364 | 535,722 |
| Events in quadrant B | 505,626 | 544,139 |
| Events in quadrant C | 504,706 | 505,876 |
| Events in quadrant D | 446,212 | 474,900 |
| Mode SS | |||
|---|---|---|---|
| Quadrant | BADHDUFLAG | Total packets | Discarded packets |
| A | 0 | 186 | 0 |
| B | 0 | 186 | 0 |
| C | 0 | 186 | 0 |
| D | 0 | 186 | 0 |
| Mode M9 | |||
|---|---|---|---|
| Quadrant | BADHDUFLAG | Total packets | Discarded packets |
| A | 0 | 3 | 0 |
| B | 0 | 3 | 0 |
| C | 0 | 3 | 0 |
| D | 0 | 3 | 0 |
| Mode M0 | |||
|---|---|---|---|
| Quadrant | BADHDUFLAG | Total packets | Discarded packets |
| A | 0 | 18871 | 0 |
| B | 0 | 19214 | 0 |
| C | 0 | 21240 | 0 |
| D | 0 | 22423 | 0 |
| Quadrant | Total seconds | Saturated seconds | Saturation percentage |
|---|---|---|---|
| A | 9264 | 125 | 1.349309% |
| B | 9264 | 165 | 1.781088% |
| C | 9264 | 291 | 3.141192% |
| D | 9264 | 307 | 3.313903% |
Noise dominated data is calculated using 1-second bins in cleaned event files. If a bin has >2000 counts, and if more than 50% of those come from <1% of pixels, then it is considered to be noise-dominated and hence unusable.
| Quadrant | # 1 sec bins | Bins with >0 counts | Bins with >2000 counts | High rate bins dominated by noise | Noise dominated (total time) | Noise dominated (detector-on time) | Marked lightcurve |
|---|---|---|---|---|---|---|---|
| A | 9524 | 9263 | 0 | 0 | 0.00% | 0.00% | 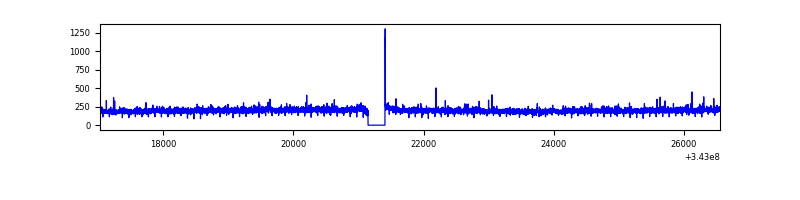 |
| B | 9524 | 9263 | 0 | 0 | 0.00% | 0.00% | 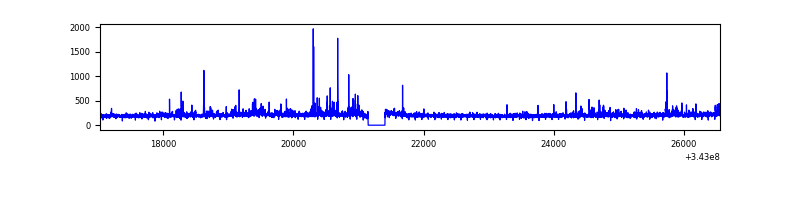 |
| C | 9524 | 9263 | 0 | 0 | 0.00% | 0.00% | 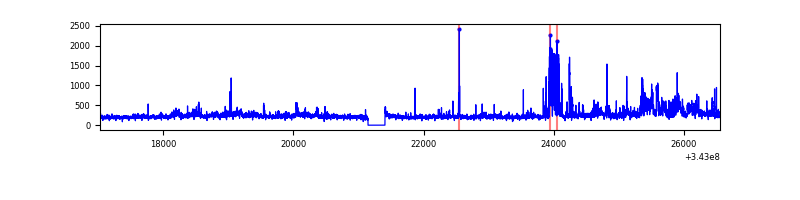 |
| D | 9524 | 9262 | 0 | 0 | 0.00% | 0.00% | 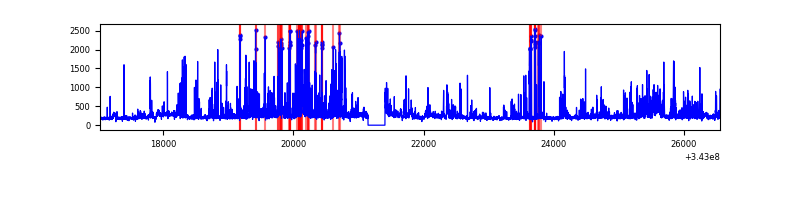 |
Top three noisy pixels from each quadrant. If the there are fewer than three noisy pixels in the level2.evt file, extra rows are filled as -1
| Pixel properties | Quadrant properties | ||||||
|---|---|---|---|---|---|---|---|
| Quadrant | DetID | PixID | Counts | Sigma | Mean | Median | Sigma |
| A | 0 | 29 | 426 | 8.44 | 136 | 128 | 35.3 |
| A | 7 | 110 | 424 | 8.38 | 136 | 128 | 35.3 |
| A | 9 | 19 | 392 | 7.47 | 136 | 128 | 35.3 |
| B | 2 | 9 | 404 | 9.73 | 133 | 128 | 28.4 |
| B | 5 | 128 | 355 | 8.0 | 133 | 128 | 28.4 |
| B | 3 | 17 | 334 | 7.26 | 133 | 128 | 28.4 |
| C | 3 | 202 | 359 | 6.71 | 133 | 125 | 34.9 |
| C | 3 | 203 | 359 | 6.71 | 133 | 125 | 34.9 |
| C | 1 | 65 | 357 | 6.65 | 133 | 125 | 34.9 |
| D | 10 | 189 | 342 | 6.38 | 127 | 115 | 35.6 |
| D | 15 | 46 | 325 | 5.9 | 127 | 115 | 35.6 |
| D | 6 | 231 | 325 | 5.9 | 127 | 115 | 35.6 |
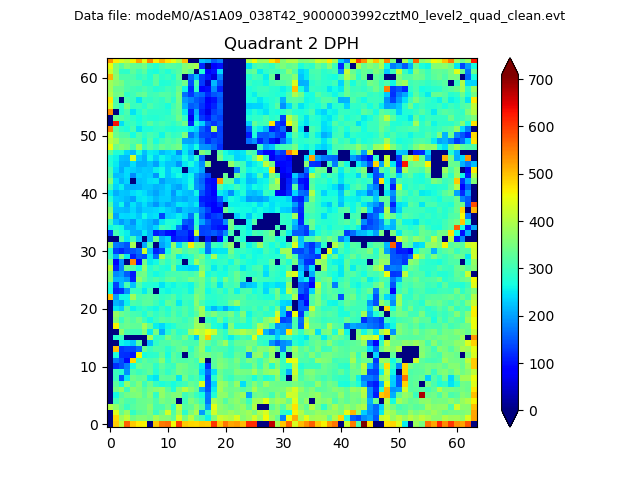
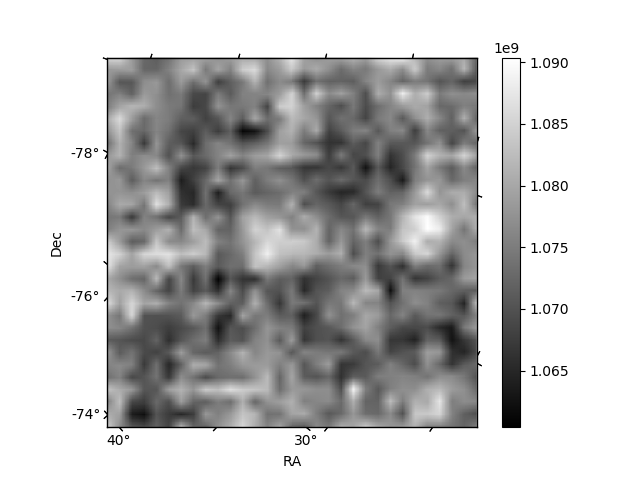
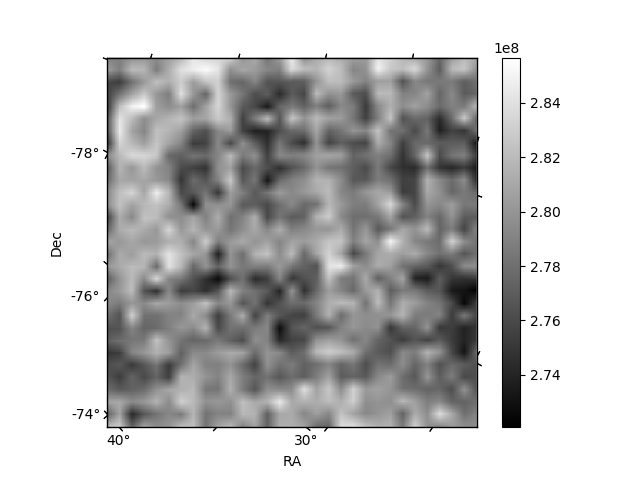
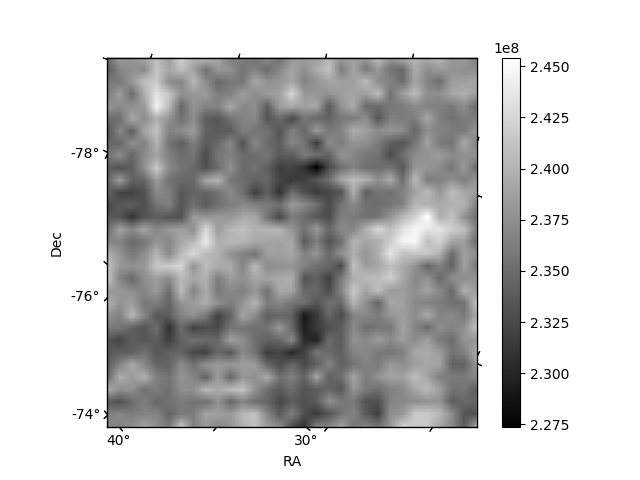
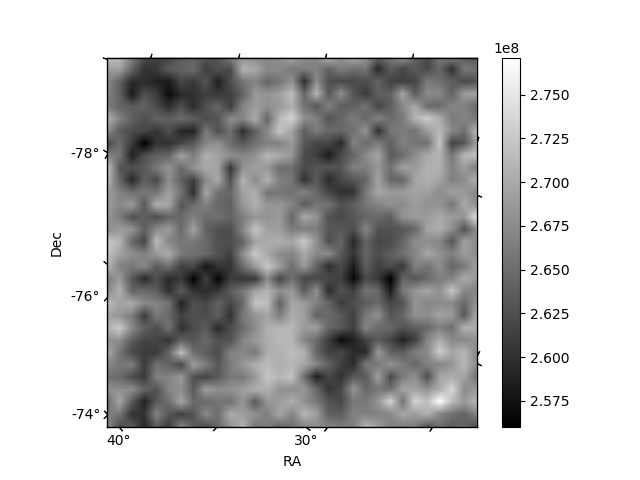
Histogram calculated using DETX and DETY for each event in the final _common_clean file
| Quadrant A | 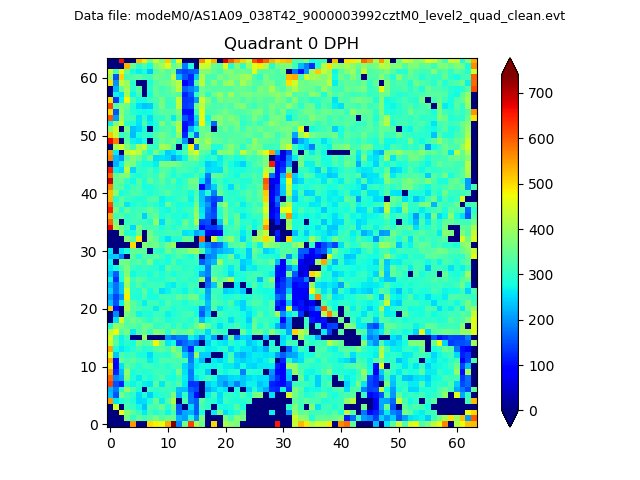 |
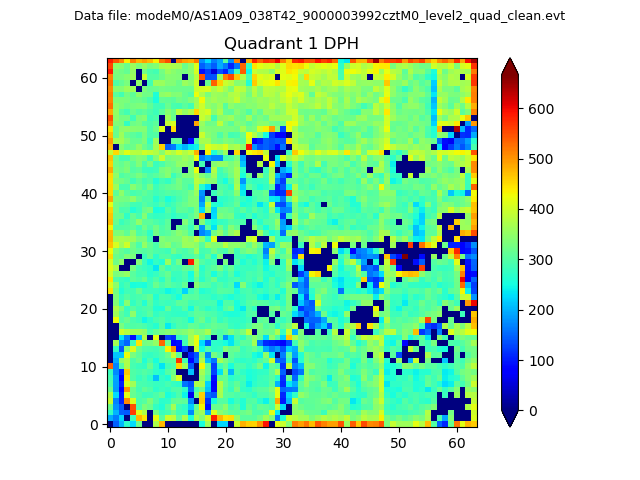 |
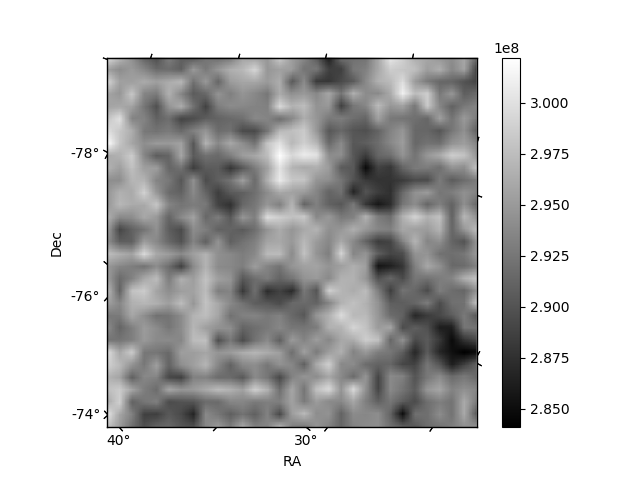
Quadrant B |
|---|---|---|---|
| Quadrant D | 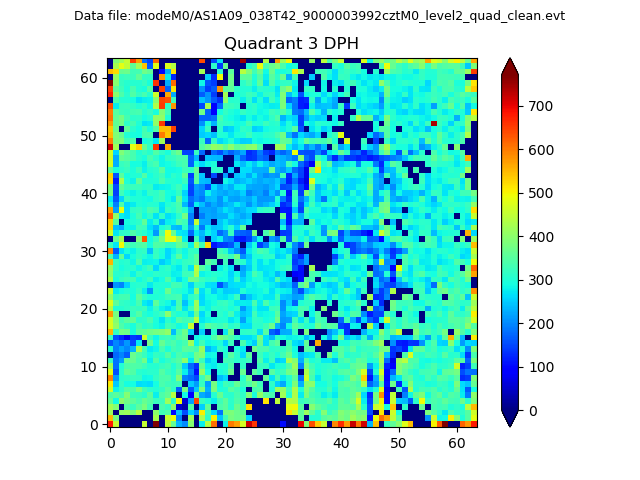 |
 |
Quadrant C |
| Plot type | Count rate plots | Images |
|---|---|---|
| Comparison with Poisson distribution Blue bars denote a histogram of data divided into 1 sec bins. Red curve is a Poisson curve with rate = median count rate of data. |
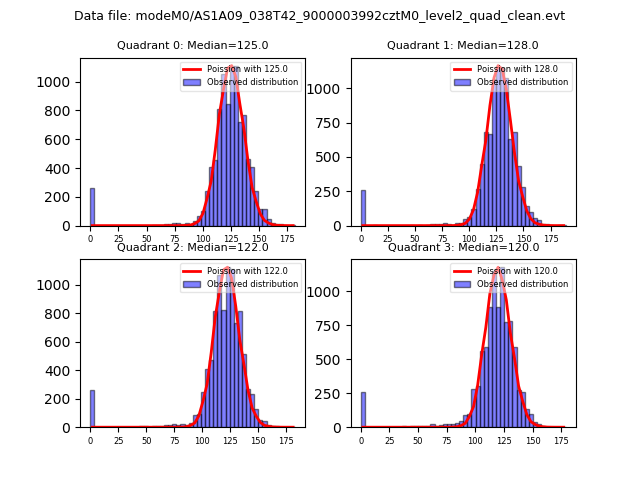 |
 |
| Quadrant-wise count rates Data is divided into 100 sec bins |
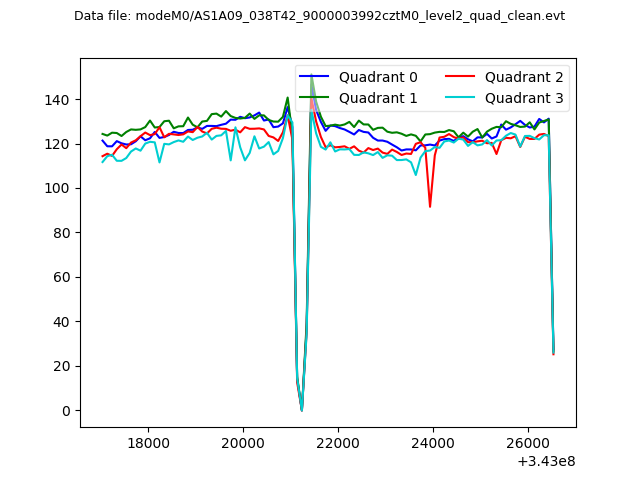 |
|
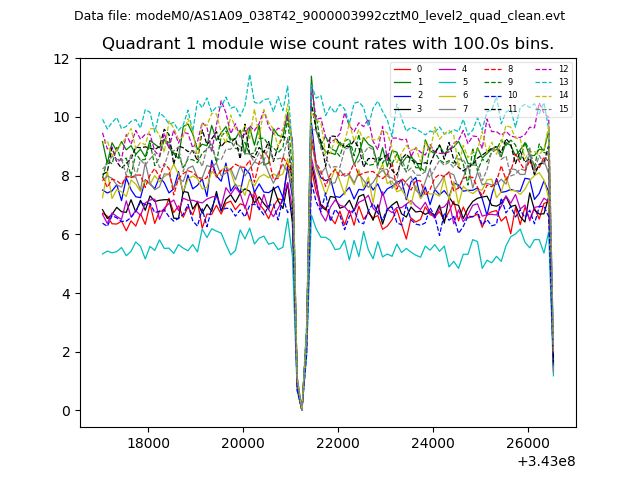
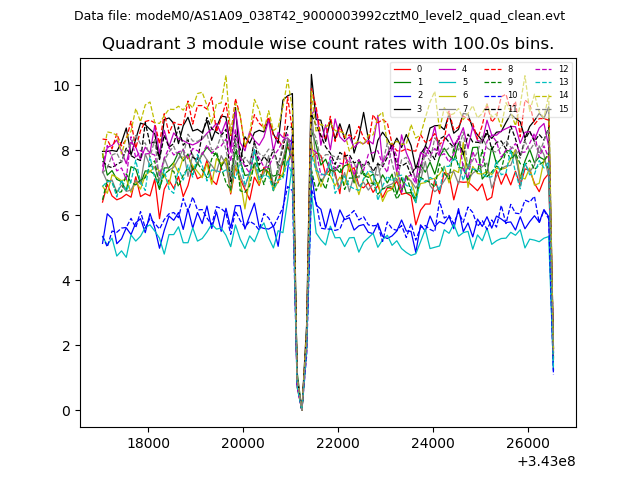
| Module-wise count rates for Quadrant A Data is divided into 100 sec bins |
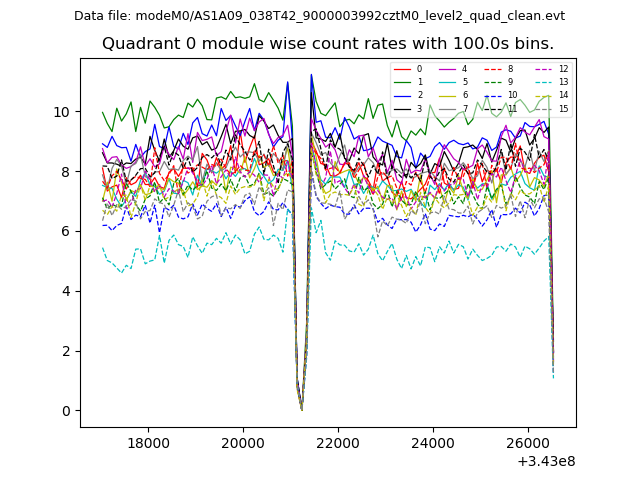 |
 |
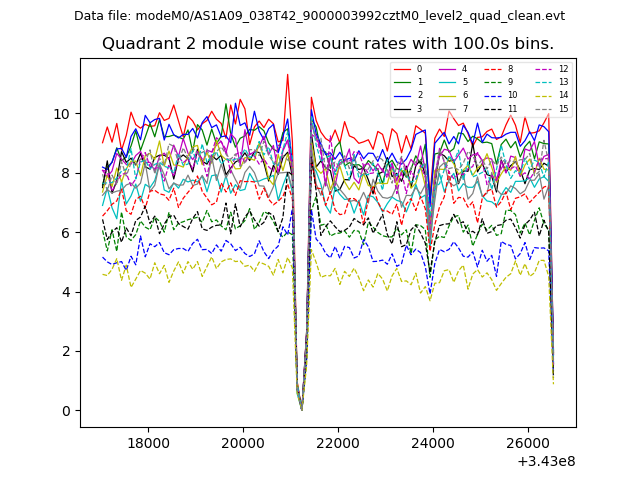
| Module-wise count rates for Quadrant B Data is divided into 100 sec bins |
 |
 |
| Module-wise count rates for Quadrant C Data is divided into 100 sec bins |
 |
 |
| Module-wise count rates for Quadrant D Data is divided into 100 sec bins |
 |
 |
| Parameter | Plot |
|---|---|
| CZT HV Monitor | 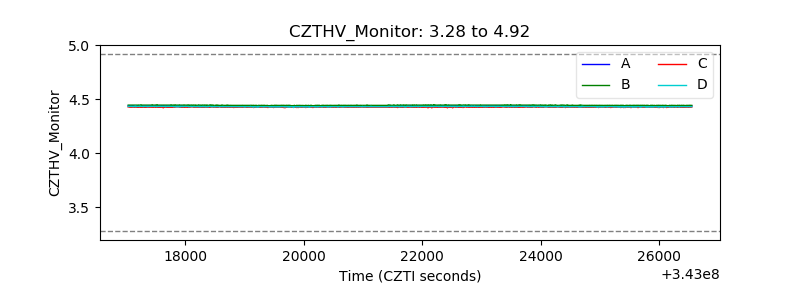 |
| D_VDD | 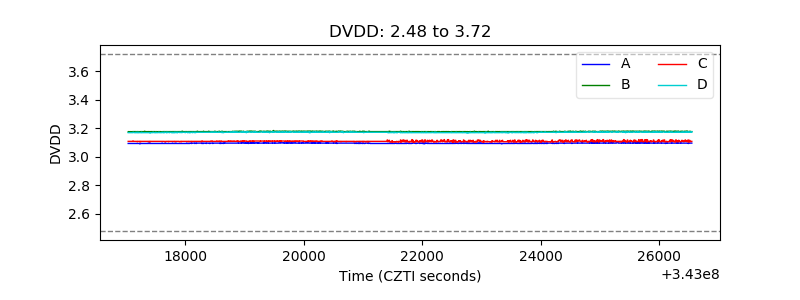 |
| Temperature 1 | 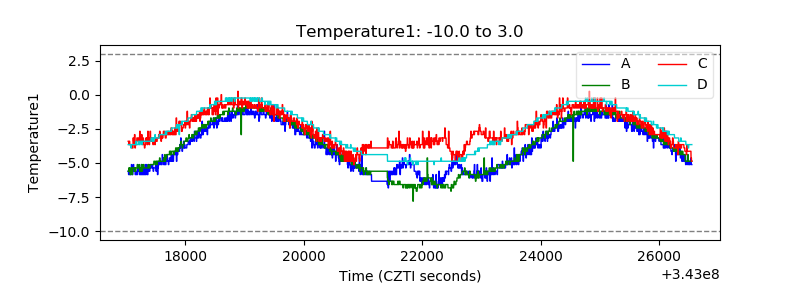 |
| Veto HV Monitor | 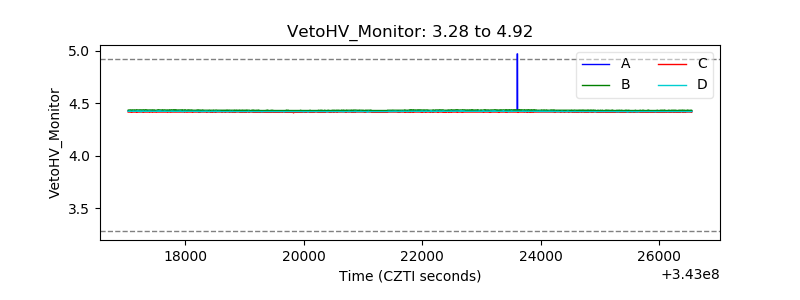 |
| Veto LLD | 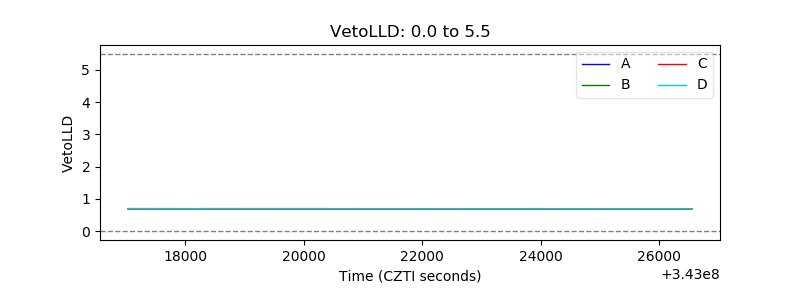 |
| Alpha Counter | 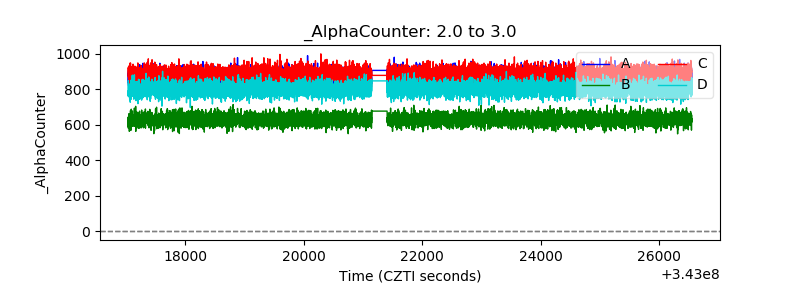 |
| _CPM_Rate | 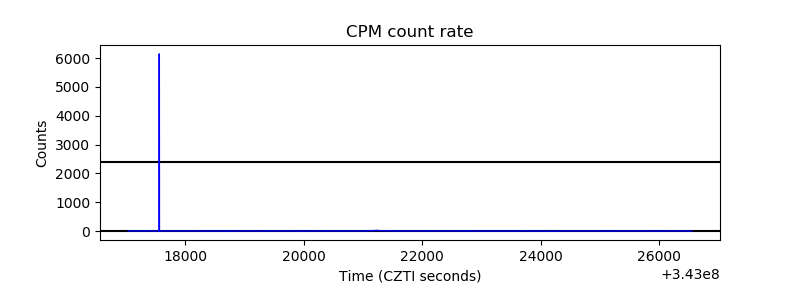 |
| CZT Counter | 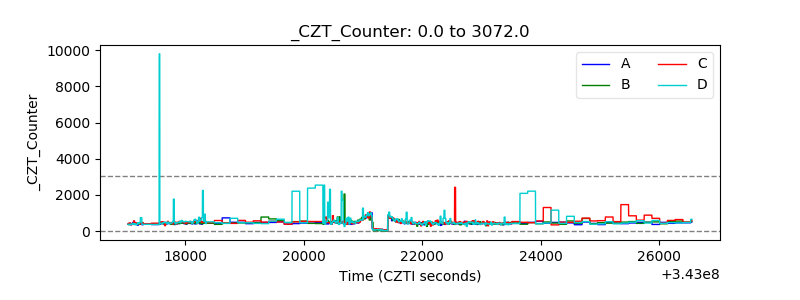 |
| +2.5 Volts monitor | 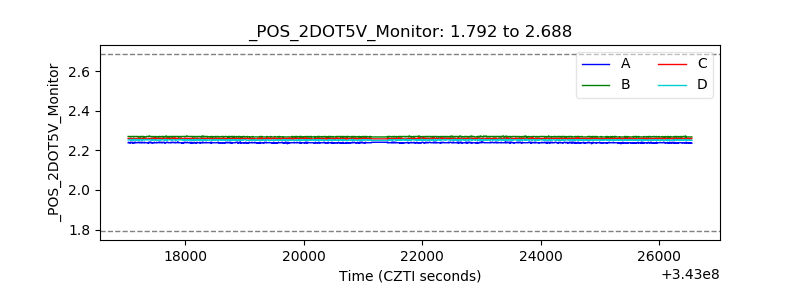 |
| +5 Volts monitor | 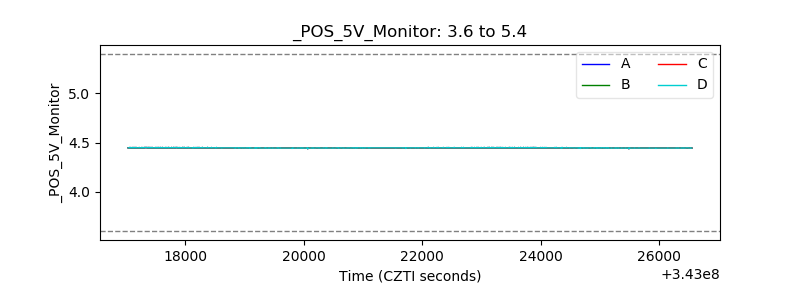 |
| _ROLL_ROT | 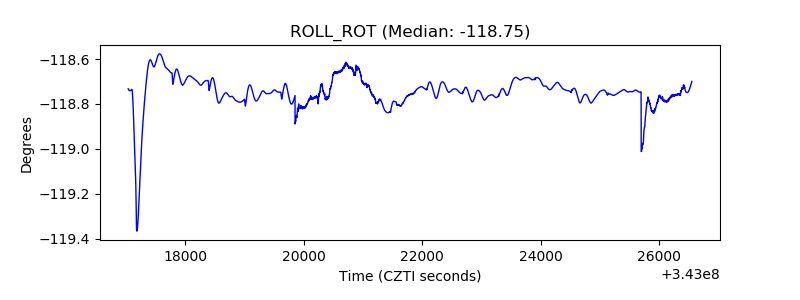 |
| _Roll_DEC | 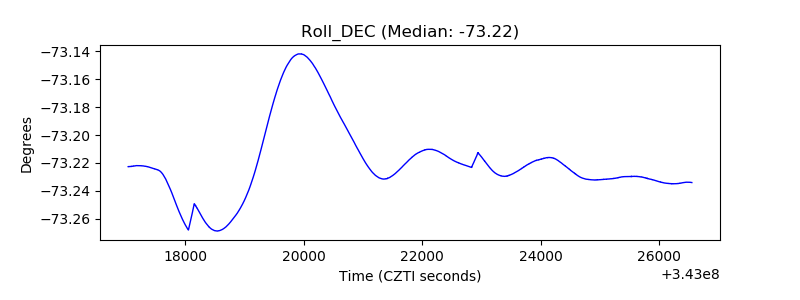 |
| _Roll_RA | 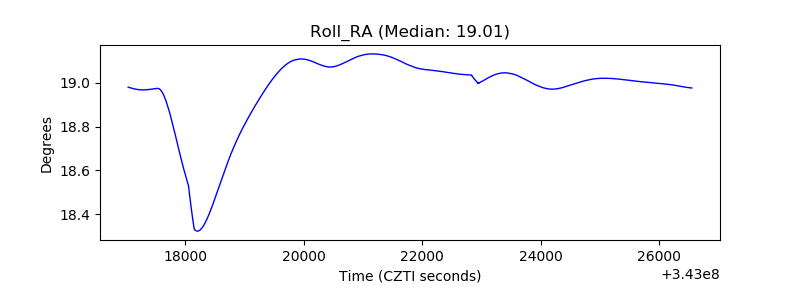 |
| Veto Counter | 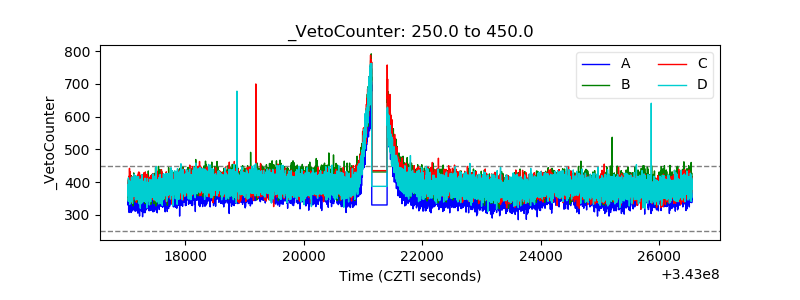 |