| Param | Original file | Final file |
|---|---|---|
| Filename | modeM0/AS1A09_038T42_9000003992_27738cztM0_level2.evt | modeM0/AS1A09_038T42_9000003992_27738cztM0_level2_quad_clean.evt |
| Size (bytes) | 403,948,800 | 106,548,480 |
| Size | 385.2 MB | 101.6 MB |
| Events in quadrant A | 2,649,392 | 719,146 |
| Events in quadrant B | 2,774,323 | 736,660 |
| Events in quadrant C | 2,925,441 | 697,436 |
| Events in quadrant D | 3,498,077 | 676,650 |
| Mode M9 | |||
|---|---|---|---|
| Quadrant | BADHDUFLAG | Total packets | Discarded packets |
| A | 0 | 3 | 0 |
| B | 0 | 3 | 0 |
| C | 0 | 3 | 0 |
| D | 0 | 3 | 0 |
| Mode M0 | |||
|---|---|---|---|
| Quadrant | BADHDUFLAG | Total packets | Discarded packets |
| A | 0 | 11690 | 0 |
| B | 0 | 11943 | 0 |
| C | 0 | 12094 | 0 |
| D | 0 | 14183 | 0 |
| Quadrant | Total seconds | Saturated seconds | Saturation percentage |
|---|---|---|---|
| A | 5680 | 123 | 2.165493% |
| B | 5680 | 162 | 2.852113% |
| C | 5680 | 183 | 3.221831% |
| D | 5680 | 261 | 4.595070% |
Noise dominated data is calculated using 1-second bins in cleaned event files. If a bin has >2000 counts, and if more than 50% of those come from <1% of pixels, then it is considered to be noise-dominated and hence unusable.
| Quadrant | # 1 sec bins | Bins with >0 counts | Bins with >2000 counts | High rate bins dominated by noise | Noise dominated (total time) | Noise dominated (detector-on time) | Marked lightcurve |
|---|---|---|---|---|---|---|---|
| A | 5940 | 5680 | 0 | 0 | 0.00% | 0.00% | 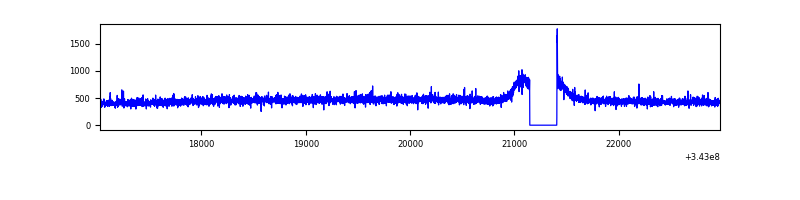 |
| B | 5940 | 5680 | 3 | 3 | 0.05% | 0.05% | 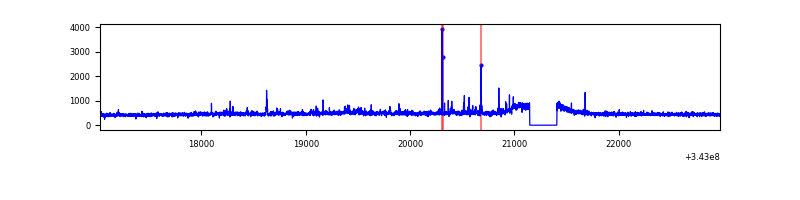 |
| C | 5940 | 5680 | 1 | 1 | 0.02% | 0.02% | 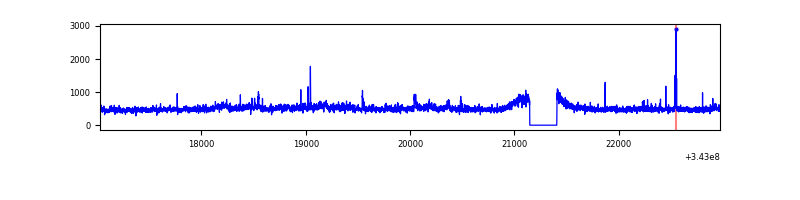 |
| D | 5940 | 5680 | 147 | 147 | 2.47% | 2.59% | 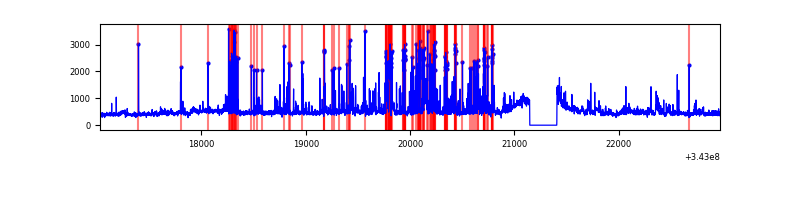 |
Top three noisy pixels from each quadrant. If the there are fewer than three noisy pixels in the level2.evt file, extra rows are filled as -1
| Pixel properties | Quadrant properties | ||||||
|---|---|---|---|---|---|---|---|
| Quadrant | DetID | PixID | Counts | Sigma | Mean | Median | Sigma |
| A | 13 | 254 | 9341 | 62.72 | 683 | 667 | 138.3 |
| A | 8 | 192 | 6768 | 44.11 | 683 | 667 | 138.3 |
| A | 3 | 137 | 6599 | 42.89 | 683 | 667 | 138.3 |
| B | 0 | 230 | 28128 | 210.93 | 680 | 661 | 130.2 |
| B | 3 | 64 | 24689 | 184.52 | 680 | 661 | 130.2 |
| B | 4 | 200 | 18469 | 136.76 | 680 | 661 | 130.2 |
| C | 3 | 233 | 252807 | 1644.5 | 656 | 658 | 153.3 |
| C | 14 | 238 | 105781 | 685.6 | 656 | 658 | 153.3 |
| C | 15 | 208 | 6056 | 35.21 | 656 | 658 | 153.3 |
| D | 1 | 52 | 767769 | 4952.15 | 657 | 638 | 154.9 |
| D | 2 | 250 | 121892 | 782.75 | 657 | 638 | 154.9 |
| D | 11 | 176 | 66229 | 423.42 | 657 | 638 | 154.9 |
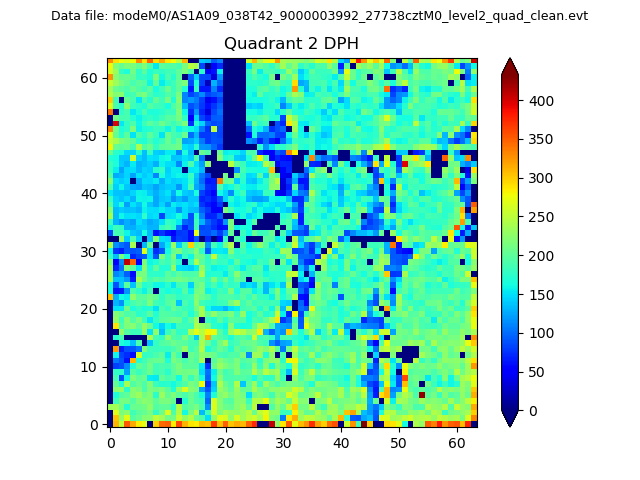
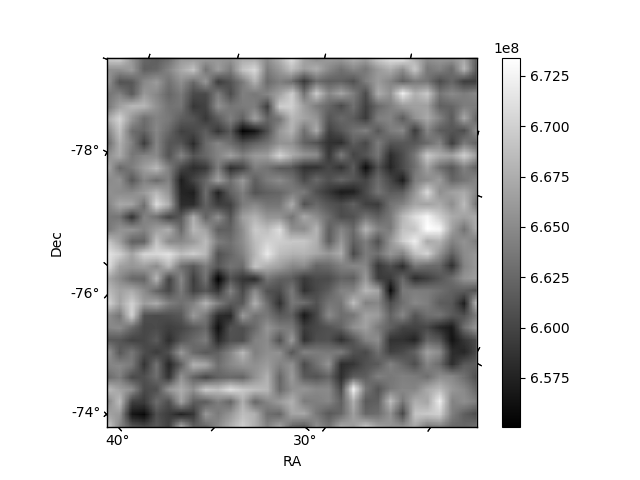
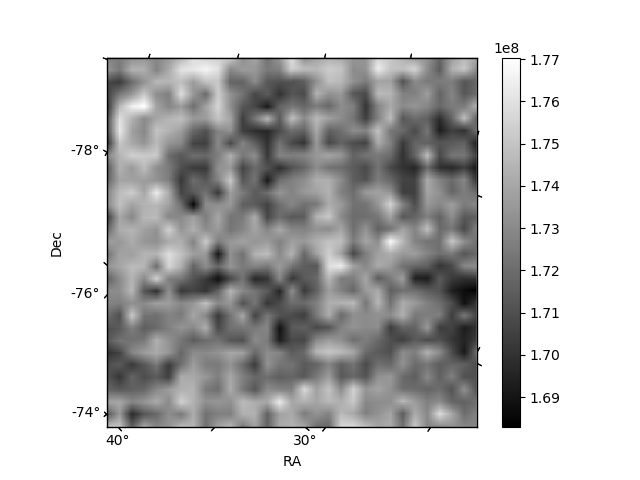
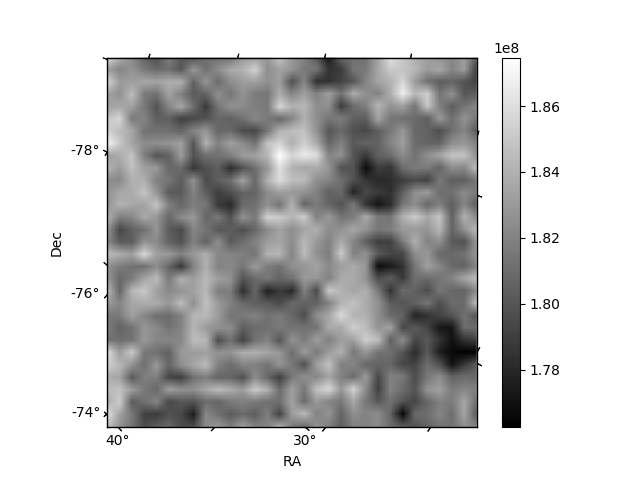
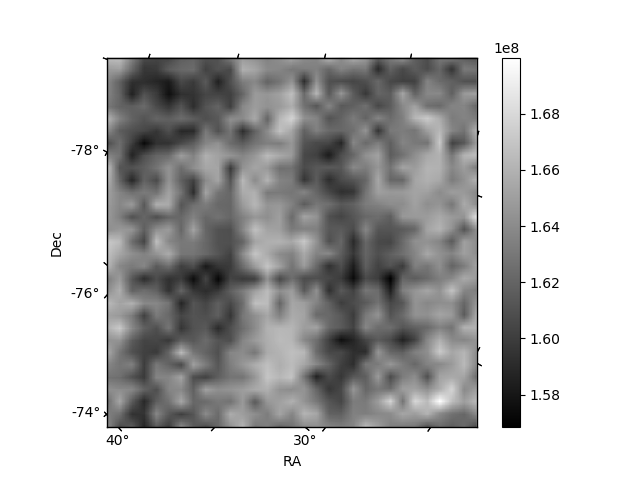
Histogram calculated using DETX and DETY for each event in the final _common_clean file
| Quadrant A | 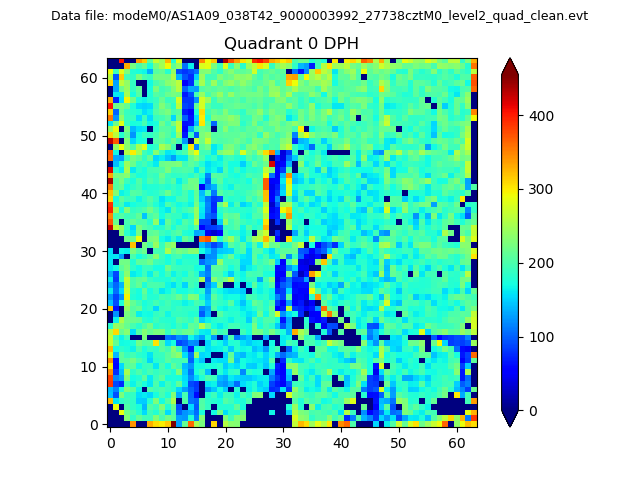 |
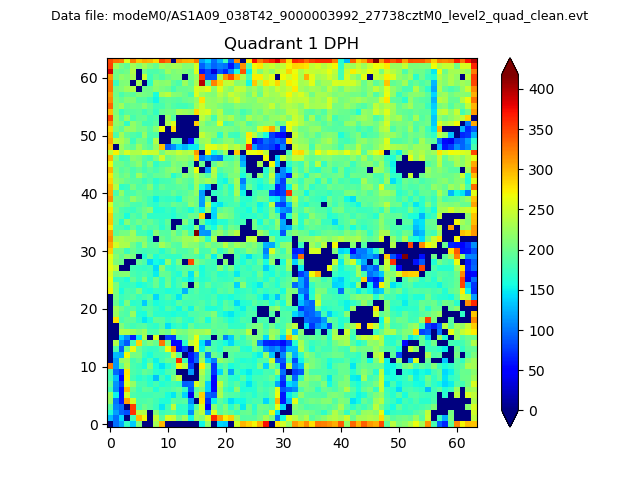 |
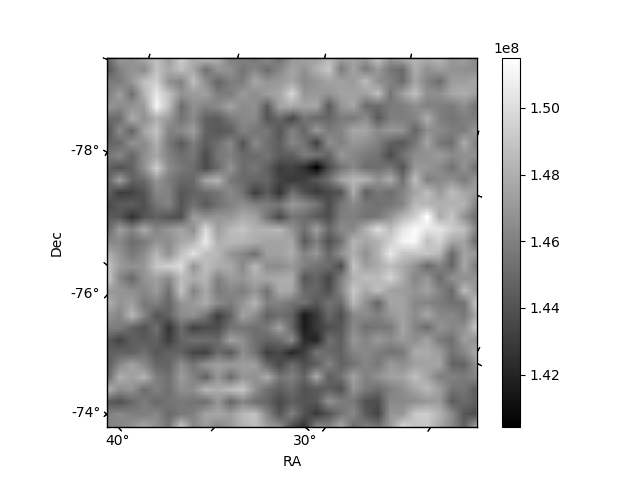
Quadrant B |
|---|---|---|---|
| Quadrant D | 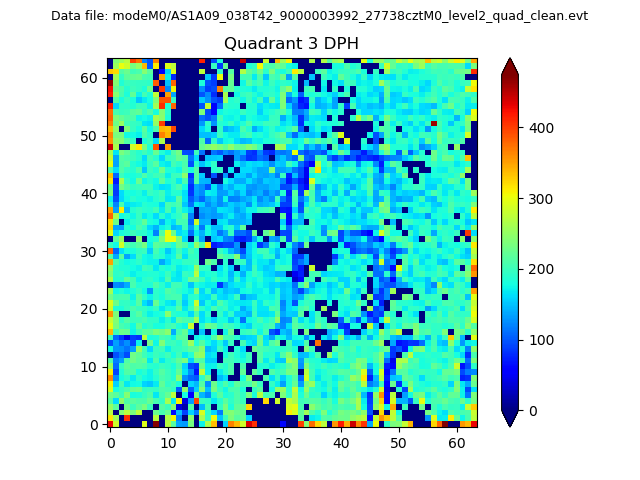 |
 |
Quadrant C |
| Plot type | Count rate plots | Images |
|---|---|---|
| Comparison with Poisson distribution Blue bars denote a histogram of data divided into 1 sec bins. Red curve is a Poisson curve with rate = median count rate of data. |
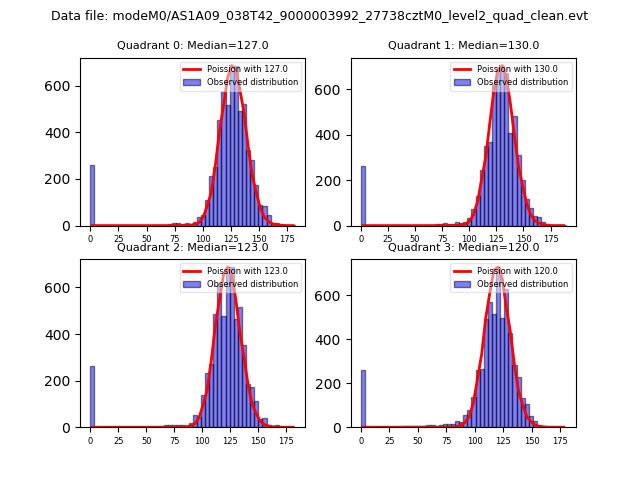 |
 |
| Quadrant-wise count rates Data is divided into 100 sec bins |
 |
|
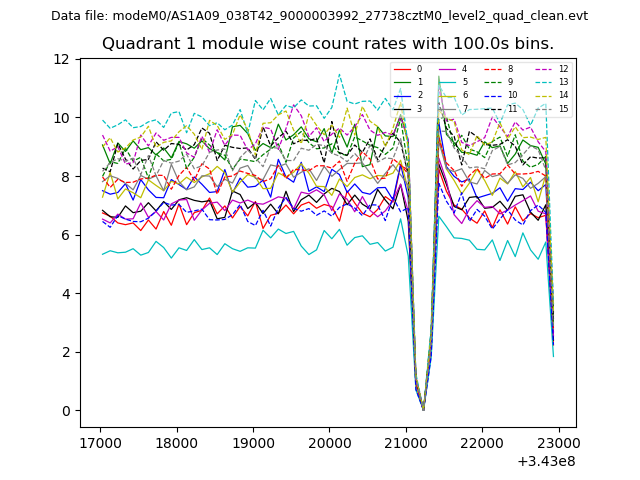
| Module-wise count rates for Quadrant A Data is divided into 100 sec bins |
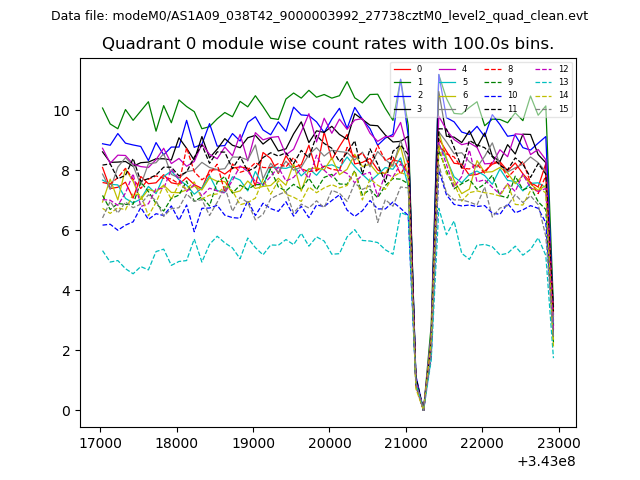 |
 |
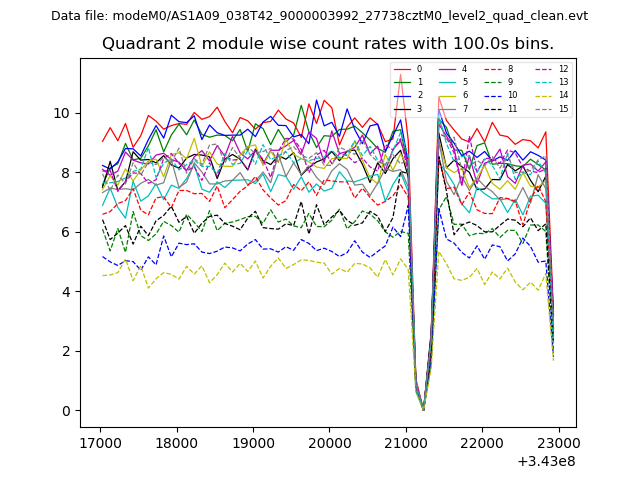
| Module-wise count rates for Quadrant B Data is divided into 100 sec bins |
 |
 |
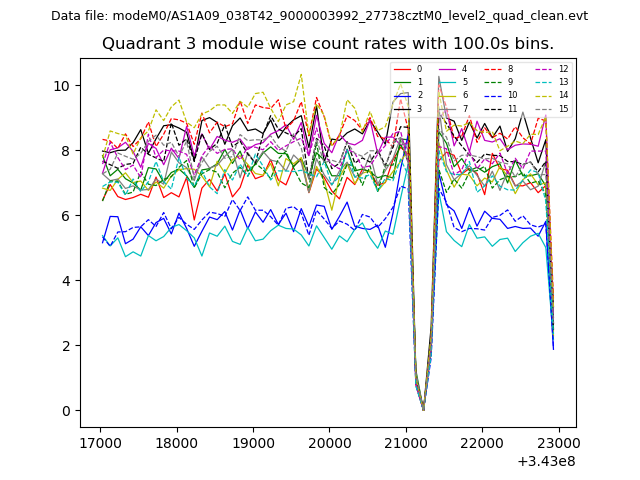
| Module-wise count rates for Quadrant C Data is divided into 100 sec bins |
 |
 |
| Module-wise count rates for Quadrant D Data is divided into 100 sec bins |
 |
 |
| Parameter | Plot |
|---|---|
| CZT HV Monitor | 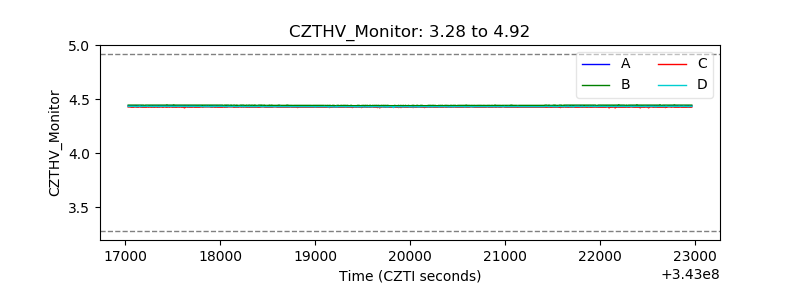 |
| D_VDD | 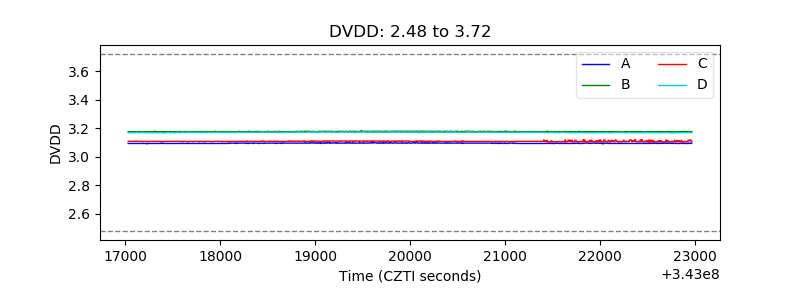 |
| Temperature 1 | 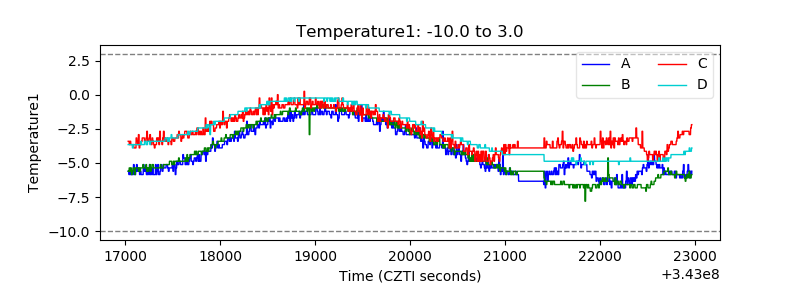 |
| Veto HV Monitor | 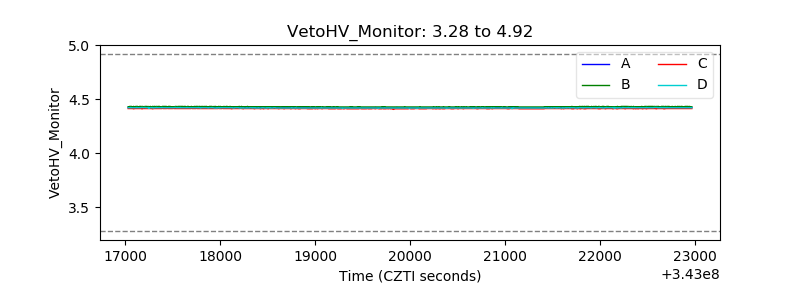 |
| Veto LLD | 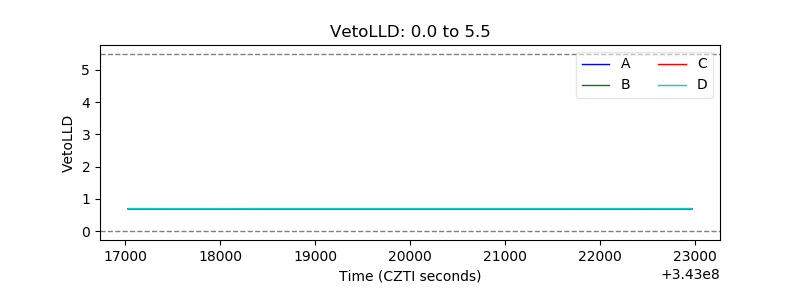 |
| Alpha Counter |  |
| _CPM_Rate | 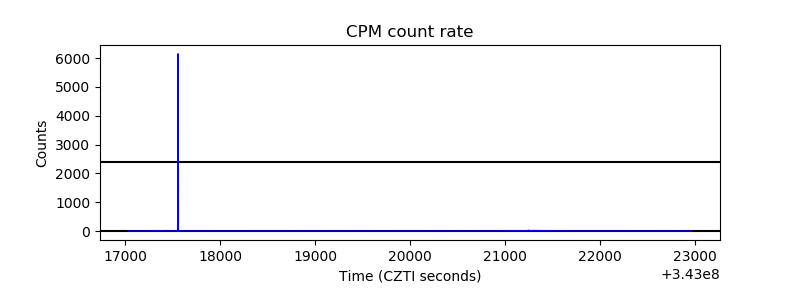 |
| CZT Counter | 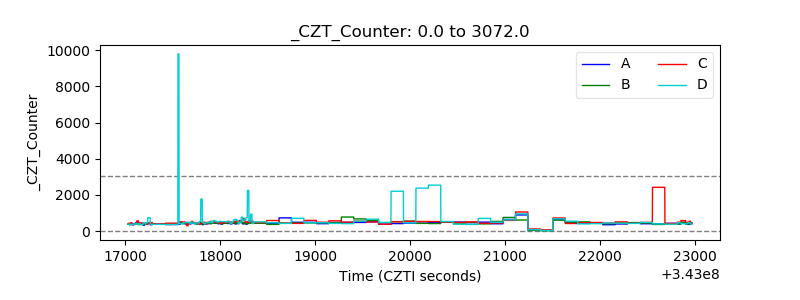 |
| +2.5 Volts monitor |  |
| +5 Volts monitor |  |
| _ROLL_ROT | 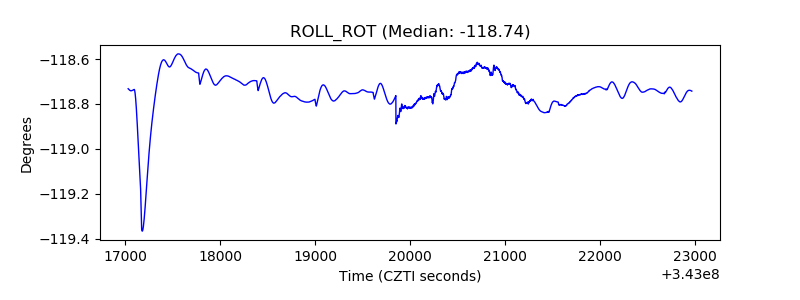 |
| _Roll_DEC | 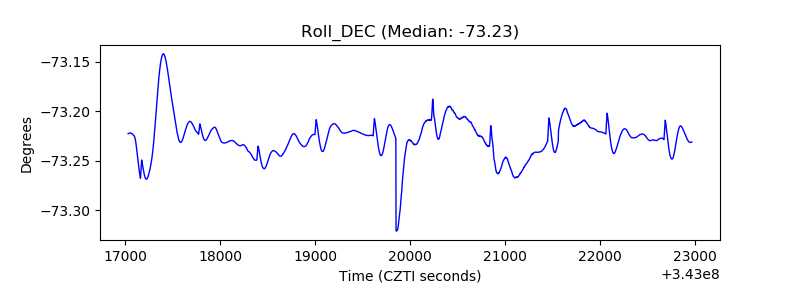 |
| _Roll_RA | 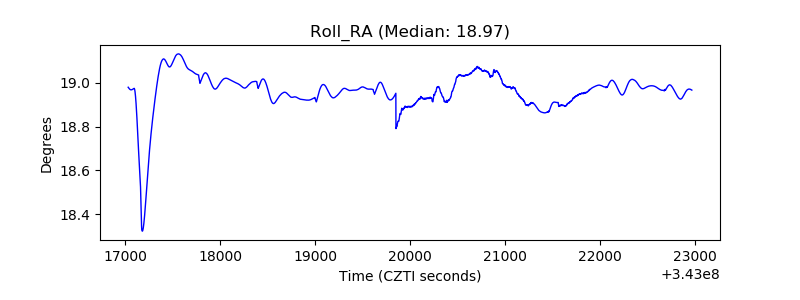 |
| Veto Counter | 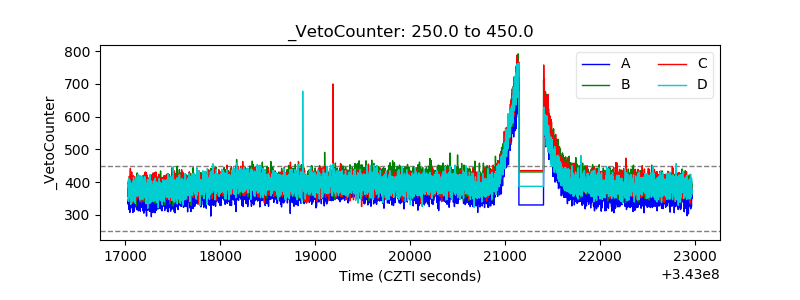 |