| Param | Original file | Final file |
|---|---|---|
| Filename | modeM0/AS1A09_038T42_9000003992_27739cztM0_level2.evt | modeM0/AS1A09_038T42_9000003992_27739cztM0_level2_quad_clean.evt |
| Size (bytes) | 384,079,680 | 99,610,560 |
| Size | 366.3 MB | 95.0 MB |
| Events in quadrant A | 2,476,608 | 670,737 |
| Events in quadrant B | 2,561,585 | 684,621 |
| Events in quadrant C | 3,283,390 | 644,550 |
| Events in quadrant D | 2,944,606 | 640,774 |
| Mode M9 | |||
|---|---|---|---|
| Quadrant | BADHDUFLAG | Total packets | Discarded packets |
| A | 0 | 3 | 0 |
| B | 0 | 3 | 0 |
| C | 0 | 3 | 0 |
| D | 0 | 3 | 0 |
| Mode M0 | |||
|---|---|---|---|
| Quadrant | BADHDUFLAG | Total packets | Discarded packets |
| A | 0 | 11066 | 0 |
| B | 0 | 11198 | 0 |
| C | 0 | 13132 | 0 |
| D | 0 | 12472 | 0 |
| Quadrant | Total seconds | Saturated seconds | Saturation percentage |
|---|---|---|---|
| A | 5373 | 123 | 2.289224% |
| B | 5374 | 157 | 2.921474% |
| C | 5374 | 275 | 5.117231% |
| D | 5374 | 160 | 2.977298% |
Noise dominated data is calculated using 1-second bins in cleaned event files. If a bin has >2000 counts, and if more than 50% of those come from <1% of pixels, then it is considered to be noise-dominated and hence unusable.
| Quadrant | # 1 sec bins | Bins with >0 counts | Bins with >2000 counts | High rate bins dominated by noise | Noise dominated (total time) | Noise dominated (detector-on time) | Marked lightcurve |
|---|---|---|---|---|---|---|---|
| A | 5633 | 5373 | 0 | 0 | 0.00% | 0.00% | 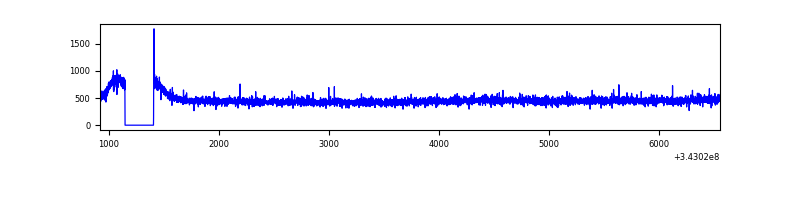 |
| B | 5634 | 5374 | 0 | 0 | 0.00% | 0.00% | 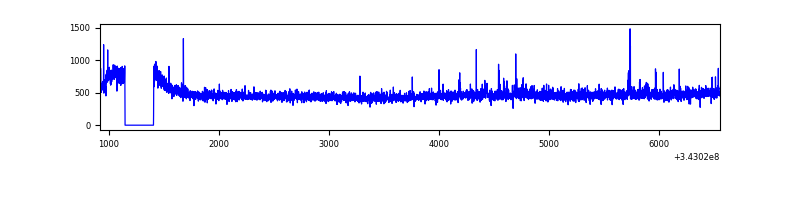 |
| C | 5634 | 5374 | 71 | 71 | 1.26% | 1.32% | 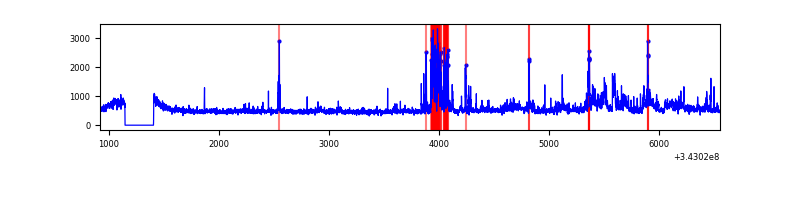 |
| D | 5634 | 5374 | 48 | 48 | 0.85% | 0.89% | 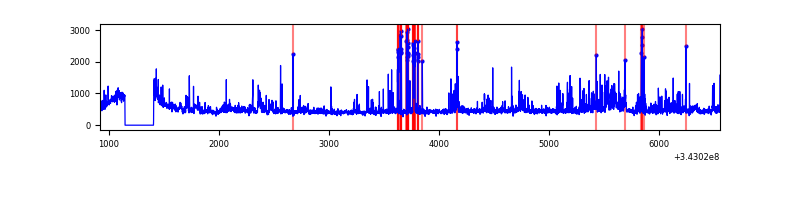 |
Top three noisy pixels from each quadrant. If the there are fewer than three noisy pixels in the level2.evt file, extra rows are filled as -1
| Pixel properties | Quadrant properties | ||||||
|---|---|---|---|---|---|---|---|
| Quadrant | DetID | PixID | Counts | Sigma | Mean | Median | Sigma |
| A | 13 | 254 | 8547 | 61.48 | 638 | 623 | 128.9 |
| A | 8 | 192 | 6692 | 47.09 | 638 | 623 | 128.9 |
| A | 3 | 137 | 6155 | 42.92 | 638 | 623 | 128.9 |
| B | 4 | 200 | 24850 | 200.81 | 635 | 617 | 120.7 |
| B | 3 | 64 | 15699 | 124.98 | 635 | 617 | 120.7 |
| B | 12 | 111 | 15168 | 120.58 | 635 | 617 | 120.7 |
| C | 3 | 233 | 564024 | 3966.35 | 609 | 611 | 142.0 |
| C | 15 | 208 | 232692 | 1633.82 | 609 | 611 | 142.0 |
| C | 14 | 238 | 98205 | 687.05 | 609 | 611 | 142.0 |
| D | 1 | 52 | 230097 | 1551.85 | 620 | 601 | 147.9 |
| D | 11 | 176 | 191003 | 1287.5 | 620 | 601 | 147.9 |
| D | 2 | 250 | 110491 | 743.08 | 620 | 601 | 147.9 |
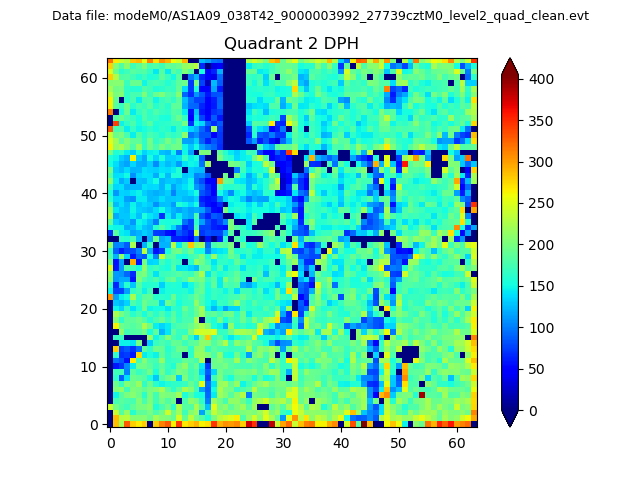
Histogram calculated using DETX and DETY for each event in the final _common_clean file
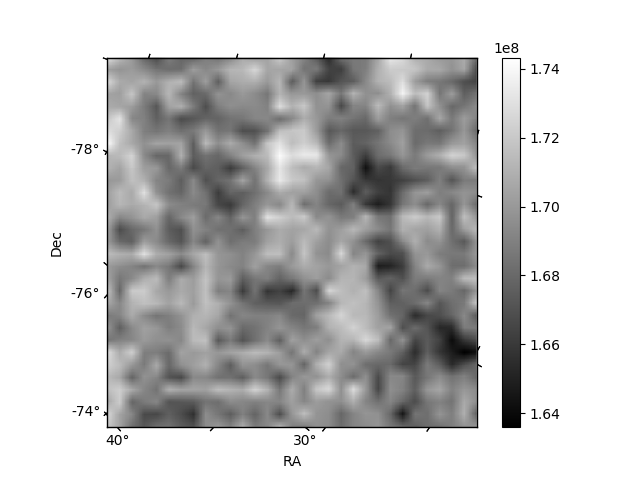
| Quadrant A | 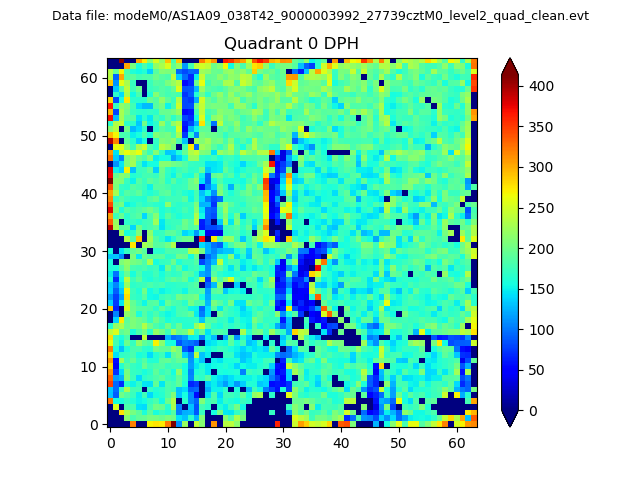 |
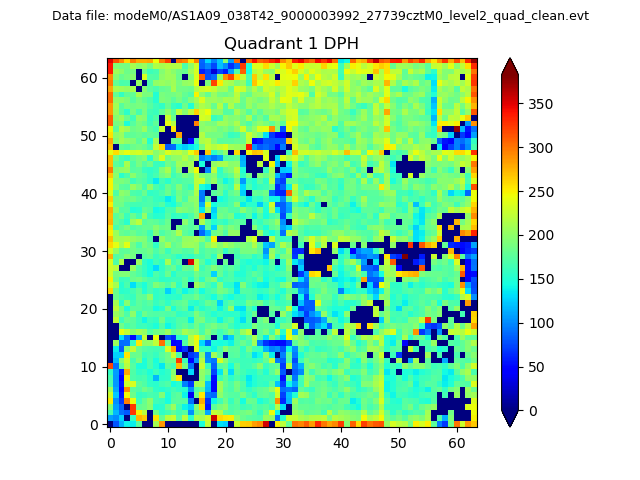 |
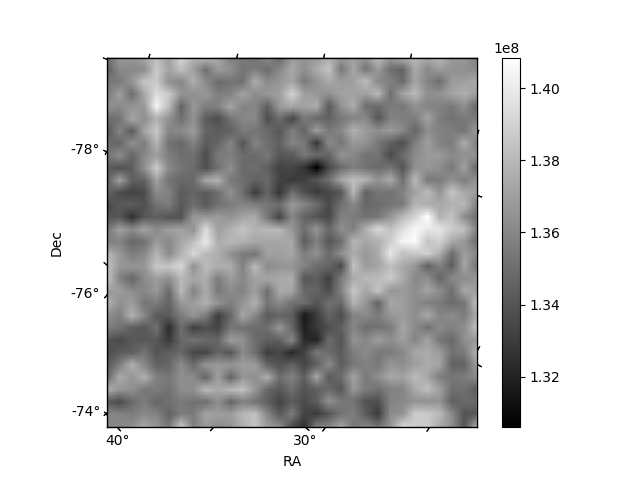
Quadrant B |
|---|---|---|---|
| Quadrant D | 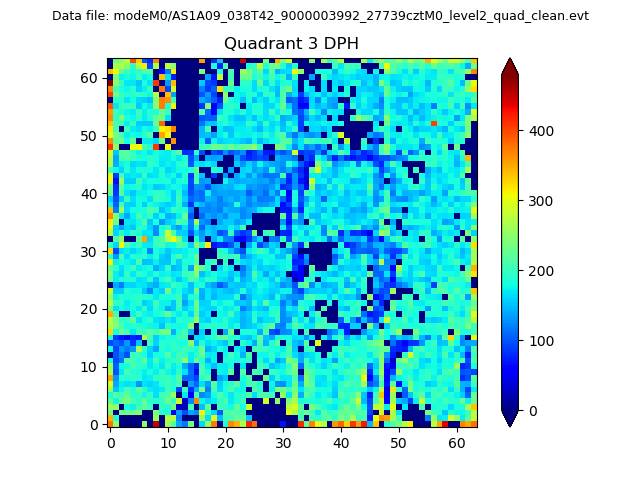 |
 |
Quadrant C |
| Plot type | Count rate plots | Images |
|---|---|---|
| Comparison with Poisson distribution Blue bars denote a histogram of data divided into 1 sec bins. Red curve is a Poisson curve with rate = median count rate of data. |
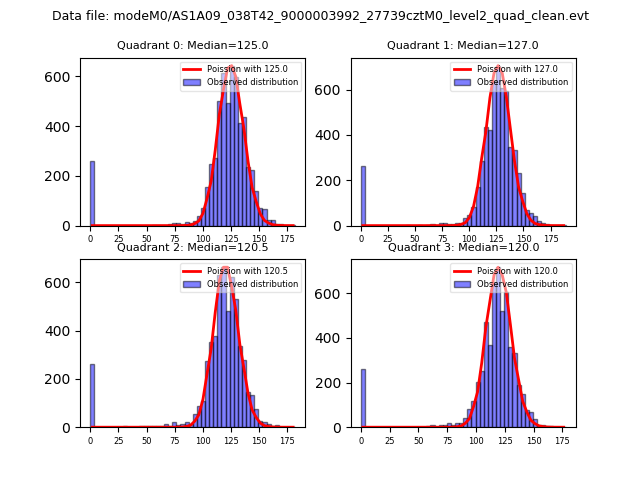 |
 |
| Quadrant-wise count rates Data is divided into 100 sec bins |
 |
|
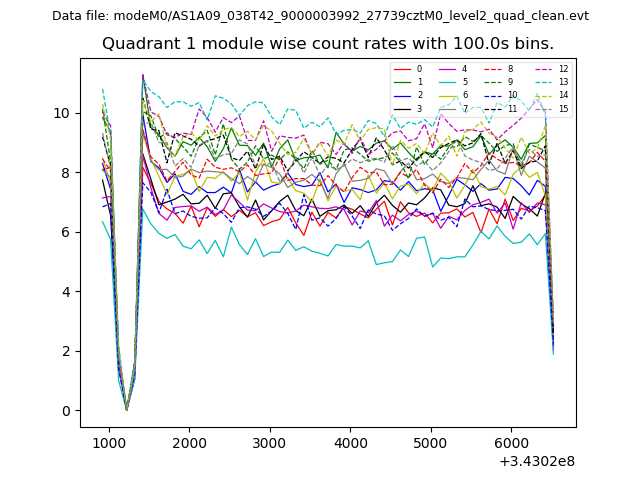
| Module-wise count rates for Quadrant A Data is divided into 100 sec bins |
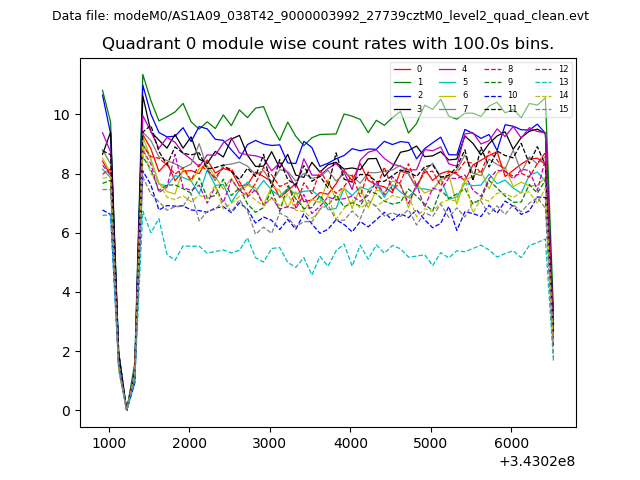 |
 |
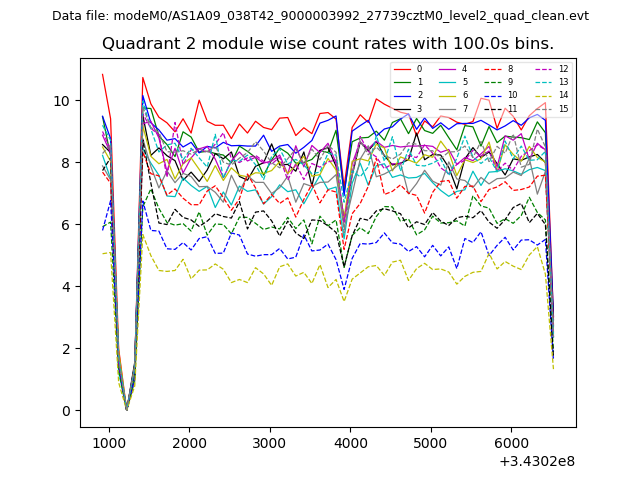
| Module-wise count rates for Quadrant B Data is divided into 100 sec bins |
 |
 |
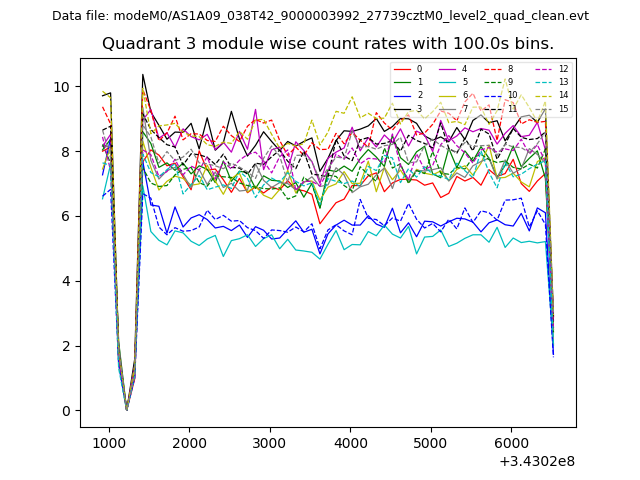
| Module-wise count rates for Quadrant C Data is divided into 100 sec bins |
 |
 |
| Module-wise count rates for Quadrant D Data is divided into 100 sec bins |
 |
 |
| Parameter | Plot |
|---|---|
| CZT HV Monitor | 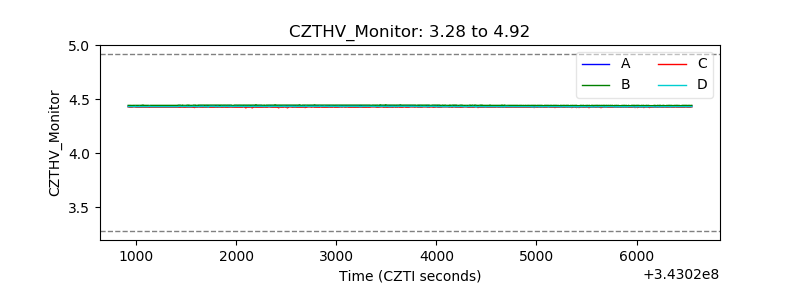 |
| D_VDD | 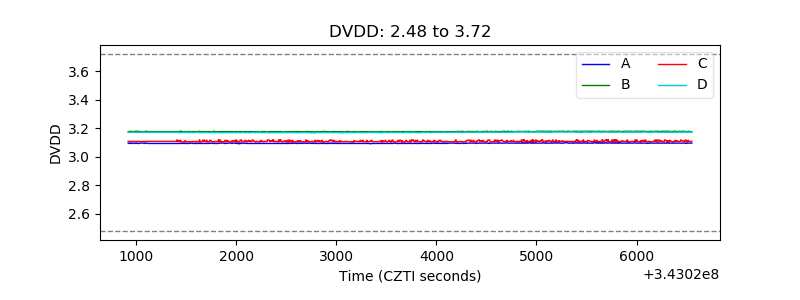 |
| Temperature 1 | 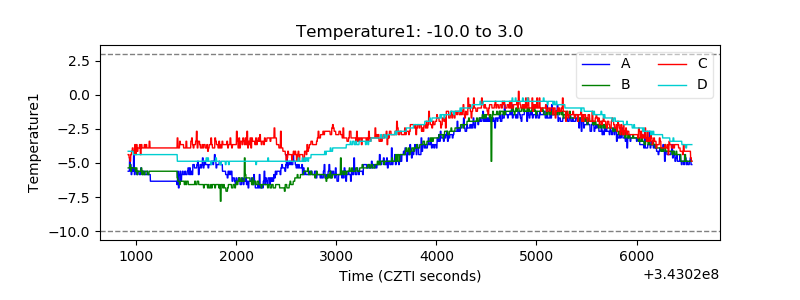 |
| Veto HV Monitor | 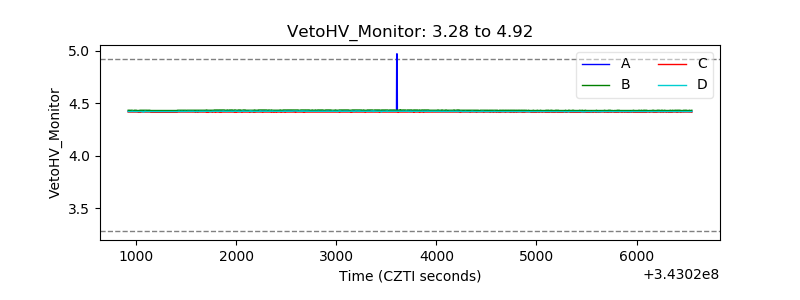 |
| Veto LLD | 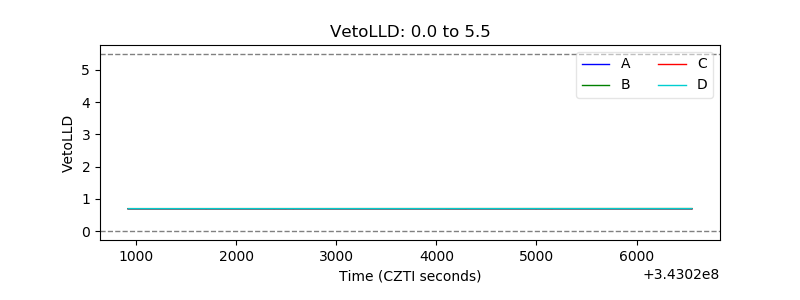 |
| Alpha Counter |  |
| _CPM_Rate | 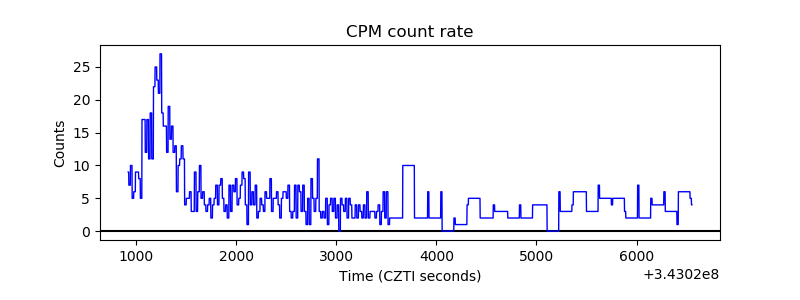 |
| CZT Counter | 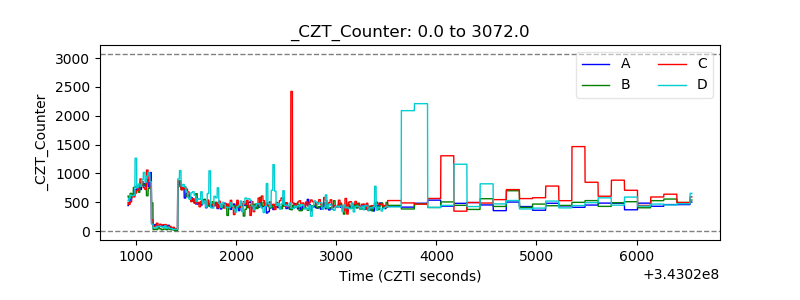 |
| +2.5 Volts monitor |  |
| +5 Volts monitor |  |
| _ROLL_ROT | 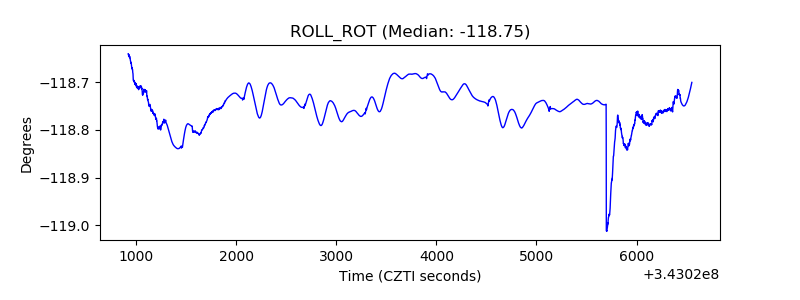 |
| _Roll_DEC | 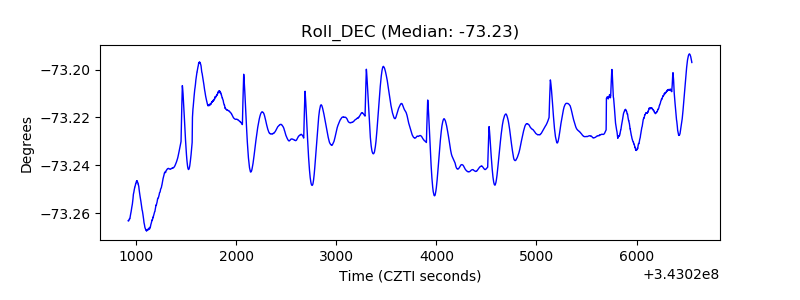 |
| _Roll_RA | 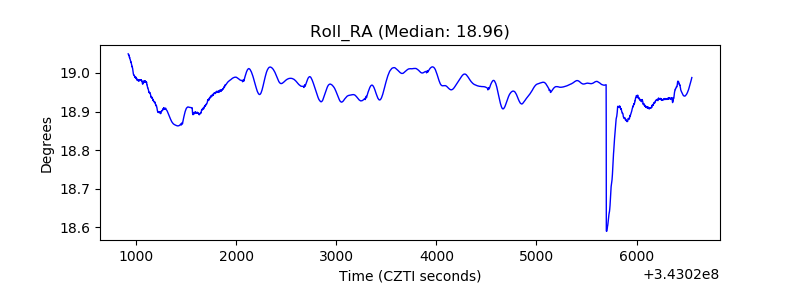 |
| Veto Counter | 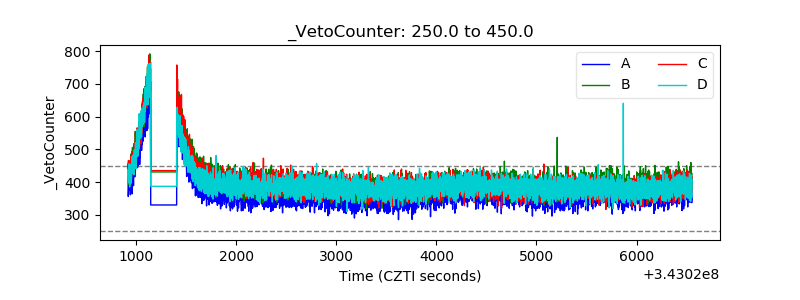 |