| Param | Original file | Final file |
|---|---|---|
| Filename | modeM0/AS1A09_038T43_9000003994_27739cztM0_level2.evt | modeM0/AS1A09_038T43_9000003994_27739cztM0_level2_quad_clean.evt |
| Size (bytes) | 168,125,760 | 42,531,840 |
| Size | 160.3 MB | 40.6 MB |
| Events in quadrant A | 1,117,200 | 287,933 |
| Events in quadrant B | 1,140,422 | 295,057 |
| Events in quadrant C | 1,407,781 | 271,201 |
| Events in quadrant D | 1,270,190 | 270,266 |
| Mode M9 | |||
|---|---|---|---|
| Quadrant | BADHDUFLAG | Total packets | Discarded packets |
| A | 0 | 2 | 0 |
| B | 0 | 2 | 0 |
| C | 0 | 2 | 0 |
| D | 0 | 2 | 0 |
| Mode M0 | |||
|---|---|---|---|
| Quadrant | BADHDUFLAG | Total packets | Discarded packets |
| A | 0 | 4846 | 0 |
| B | 0 | 4864 | 0 |
| C | 0 | 5633 | 0 |
| D | 0 | 5298 | 0 |
| Quadrant | Total seconds | Saturated seconds | Saturation percentage |
|---|---|---|---|
| A | 2261 | 149 | 6.590004% |
| B | 2261 | 164 | 7.253428% |
| C | 2261 | 217 | 9.597523% |
| D | 2261 | 163 | 7.209199% |
Noise dominated data is calculated using 1-second bins in cleaned event files. If a bin has >2000 counts, and if more than 50% of those come from <1% of pixels, then it is considered to be noise-dominated and hence unusable.
| Quadrant | # 1 sec bins | Bins with >0 counts | Bins with >2000 counts | High rate bins dominated by noise | Noise dominated (total time) | Noise dominated (detector-on time) | Marked lightcurve |
|---|---|---|---|---|---|---|---|
| A | 2461 | 2261 | 0 | 0 | 0.00% | 0.00% | 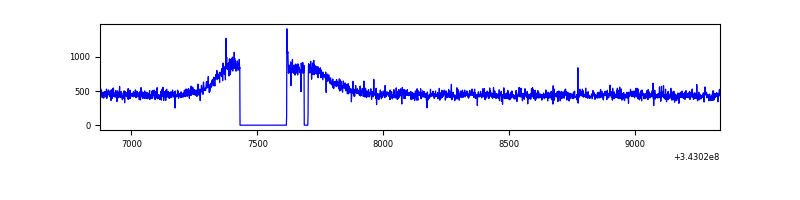 |
| B | 2461 | 2261 | 0 | 0 | 0.00% | 0.00% | 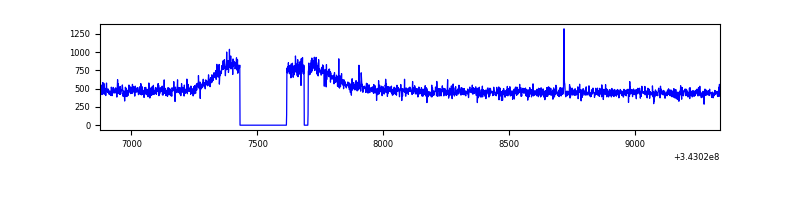 |
| C | 2461 | 2262 | 9 | 9 | 0.37% | 0.40% | 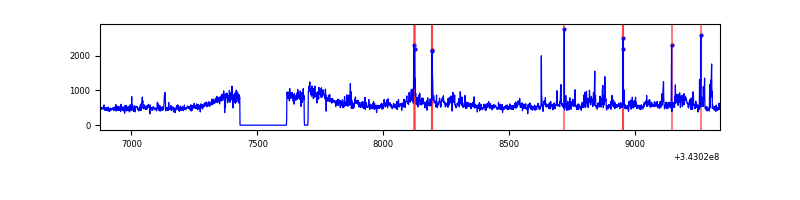 |
| D | 2460 | 2261 | 24 | 24 | 0.98% | 1.06% | 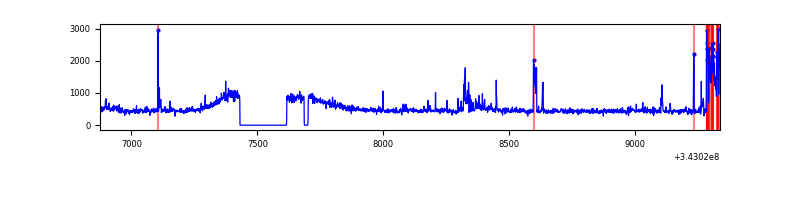 |
Top three noisy pixels from each quadrant. If the there are fewer than three noisy pixels in the level2.evt file, extra rows are filled as -1
| Pixel properties | Quadrant properties | ||||||
|---|---|---|---|---|---|---|---|
| Quadrant | DetID | PixID | Counts | Sigma | Mean | Median | Sigma |
| A | 13 | 254 | 4045 | 62.55 | 287 | 278 | 60.2 |
| A | 8 | 192 | 3426 | 52.27 | 287 | 278 | 60.2 |
| A | 3 | 137 | 2983 | 44.92 | 287 | 278 | 60.2 |
| B | 12 | 111 | 7144 | 117.95 | 288 | 279 | 58.2 |
| B | 11 | 111 | 6501 | 106.9 | 288 | 279 | 58.2 |
| B | 14 | 111 | 5971 | 97.79 | 288 | 279 | 58.2 |
| C | 3 | 233 | 206608 | 3026.81 | 279 | 278 | 68.2 |
| C | 6 | 112 | 63783 | 931.6 | 279 | 278 | 68.2 |
| C | 14 | 238 | 43537 | 634.6 | 279 | 278 | 68.2 |
| D | 11 | 176 | 134314 | 1915.18 | 285 | 275 | 70.0 |
| D | 1 | 52 | 30681 | 434.45 | 285 | 275 | 70.0 |
| D | 2 | 250 | 21279 | 300.11 | 285 | 275 | 70.0 |
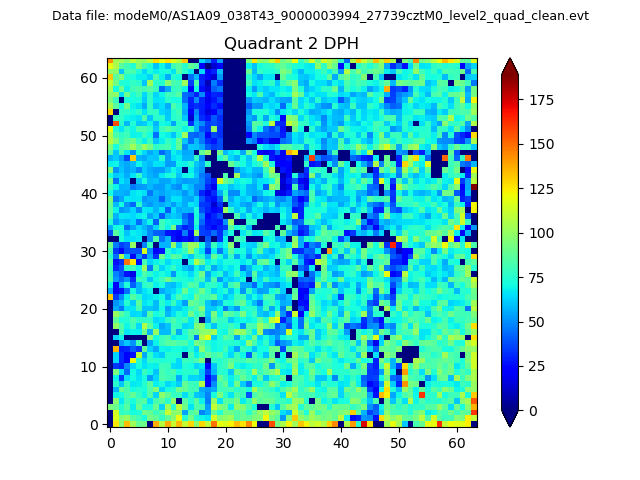
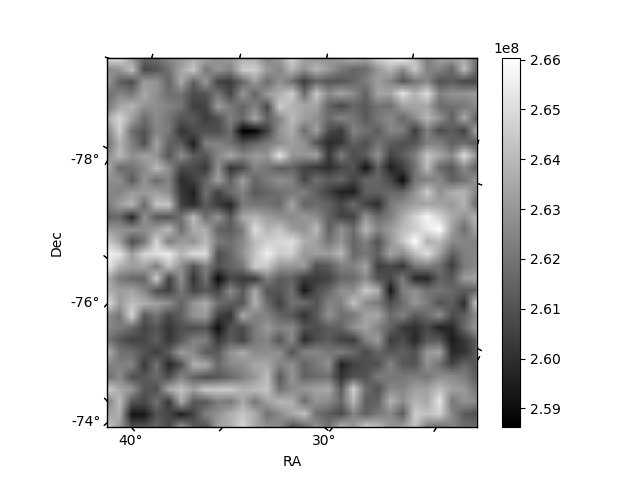
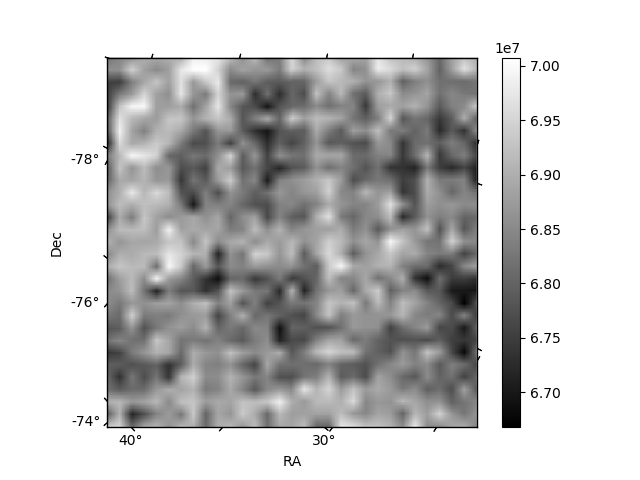
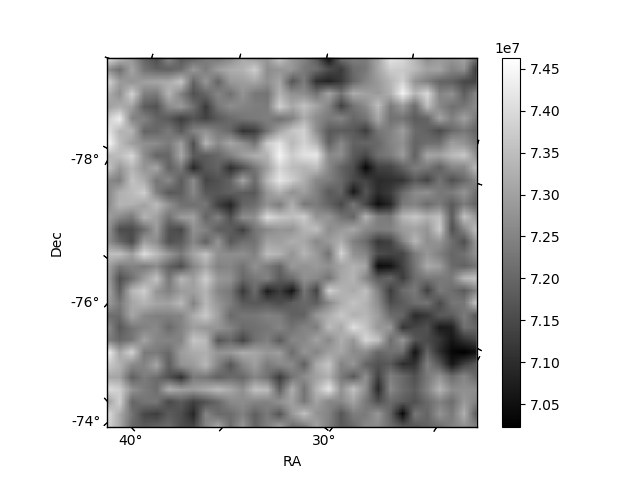
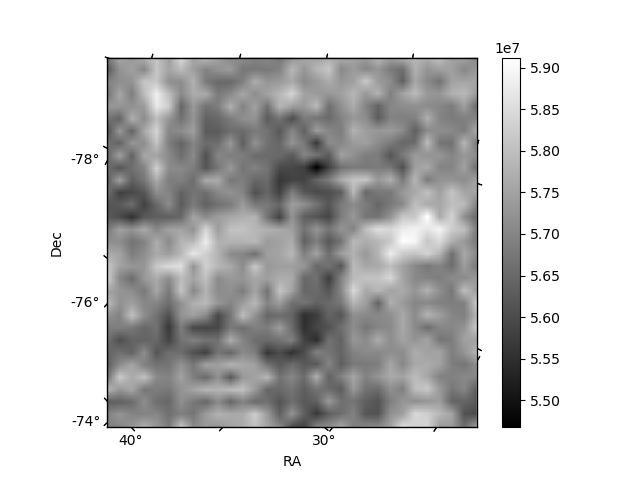
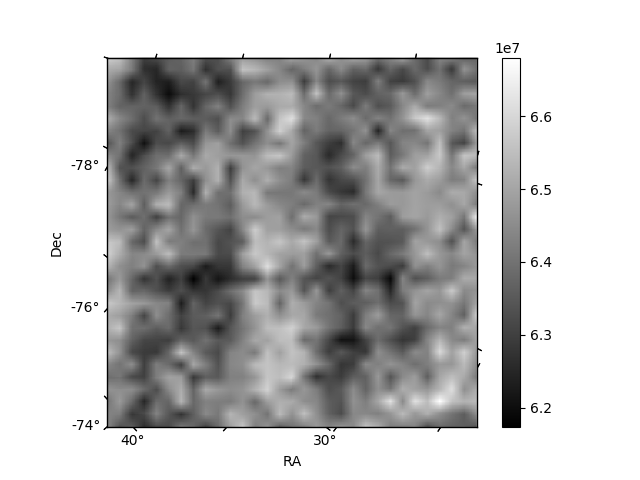
Histogram calculated using DETX and DETY for each event in the final _common_clean file
| Quadrant A | 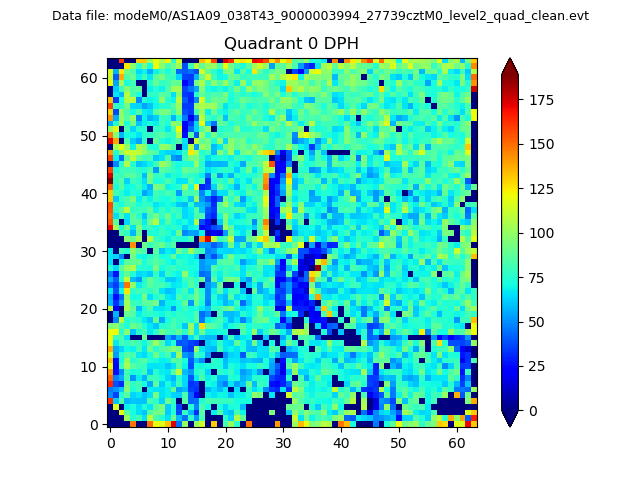 |
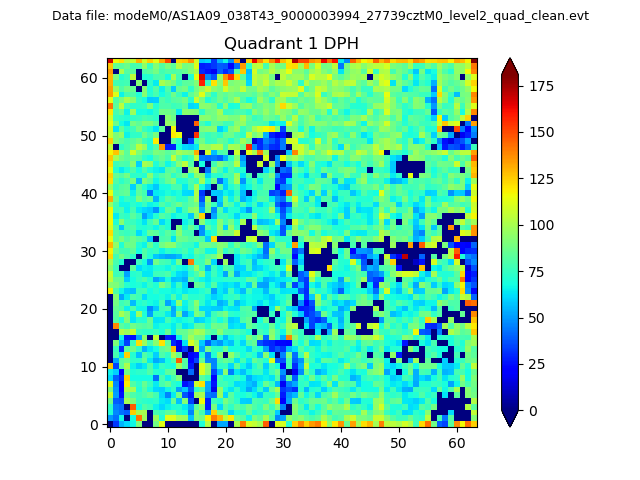 |
Quadrant B |
|---|---|---|---|
| Quadrant D | 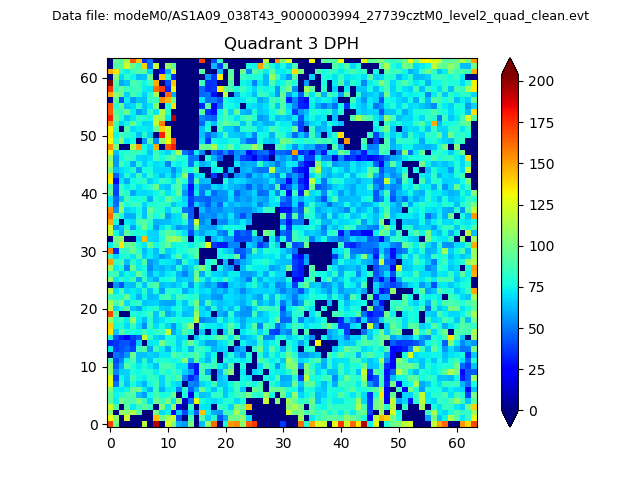 |
 |
Quadrant C |
| Plot type | Count rate plots | Images |
|---|---|---|
| Comparison with Poisson distribution Blue bars denote a histogram of data divided into 1 sec bins. Red curve is a Poisson curve with rate = median count rate of data. |
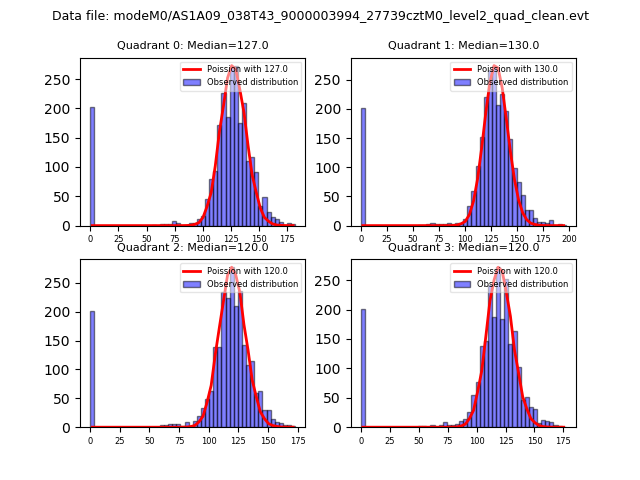 |
 |
| Quadrant-wise count rates Data is divided into 100 sec bins |
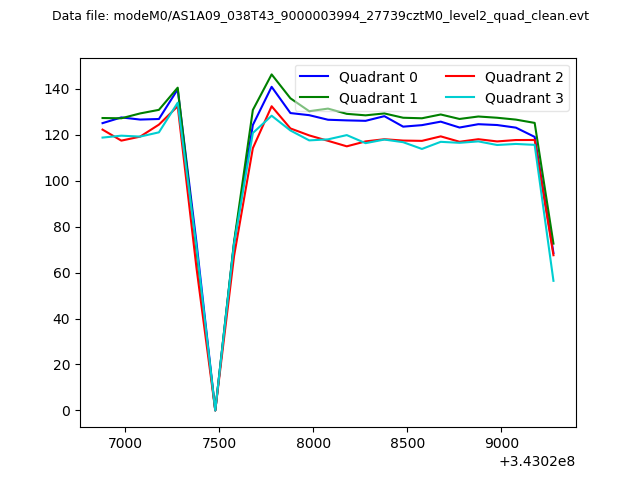 |
|
| Module-wise count rates for Quadrant A Data is divided into 100 sec bins |
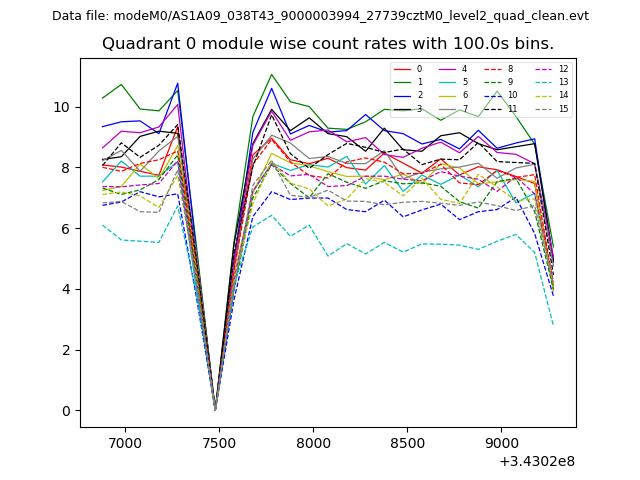 |
 |
| Module-wise count rates for Quadrant B Data is divided into 100 sec bins |
 |
 |
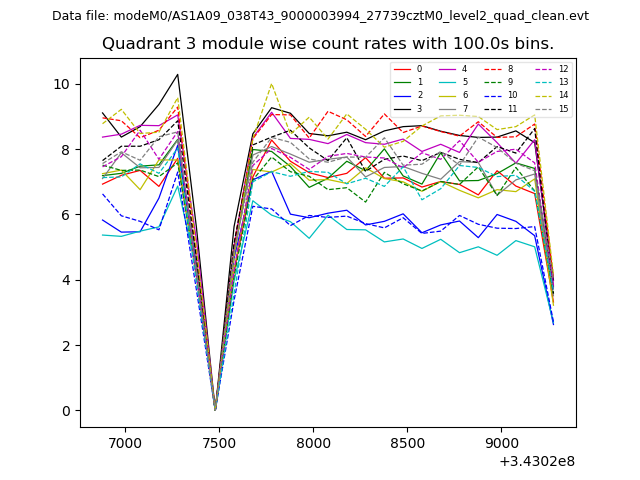
| Module-wise count rates for Quadrant C Data is divided into 100 sec bins |
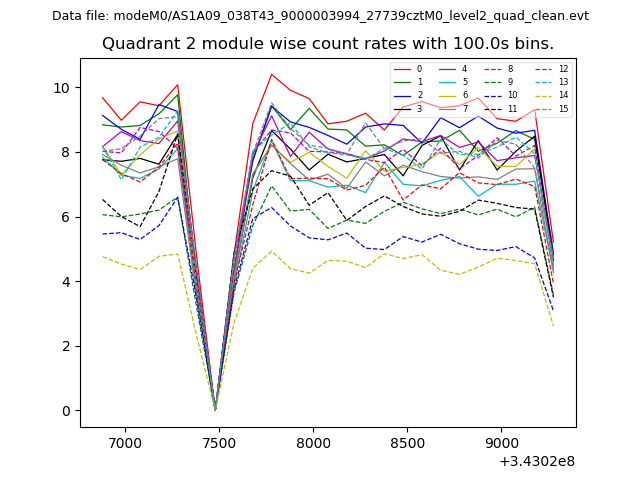 |
 |
| Module-wise count rates for Quadrant D Data is divided into 100 sec bins |
 |
 |
| Parameter | Plot |
|---|---|
| CZT HV Monitor | 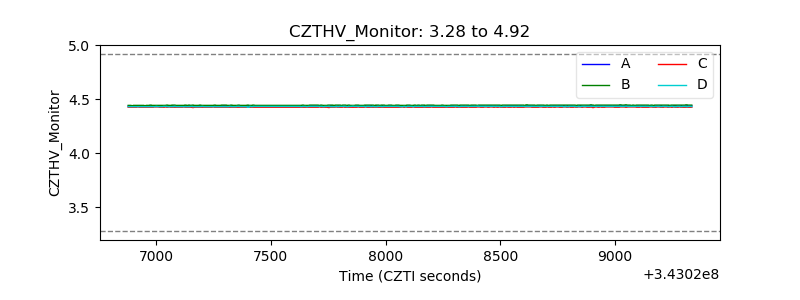 |
| D_VDD | 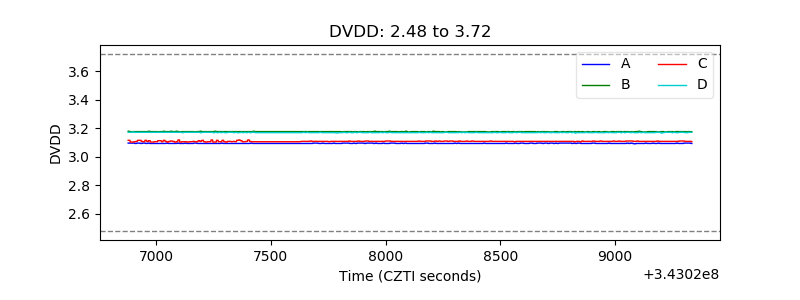 |
| Temperature 1 | 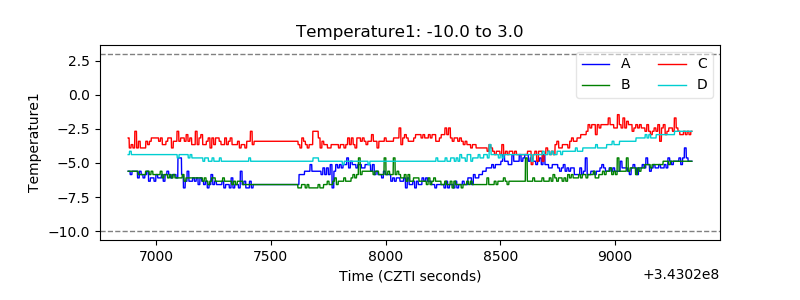 |
| Veto HV Monitor | 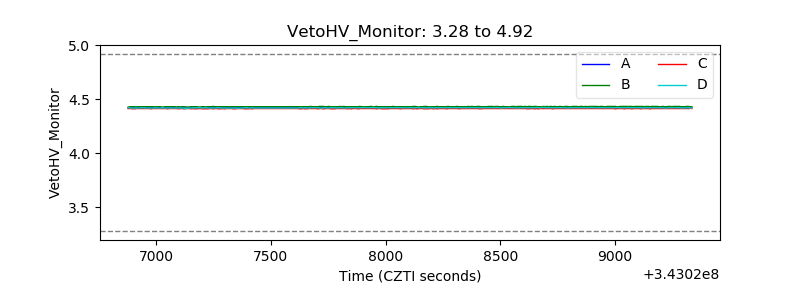 |
| Veto LLD | 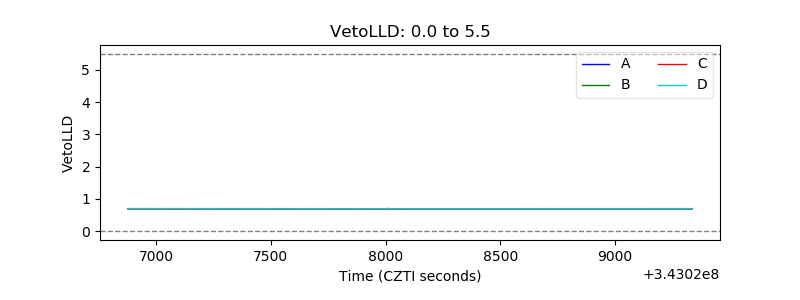 |
| Alpha Counter | 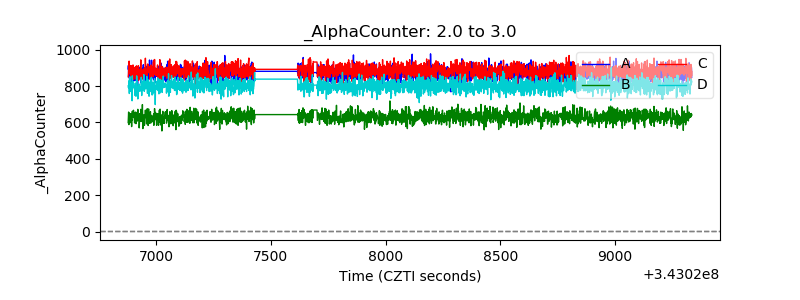 |
| _CPM_Rate |  |
| CZT Counter | 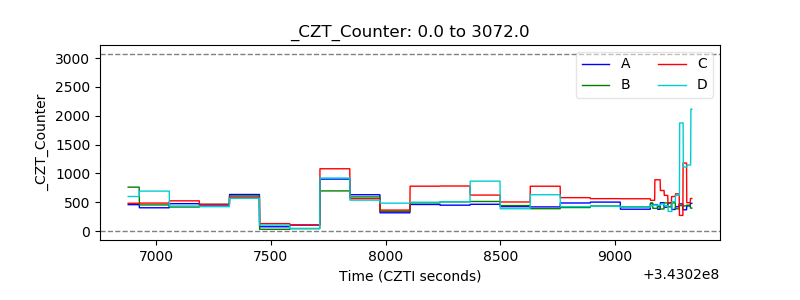 |
| +2.5 Volts monitor | 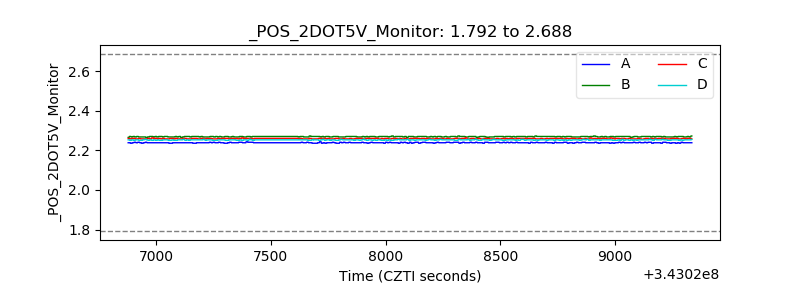 |
| +5 Volts monitor |  |
| _ROLL_ROT | 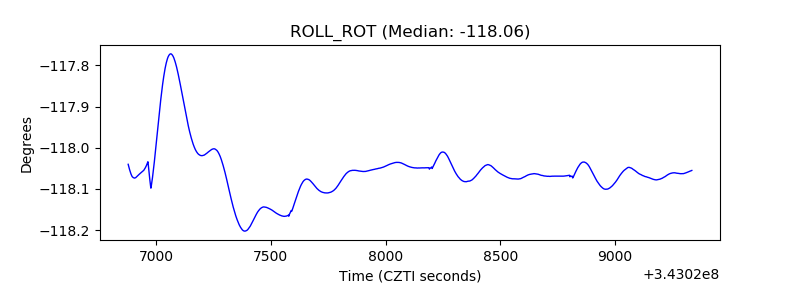 |
| _Roll_DEC | 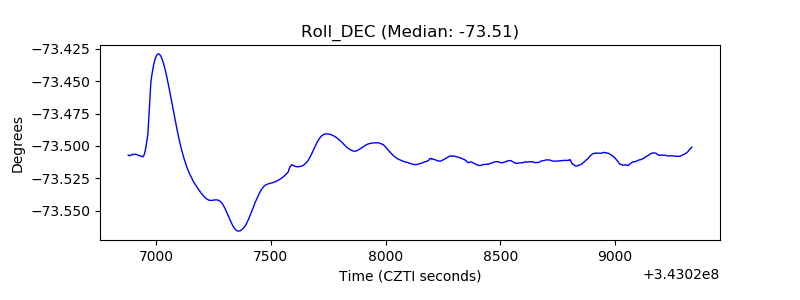 |
| _Roll_RA | 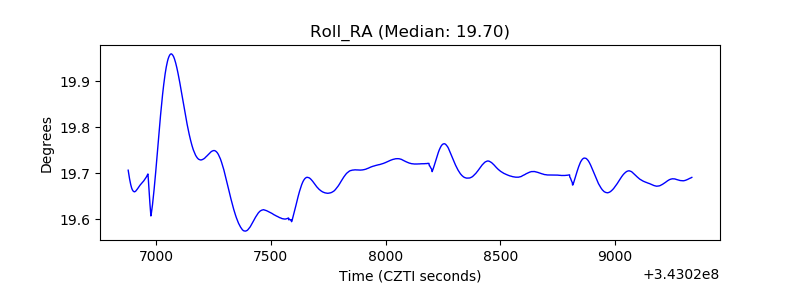 |
| Veto Counter | 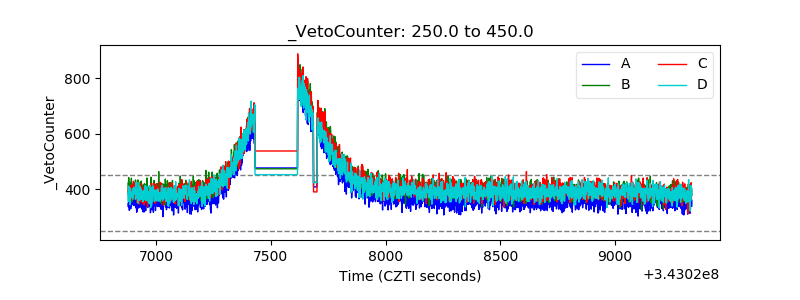 |