| Param | Original file | Final file |
|---|---|---|
| Filename | modeM0/AS1A09_038T43_9000003994_27742cztM0_level2.evt | modeM0/AS1A09_038T43_9000003994_27742cztM0_level2_quad_clean.evt |
| Size (bytes) | 314,573,760 | 84,159,360 |
| Size | 300.0 MB | 80.3 MB |
| Events in quadrant A | 2,044,254 | 564,678 |
| Events in quadrant B | 2,082,146 | 575,964 |
| Events in quadrant C | 2,590,958 | 547,562 |
| Events in quadrant D | 2,497,079 | 538,506 |
| Mode M0 | |||
|---|---|---|---|
| Quadrant | BADHDUFLAG | Total packets | Discarded packets |
| A | 0 | 9228 | 0 |
| B | 0 | 9208 | 0 |
| C | 0 | 10533 | 0 |
| D | 0 | 10587 | 0 |
| Quadrant | Total seconds | Saturated seconds | Saturation percentage |
|---|---|---|---|
| A | 4579 | 5 | 0.109194% |
| B | 4580 | 3 | 0.065502% |
| C | 4580 | 79 | 1.724891% |
| D | 4580 | 47 | 1.026201% |
Noise dominated data is calculated using 1-second bins in cleaned event files. If a bin has >2000 counts, and if more than 50% of those come from <1% of pixels, then it is considered to be noise-dominated and hence unusable.
| Quadrant | # 1 sec bins | Bins with >0 counts | Bins with >2000 counts | High rate bins dominated by noise | Noise dominated (total time) | Noise dominated (detector-on time) | Marked lightcurve |
|---|---|---|---|---|---|---|---|
| A | 4579 | 4579 | 4 | 4 | 0.09% | 0.09% | 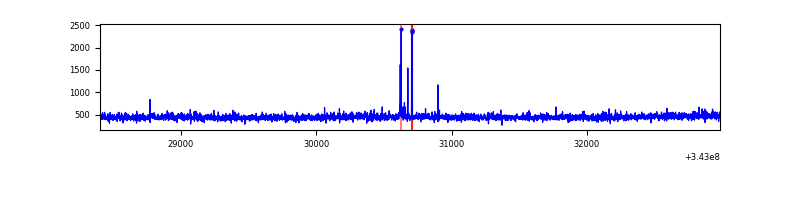 |
| B | 4580 | 4580 | 1 | 1 | 0.02% | 0.02% | 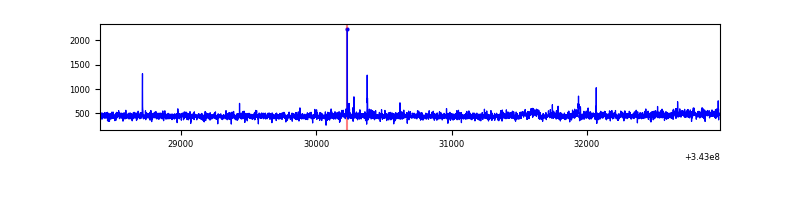 |
| C | 4580 | 4580 | 32 | 32 | 0.70% | 0.70% | 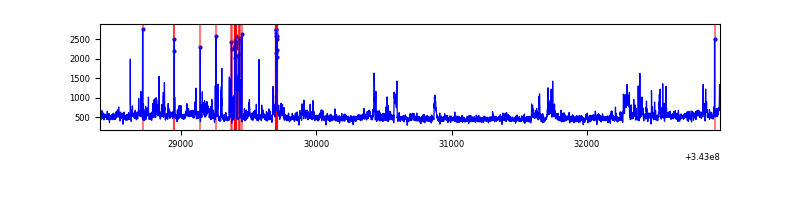 |
| D | 4580 | 4580 | 52 | 52 | 1.14% | 1.14% | 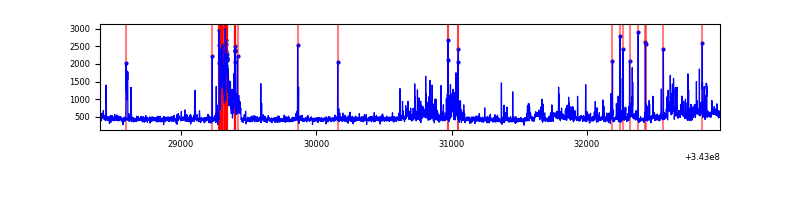 |
Top three noisy pixels from each quadrant. If the there are fewer than three noisy pixels in the level2.evt file, extra rows are filled as -1
| Pixel properties | Quadrant properties | ||||||
|---|---|---|---|---|---|---|---|
| Quadrant | DetID | PixID | Counts | Sigma | Mean | Median | Sigma |
| A | 0 | 13 | 19848 | 182.93 | 522 | 510 | 105.7 |
| A | 13 | 254 | 8394 | 74.58 | 522 | 510 | 105.7 |
| A | 10 | 67 | 6649 | 58.07 | 522 | 510 | 105.7 |
| B | 12 | 111 | 12191 | 117.44 | 520 | 508 | 99.5 |
| B | 0 | 229 | 11709 | 112.6 | 520 | 508 | 99.5 |
| B | 4 | 200 | 11426 | 109.75 | 520 | 508 | 99.5 |
| C | 3 | 233 | 496516 | 4245.43 | 497 | 498 | 116.8 |
| C | 14 | 238 | 79543 | 676.55 | 497 | 498 | 116.8 |
| C | 6 | 112 | 73017 | 620.69 | 497 | 498 | 116.8 |
| D | 1 | 52 | 261620 | 2160.18 | 503 | 487 | 120.9 |
| D | 11 | 176 | 211291 | 1743.84 | 503 | 487 | 120.9 |
| D | 2 | 250 | 57947 | 475.33 | 503 | 487 | 120.9 |
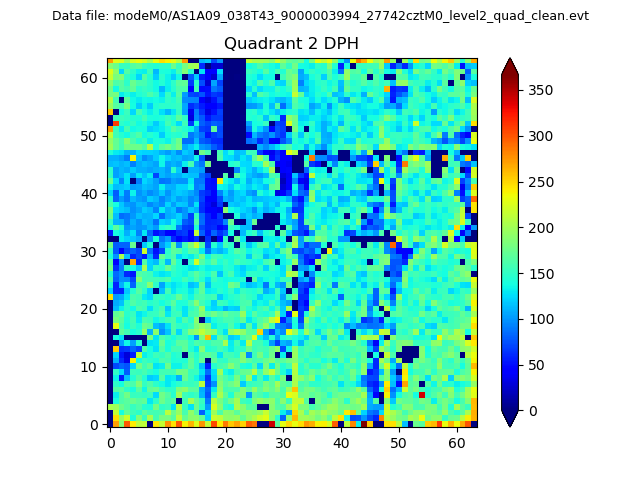
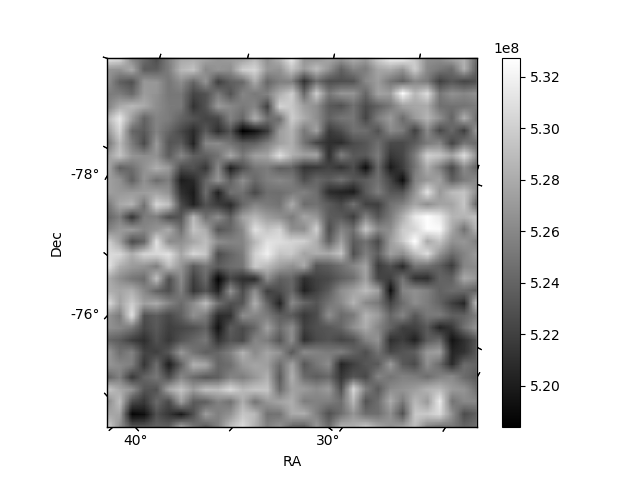
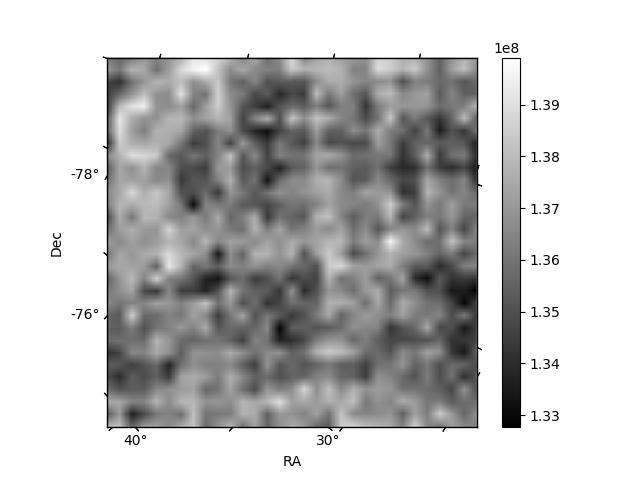
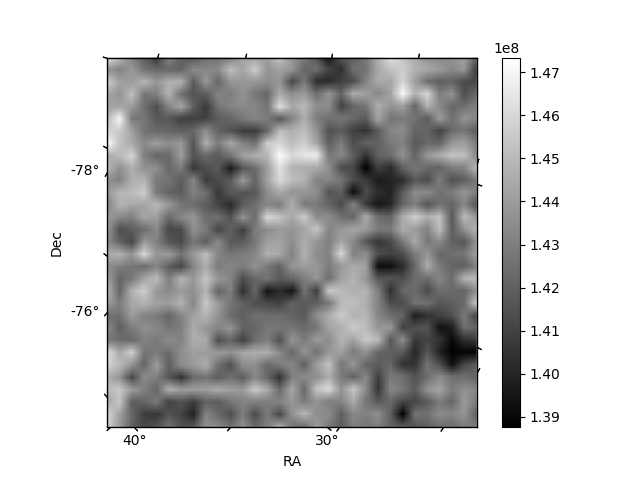
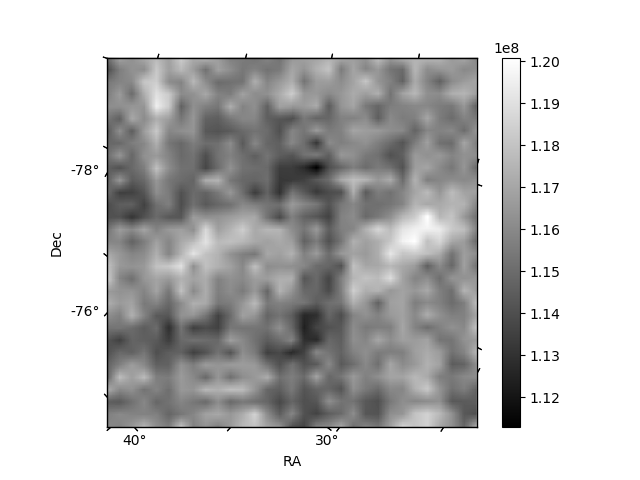
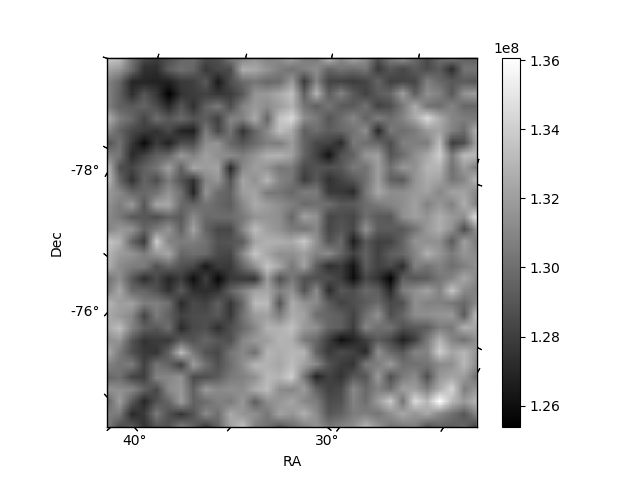
Histogram calculated using DETX and DETY for each event in the final _common_clean file
| Quadrant A | 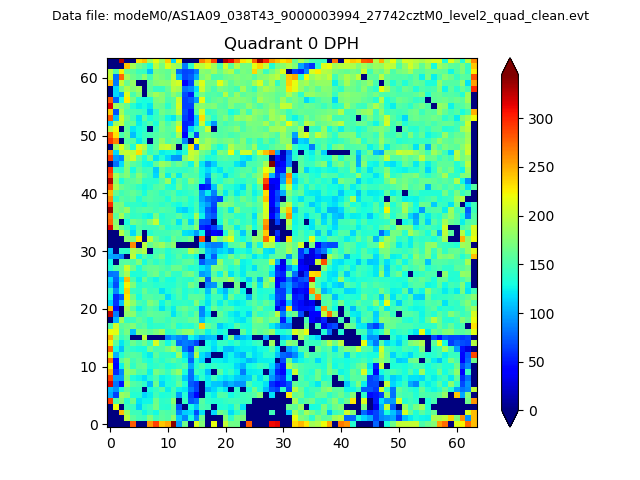 |
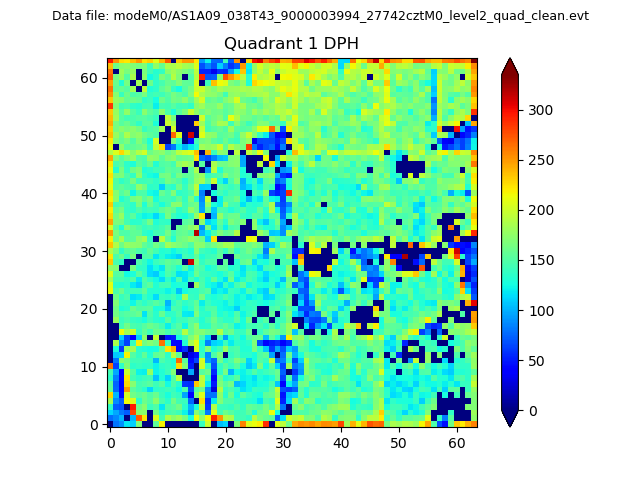 |
Quadrant B |
|---|---|---|---|
| Quadrant D | 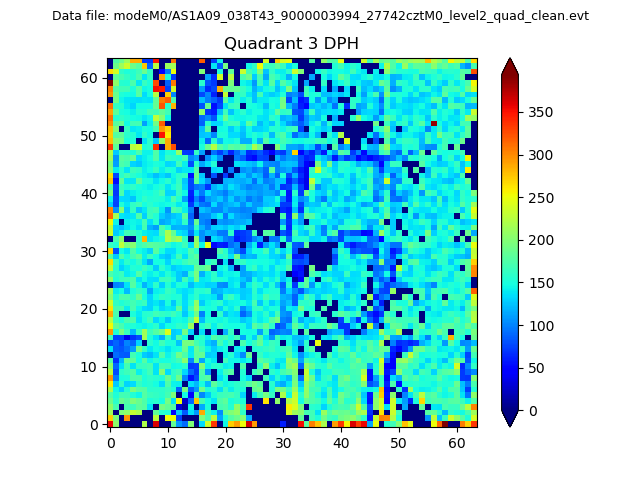 |
 |
Quadrant C |
| Plot type | Count rate plots | Images |
|---|---|---|
| Comparison with Poisson distribution Blue bars denote a histogram of data divided into 1 sec bins. Red curve is a Poisson curve with rate = median count rate of data. |
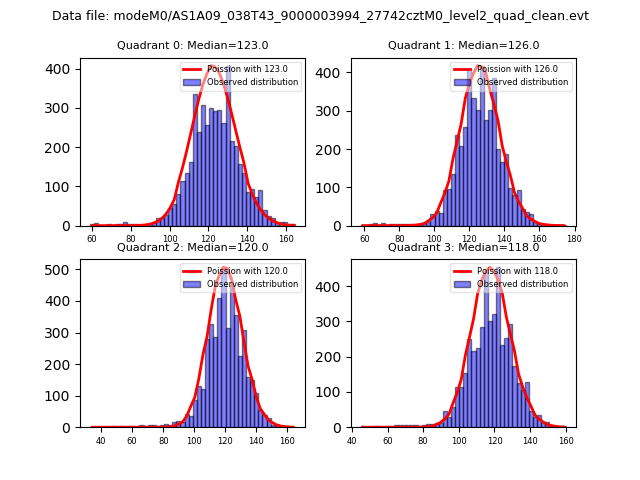 |
 |
| Quadrant-wise count rates Data is divided into 100 sec bins |
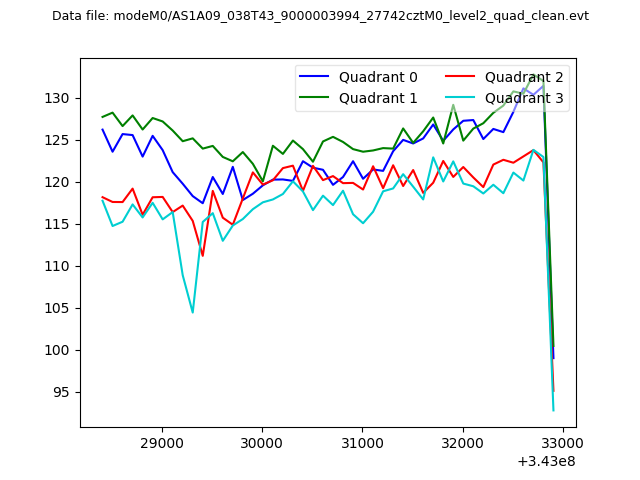 |
|
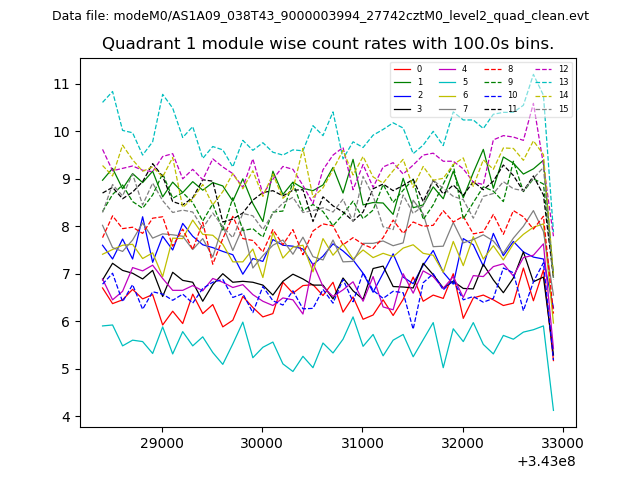
| Module-wise count rates for Quadrant A Data is divided into 100 sec bins |
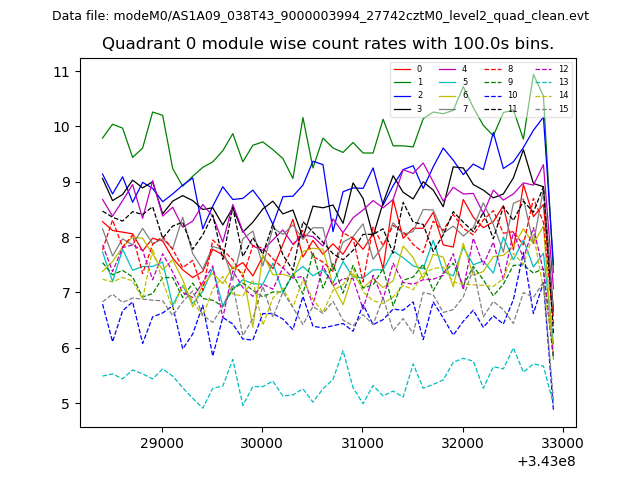 |
 |
| Module-wise count rates for Quadrant B Data is divided into 100 sec bins |
 |
 |
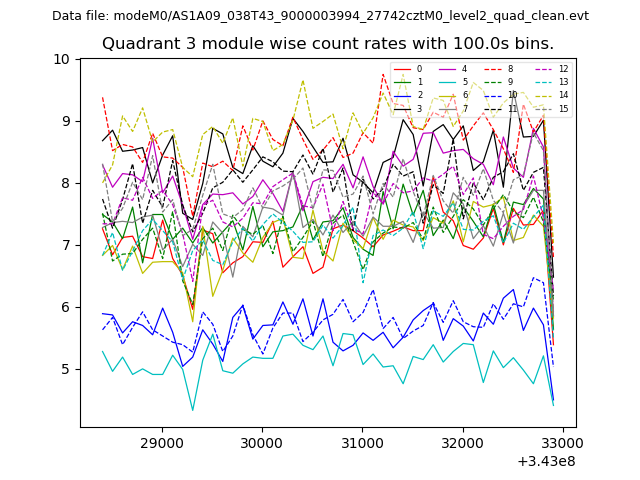
| Module-wise count rates for Quadrant C Data is divided into 100 sec bins |
 |
 |
| Module-wise count rates for Quadrant D Data is divided into 100 sec bins |
 |
 |
| Parameter | Plot |
|---|---|
| CZT HV Monitor | 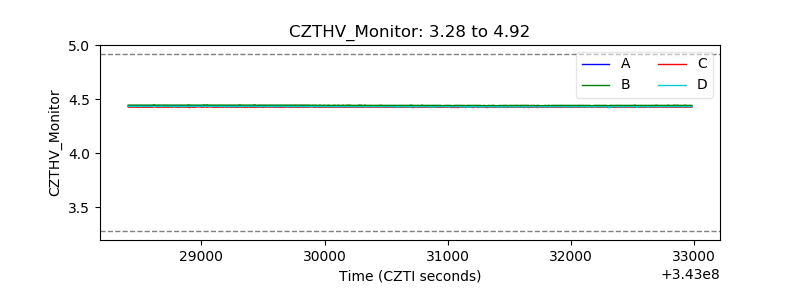 |
| D_VDD | 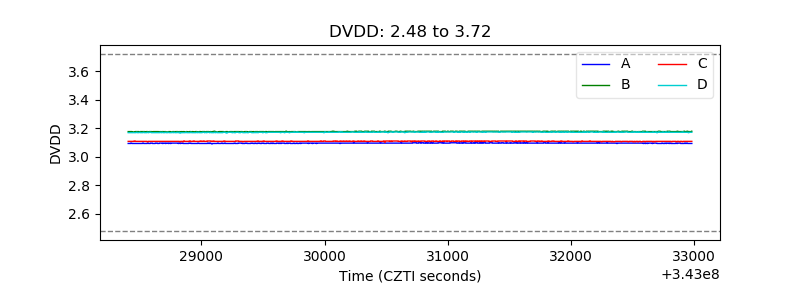 |
| Temperature 1 | 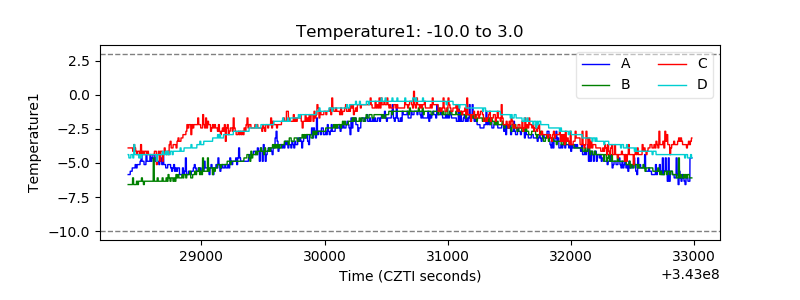 |
| Veto HV Monitor | 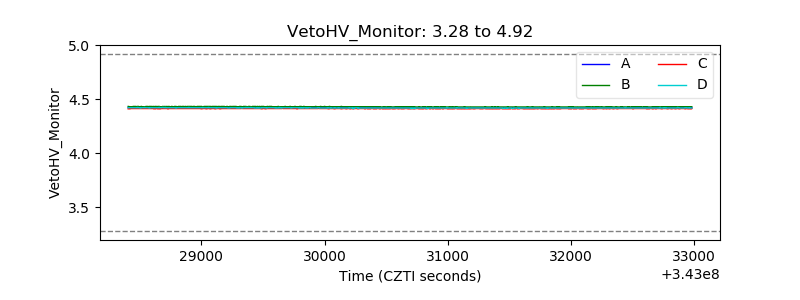 |
| Veto LLD | 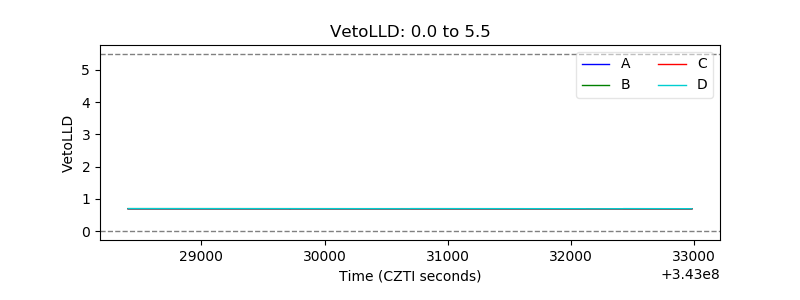 |
| Alpha Counter | 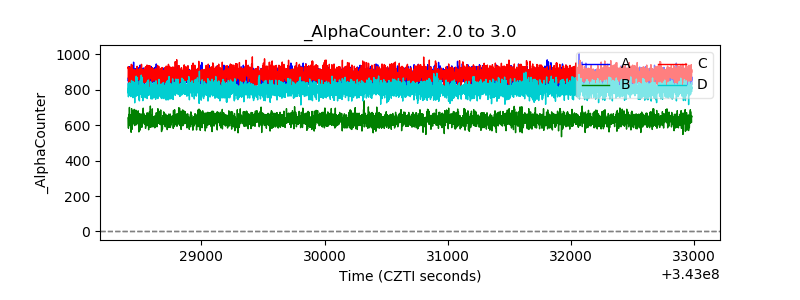 |
| _CPM_Rate |  |
| CZT Counter | 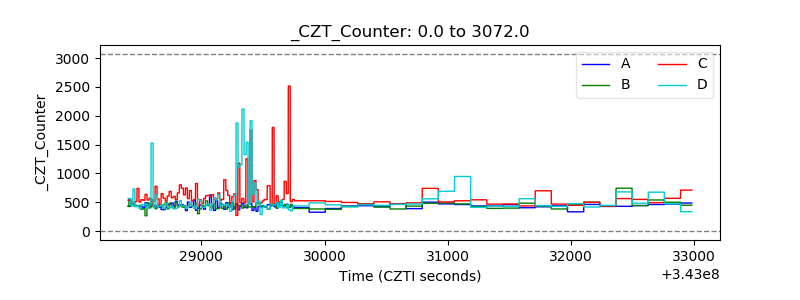 |
| +2.5 Volts monitor |  |
| +5 Volts monitor |  |
| _ROLL_ROT |  |
| _Roll_DEC | 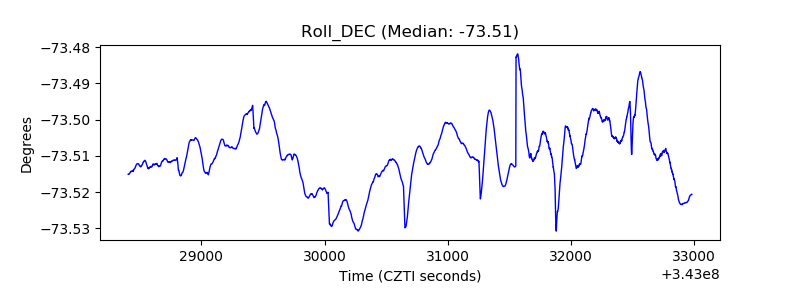 |
| _Roll_RA | 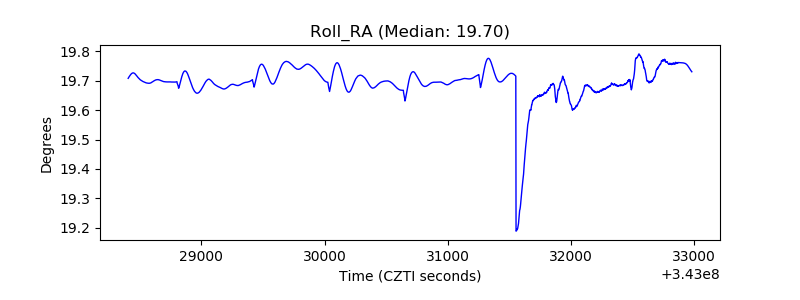 |
| Veto Counter |  |