| Param | Original file | Final file |
|---|---|---|
| Filename | modeM0/AS1A09_038T44_9000003996cztM0_level2.fits | modeM0/AS1A09_038T44_9000003996cztM0_level2_quad_clean.evt |
| Size (bytes) | 56,462,400 | 64,212,480 |
| Size | 53.8 MB | 61.2 MB |
| Events in quadrant A | 337,176 | 398,075 |
| Events in quadrant B | 328,942 | 401,734 |
| Events in quadrant C | 329,732 | 376,402 |
| Events in quadrant D | 289,662 | 343,582 |
| Mode SS | |||
|---|---|---|---|
| Quadrant | BADHDUFLAG | Total packets | Discarded packets |
| A | 0 | 124 | 0 |
| B | 0 | 124 | 0 |
| C | 0 | 124 | 0 |
| D | 0 | 124 | 0 |
| Mode M9 | |||
|---|---|---|---|
| Quadrant | BADHDUFLAG | Total packets | Discarded packets |
| A | 0 | 10 | 0 |
| B | 0 | 10 | 0 |
| C | 0 | 10 | 0 |
| D | 0 | 10 | 0 |
| Mode M0 | |||
|---|---|---|---|
| Quadrant | BADHDUFLAG | Total packets | Discarded packets |
| A | 0 | 13163 | 0 |
| B | 0 | 12817 | 0 |
| C | 0 | 15538 | 0 |
| D | 0 | 15857 | 0 |
| Quadrant | Total seconds | Saturated seconds | Saturation percentage |
|---|---|---|---|
| A | 6079 | 189 | 3.109064% |
| B | 6079 | 160 | 2.632012% |
| C | 6079 | 322 | 5.296924% |
| D | 6079 | 297 | 4.885672% |
Noise dominated data is calculated using 1-second bins in cleaned event files. If a bin has >2000 counts, and if more than 50% of those come from <1% of pixels, then it is considered to be noise-dominated and hence unusable.
| Quadrant | # 1 sec bins | Bins with >0 counts | Bins with >2000 counts | High rate bins dominated by noise | Noise dominated (total time) | Noise dominated (detector-on time) | Marked lightcurve |
|---|---|---|---|---|---|---|---|
| A | 6463 | 6076 | 0 | 0 | 0.00% | 0.00% |  |
| B | 6463 | 6077 | 0 | 0 | 0.00% | 0.00% |  |
| C | 6463 | 6077 | 0 | 0 | 0.00% | 0.00% |  |
| D | 6463 | 6073 | 0 | 0 | 0.00% | 0.00% |  |
Top three noisy pixels from each quadrant. If the there are fewer than three noisy pixels in the level2.evt file, extra rows are filled as -1
| Pixel properties | Quadrant properties | ||||||
|---|---|---|---|---|---|---|---|
| Quadrant | DetID | PixID | Counts | Sigma | Mean | Median | Sigma |
| A | 0 | 29 | 283 | 8.45 | 87 | 82 | 23.8 |
| A | 9 | 19 | 270 | 7.9 | 87 | 82 | 23.8 |
| A | 7 | 110 | 261 | 7.52 | 87 | 82 | 23.8 |
| B | 14 | 254 | 236 | 7.88 | 87 | 83 | 19.4 |
| B | 3 | 17 | 235 | 7.83 | 87 | 83 | 19.4 |
| B | 2 | 9 | 234 | 7.77 | 87 | 83 | 19.4 |
| C | 1 | 80 | 273 | 8.06 | 86 | 81 | 23.8 |
| C | 1 | 81 | 269 | 7.9 | 86 | 81 | 23.8 |
| C | 3 | 202 | 263 | 7.64 | 86 | 81 | 23.8 |
| D | 6 | 38 | 215 | 5.92 | 82 | 75 | 23.6 |
| D | 3 | 14 | 211 | 5.75 | 82 | 75 | 23.6 |
| D | 6 | 67 | 205 | 5.5 | 82 | 75 | 23.6 |
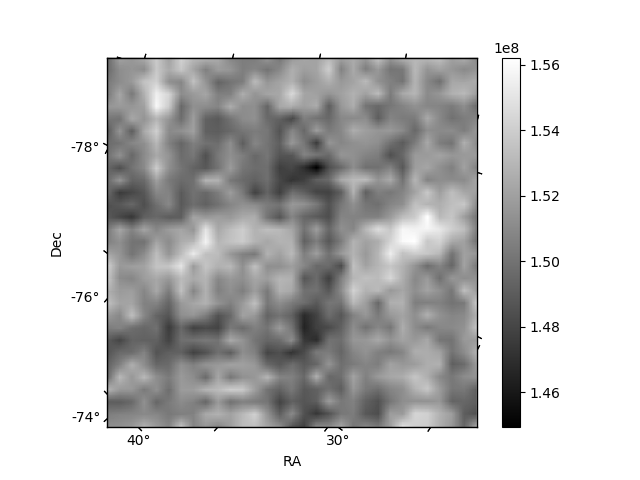
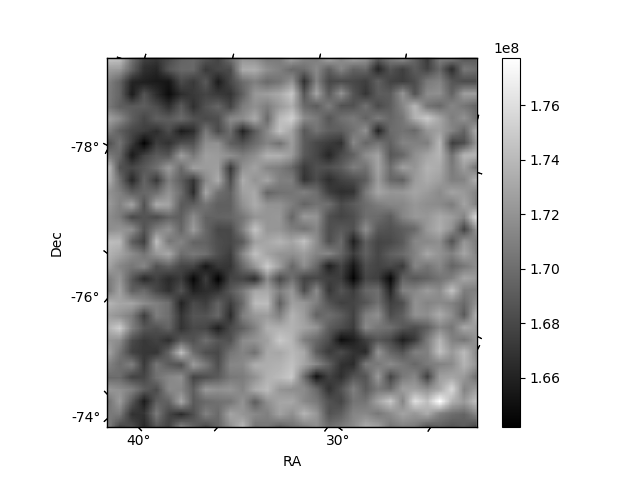
Histogram calculated using DETX and DETY for each event in the final _common_clean file
| Quadrant A | 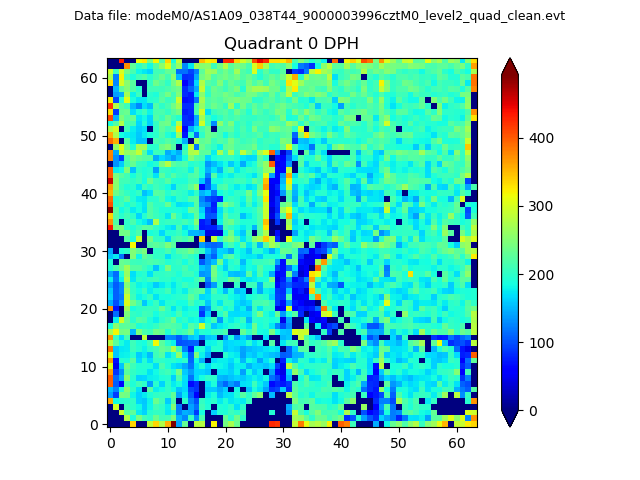 |
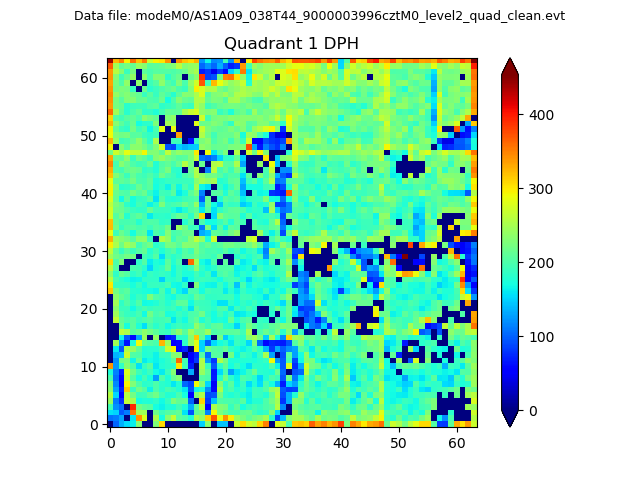 |
Quadrant B |
|---|---|---|---|
| Quadrant D |  |
 |
Quadrant C |
| Plot type | Count rate plots | Images |
|---|---|---|
| Comparison with Poisson distribution Blue bars denote a histogram of data divided into 1 sec bins. Red curve is a Poisson curve with rate = median count rate of data. |
 |
 |
| Quadrant-wise count rates Data is divided into 100 sec bins |
 |
|
| Module-wise count rates for Quadrant A Data is divided into 100 sec bins |
 |
 |
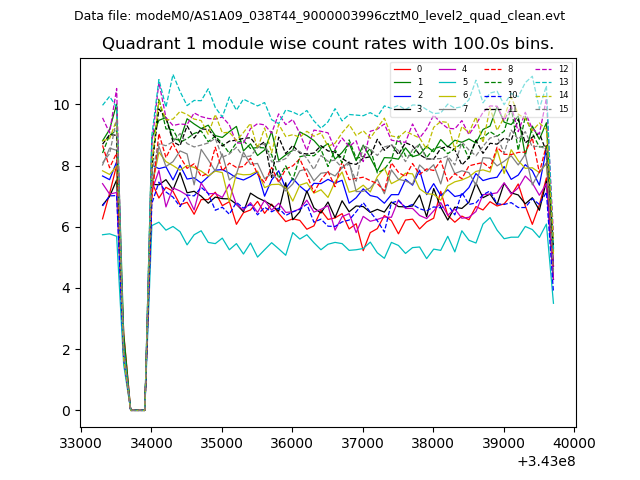
| Module-wise count rates for Quadrant B Data is divided into 100 sec bins |
 |
 |
| Module-wise count rates for Quadrant C Data is divided into 100 sec bins |
 |
 |
| Module-wise count rates for Quadrant D Data is divided into 100 sec bins |
 |
 |
| Parameter | Plot |
|---|---|
| CZT HV Monitor |  |
| D_VDD | 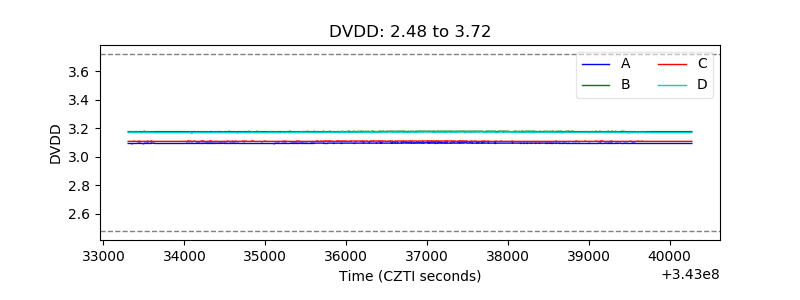 |
| Temperature 1 |  |
| Veto HV Monitor | 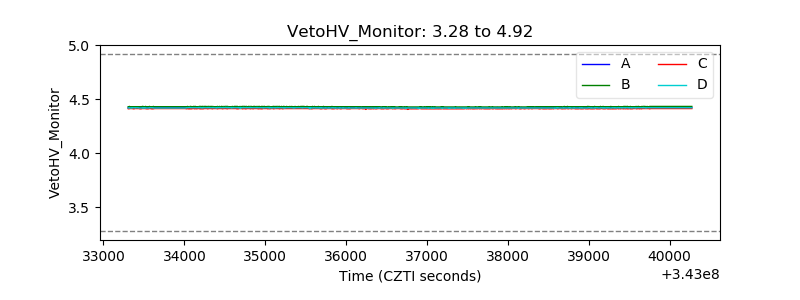 |
| Veto LLD | 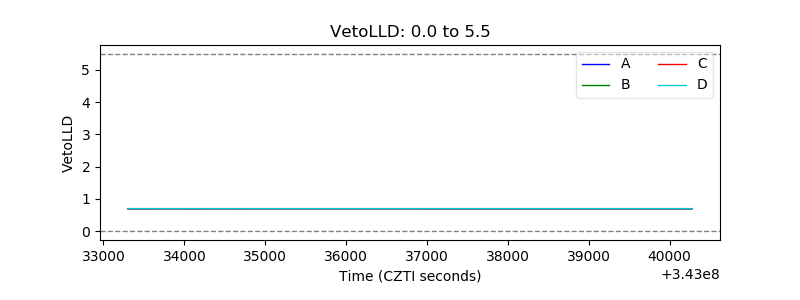 |
| Alpha Counter | 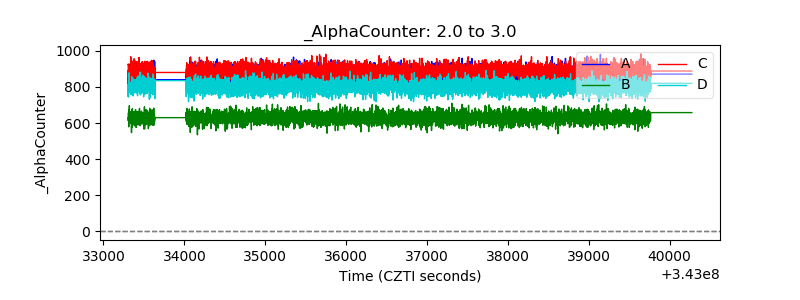 |
| _CPM_Rate | 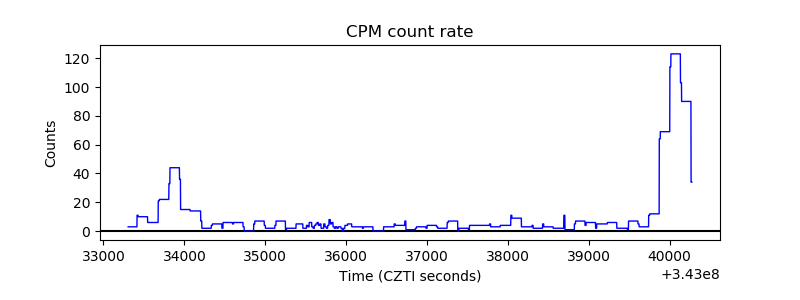 |
| CZT Counter | 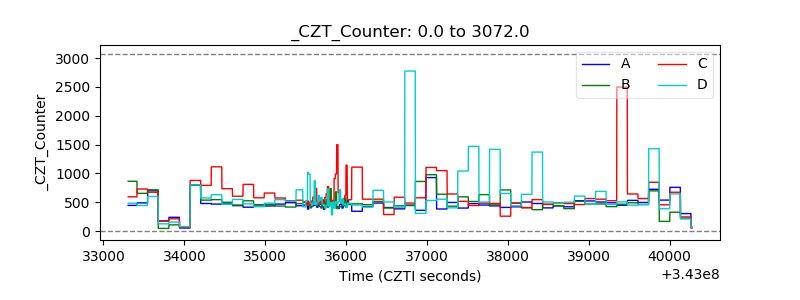 |
| +2.5 Volts monitor | 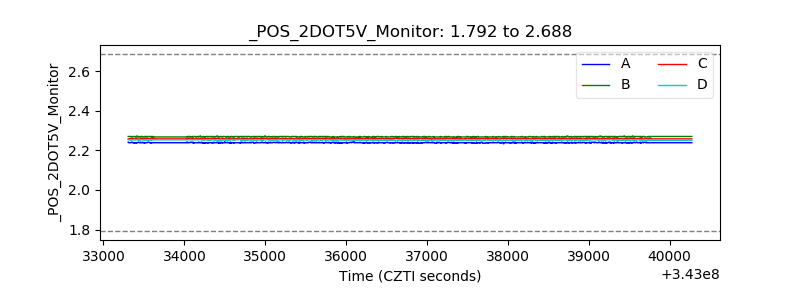 |
| +5 Volts monitor |  |
| _ROLL_ROT |  |
| _Roll_DEC |  |
| _Roll_RA |  |
| Veto Counter | 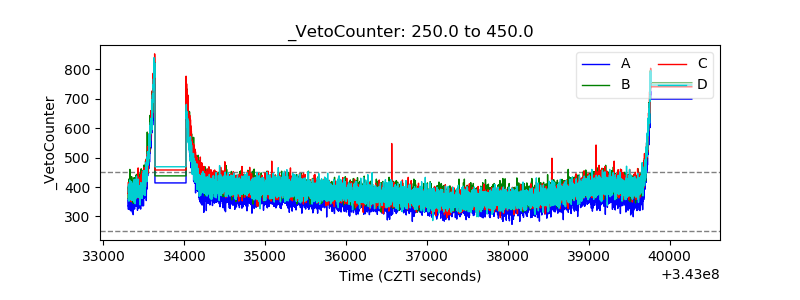 |