| Param | Original file | Final file |
|---|---|---|
| Filename | modeM0/AS1A09_038T44_9000003996_27742cztM0_level2.evt | modeM0/AS1A09_038T44_9000003996_27742cztM0_level2_quad_clean.evt |
| Size (bytes) | 476,948,160 | 111,594,240 |
| Size | 454.9 MB | 106.4 MB |
| Events in quadrant A | 3,078,597 | 751,293 |
| Events in quadrant B | 3,004,523 | 768,977 |
| Events in quadrant C | 3,941,470 | 724,884 |
| Events in quadrant D | 4,007,226 | 710,145 |
| Mode M9 | |||
|---|---|---|---|
| Quadrant | BADHDUFLAG | Total packets | Discarded packets |
| A | 0 | 10 | 0 |
| B | 0 | 10 | 0 |
| C | 0 | 10 | 0 |
| D | 0 | 10 | 0 |
| Mode M0 | |||
|---|---|---|---|
| Quadrant | BADHDUFLAG | Total packets | Discarded packets |
| A | 0 | 13163 | 0 |
| B | 0 | 12817 | 0 |
| C | 0 | 15538 | 0 |
| D | 0 | 15857 | 0 |
| Quadrant | Total seconds | Saturated seconds | Saturation percentage |
|---|---|---|---|
| A | 6079 | 189 | 3.109064% |
| B | 6079 | 160 | 2.632012% |
| C | 6079 | 322 | 5.296924% |
| D | 6079 | 297 | 4.885672% |
Noise dominated data is calculated using 1-second bins in cleaned event files. If a bin has >2000 counts, and if more than 50% of those come from <1% of pixels, then it is considered to be noise-dominated and hence unusable.
| Quadrant | # 1 sec bins | Bins with >0 counts | Bins with >2000 counts | High rate bins dominated by noise | Noise dominated (total time) | Noise dominated (detector-on time) | Marked lightcurve |
|---|---|---|---|---|---|---|---|
| A | 6463 | 6078 | 39 | 39 | 0.60% | 0.64% | 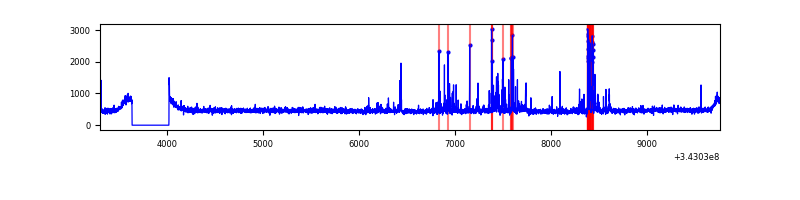 |
| B | 6463 | 6078 | 0 | 0 | 0.00% | 0.00% | 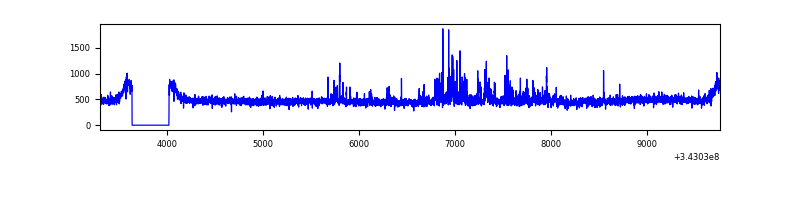 |
| C | 6463 | 6078 | 61 | 61 | 0.94% | 1.00% | 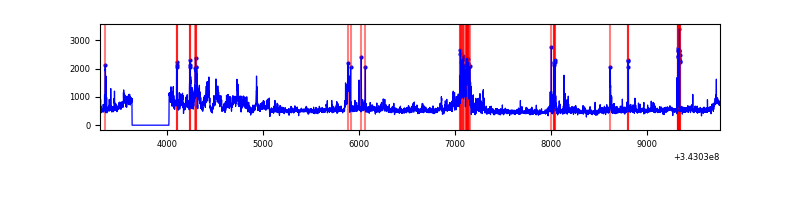 |
| D | 6463 | 6078 | 162 | 162 | 2.51% | 2.67% | 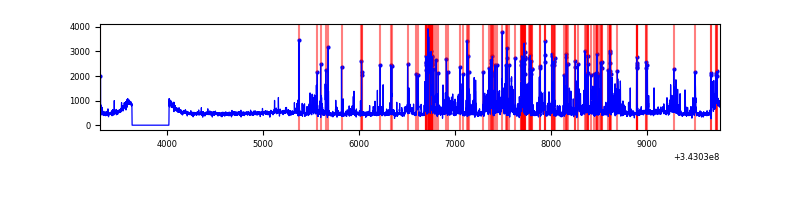 |
Top three noisy pixels from each quadrant. If the there are fewer than three noisy pixels in the level2.evt file, extra rows are filled as -1
| Pixel properties | Quadrant properties | ||||||
|---|---|---|---|---|---|---|---|
| Quadrant | DetID | PixID | Counts | Sigma | Mean | Median | Sigma |
| A | 0 | 13 | 278513 | 1884.48 | 722 | 705 | 147.4 |
| A | 13 | 254 | 10993 | 69.79 | 722 | 705 | 147.4 |
| A | 10 | 67 | 7474 | 45.92 | 722 | 705 | 147.4 |
| B | 0 | 229 | 85886 | 615.31 | 721 | 701 | 138.4 |
| B | 0 | 190 | 34912 | 247.11 | 721 | 701 | 138.4 |
| B | 0 | 230 | 24856 | 174.48 | 721 | 701 | 138.4 |
| C | 3 | 233 | 1092605 | 6701.41 | 690 | 692 | 162.9 |
| C | 14 | 238 | 110681 | 675.04 | 690 | 692 | 162.9 |
| C | 15 | 208 | 50076 | 303.08 | 690 | 692 | 162.9 |
| D | 1 | 52 | 1074289 | 6401.01 | 696 | 674 | 167.7 |
| D | 2 | 250 | 174521 | 1036.49 | 696 | 674 | 167.7 |
| D | 7 | 80 | 34087 | 199.21 | 696 | 674 | 167.7 |
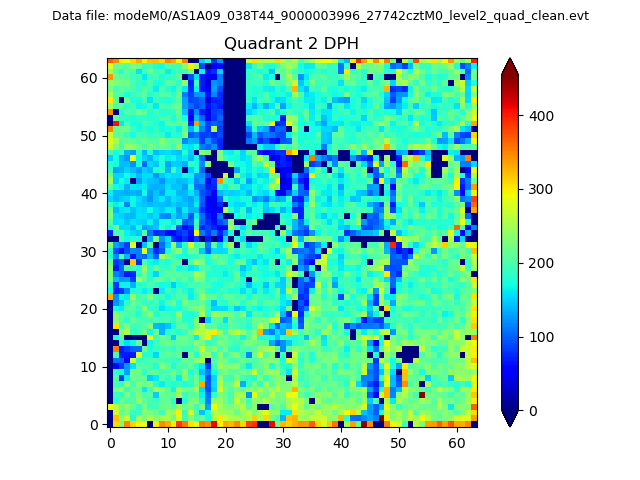
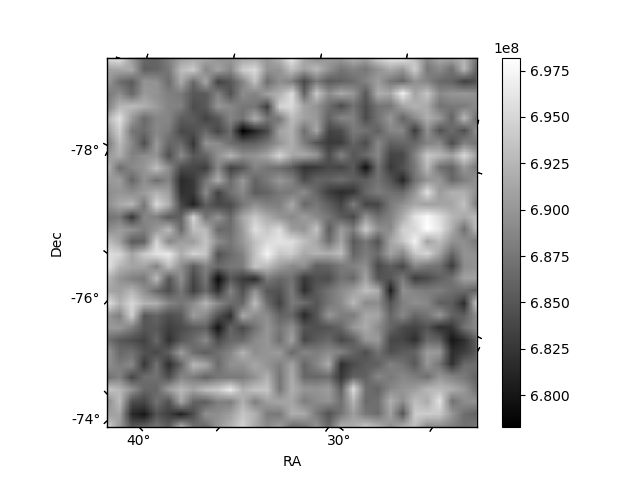
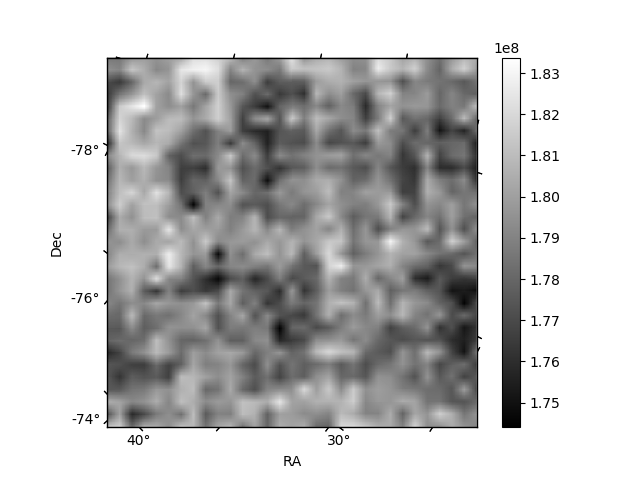
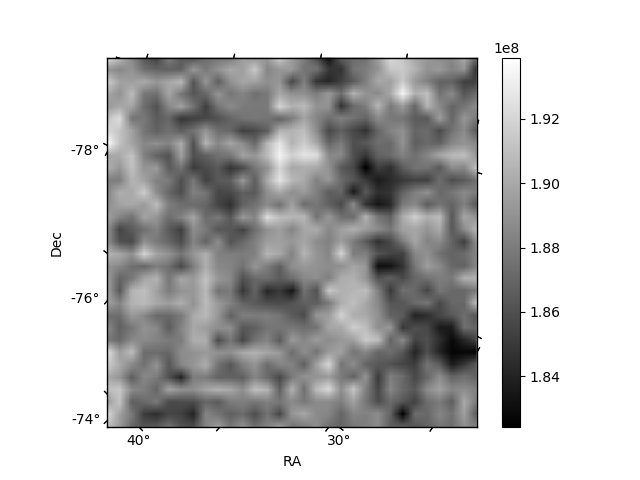
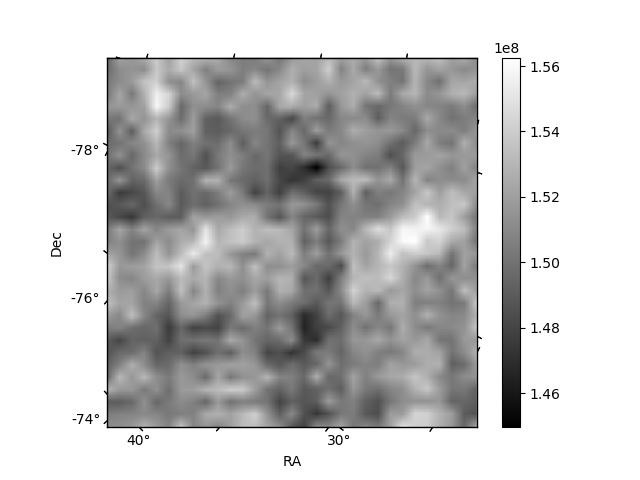
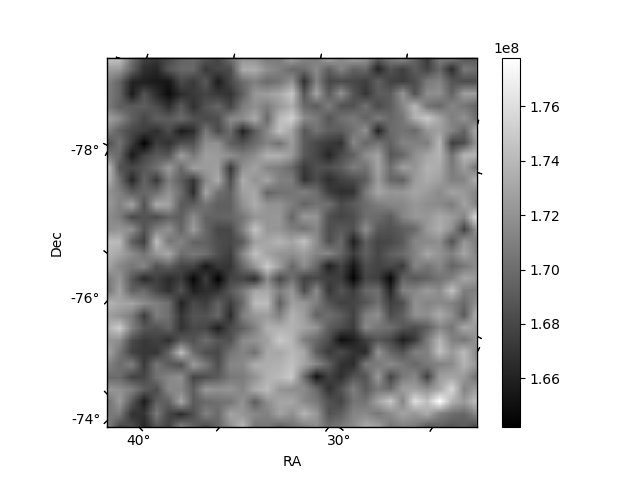
Histogram calculated using DETX and DETY for each event in the final _common_clean file
| Quadrant A | 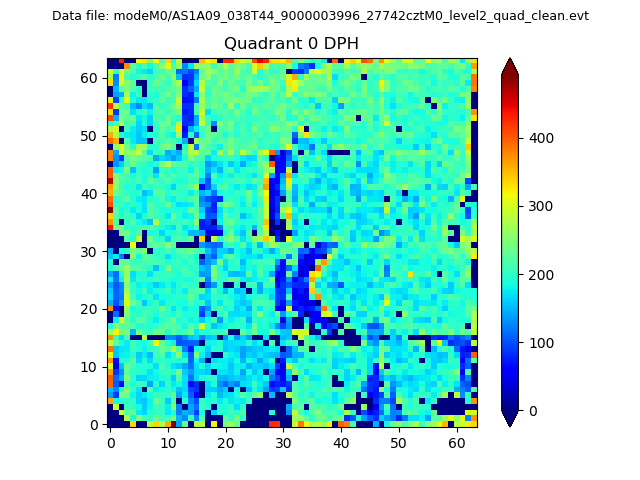 |
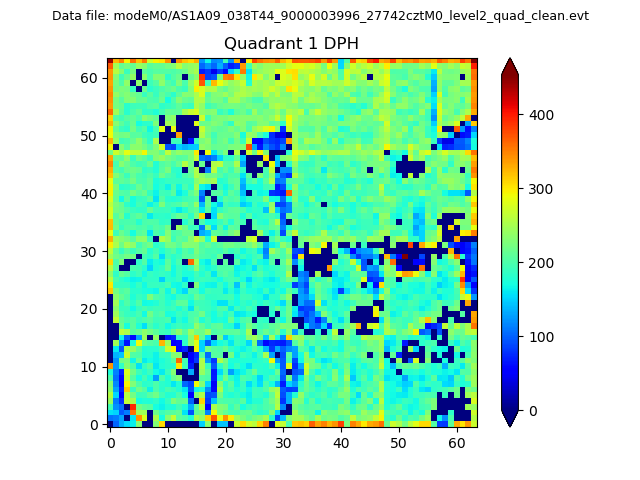 |
Quadrant B |
|---|---|---|---|
| Quadrant D | 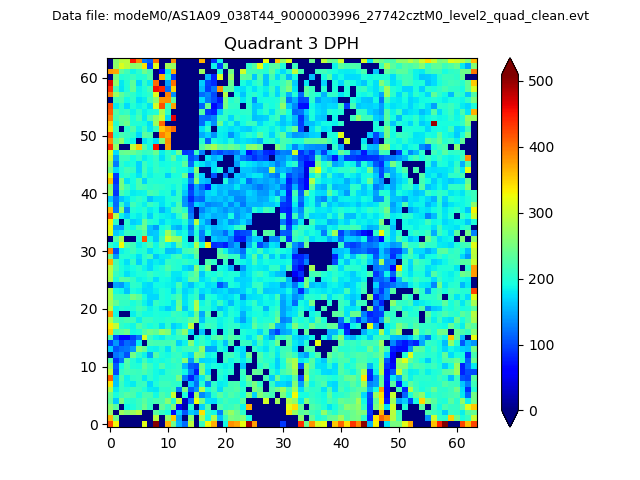 |
 |
Quadrant C |
| Plot type | Count rate plots | Images |
|---|---|---|
| Comparison with Poisson distribution Blue bars denote a histogram of data divided into 1 sec bins. Red curve is a Poisson curve with rate = median count rate of data. |
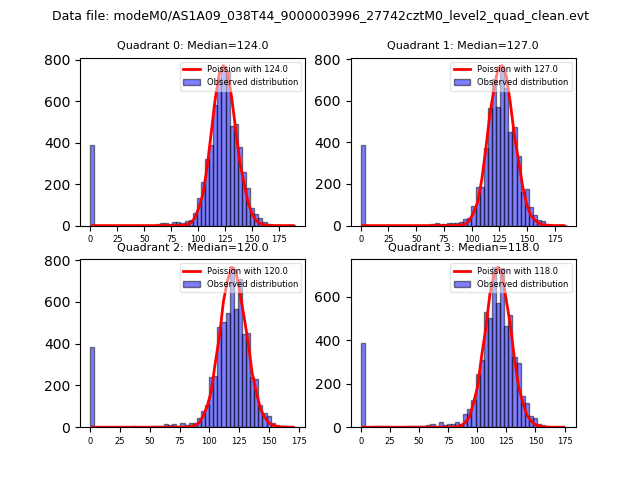 |
 |
| Quadrant-wise count rates Data is divided into 100 sec bins |
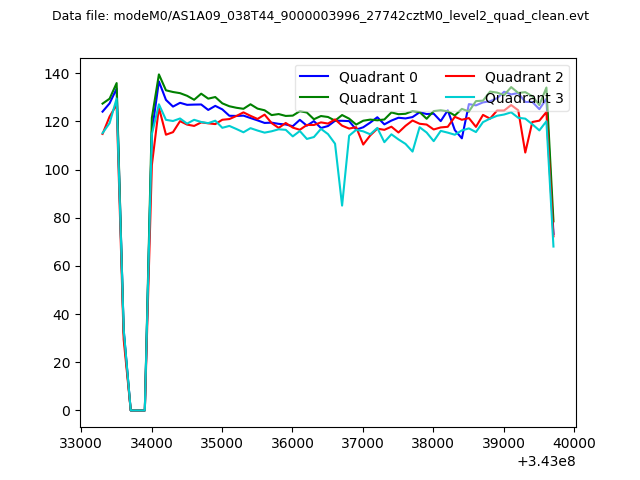 |
|
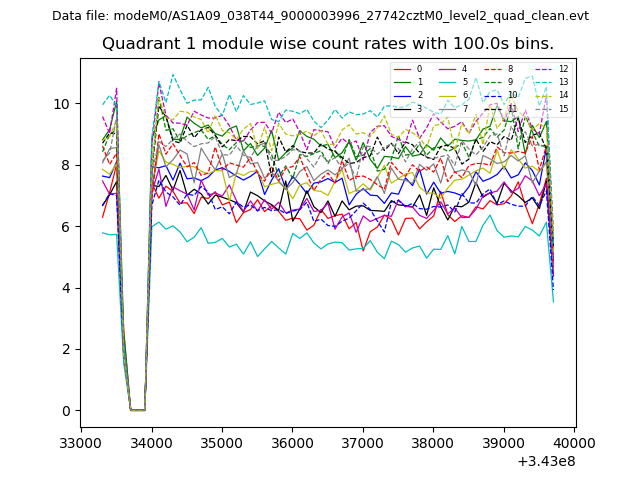
| Module-wise count rates for Quadrant A Data is divided into 100 sec bins |
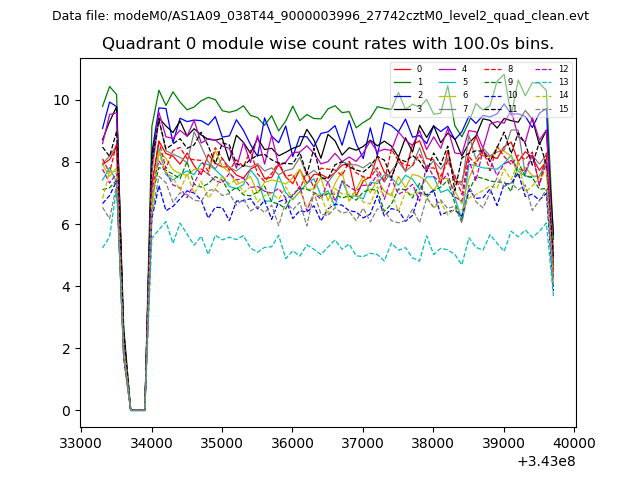 |
 |
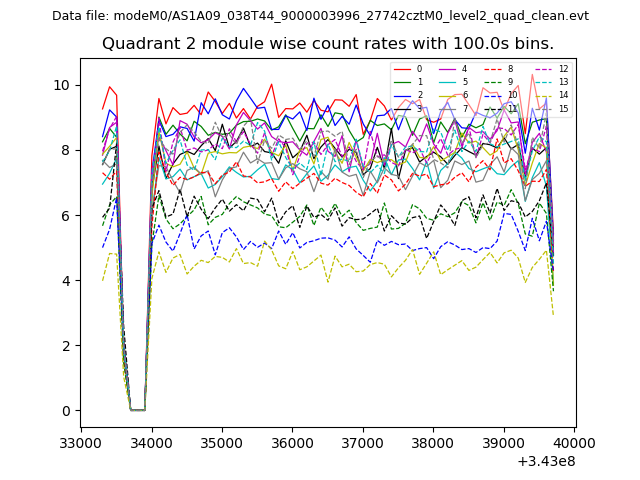
| Module-wise count rates for Quadrant B Data is divided into 100 sec bins |
 |
 |
| Module-wise count rates for Quadrant C Data is divided into 100 sec bins |
 |
 |
| Module-wise count rates for Quadrant D Data is divided into 100 sec bins |
 |
 |
| Parameter | Plot |
|---|---|
| CZT HV Monitor | 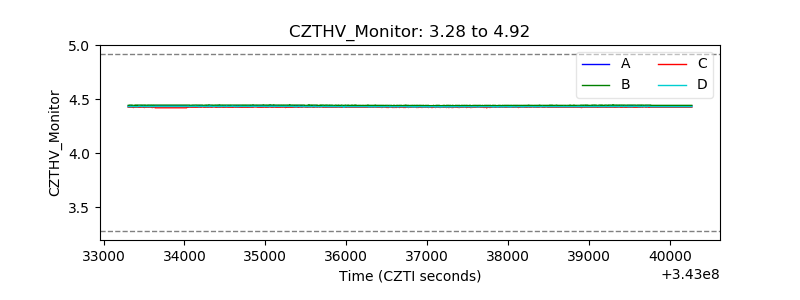 |
| D_VDD | 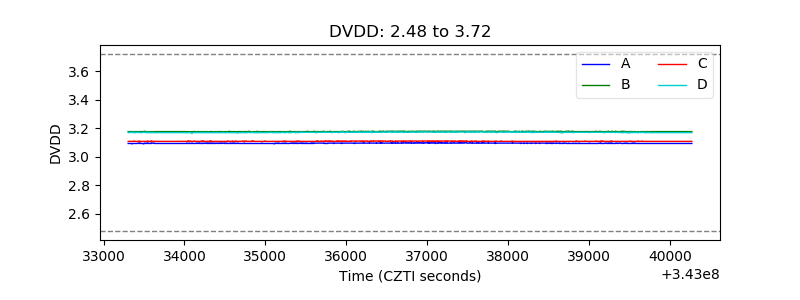 |
| Temperature 1 | 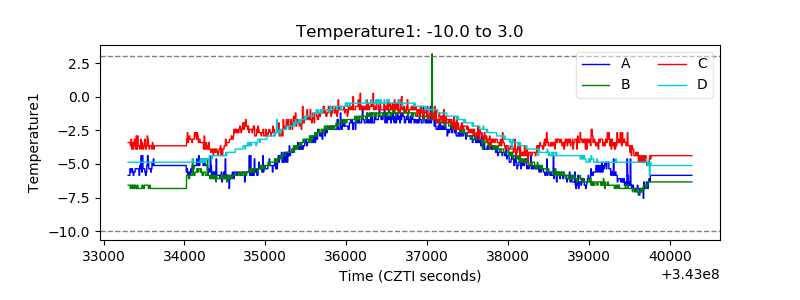 |
| Veto HV Monitor | 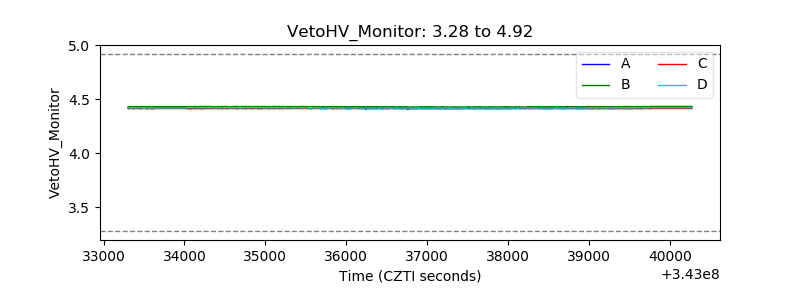 |
| Veto LLD | 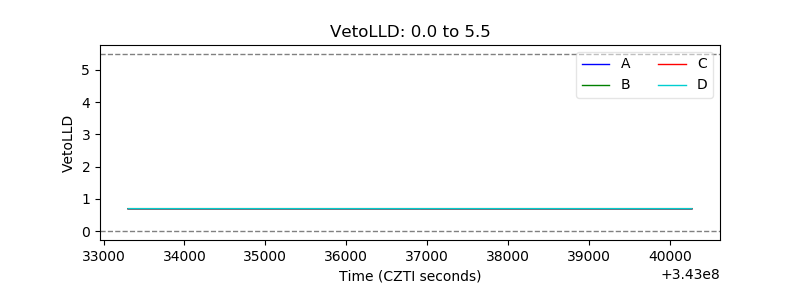 |
| Alpha Counter | 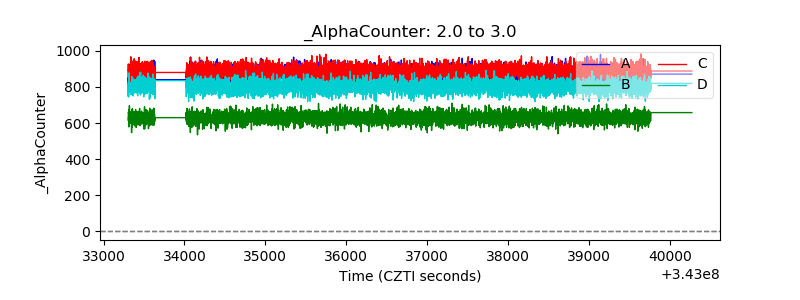 |
| _CPM_Rate |  |
| CZT Counter | 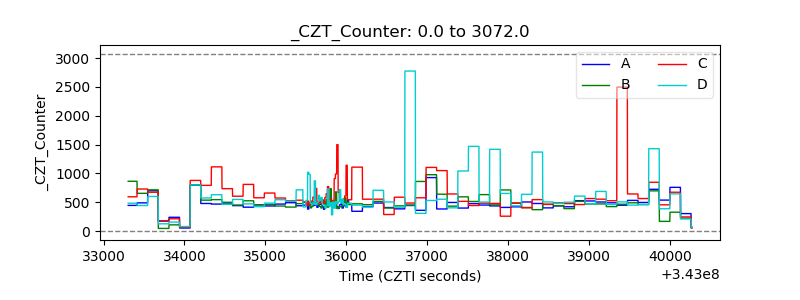 |
| +2.5 Volts monitor |  |
| +5 Volts monitor |  |
| _ROLL_ROT | 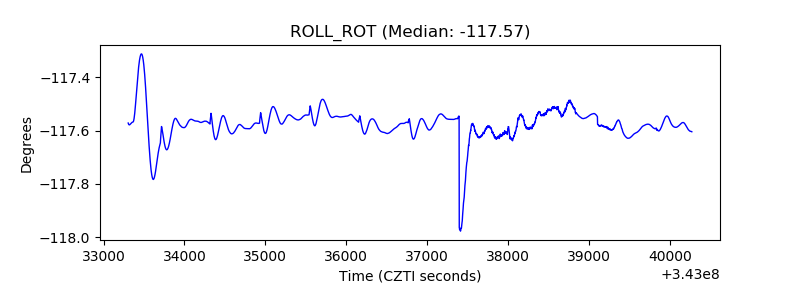 |
| _Roll_DEC | 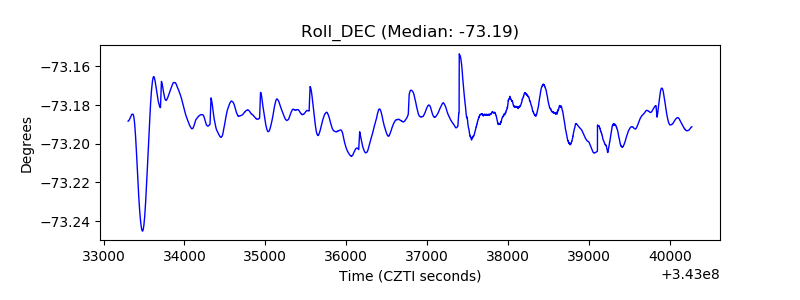 |
| _Roll_RA | 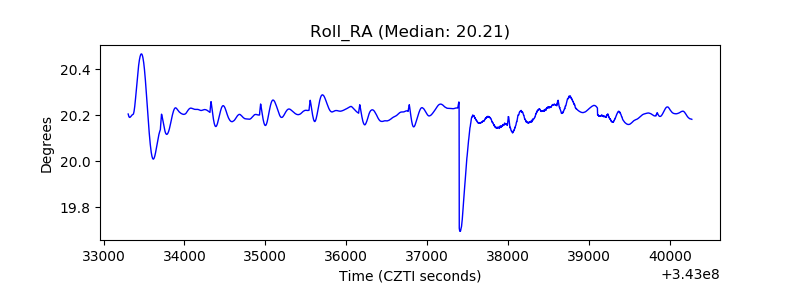 |
| Veto Counter | 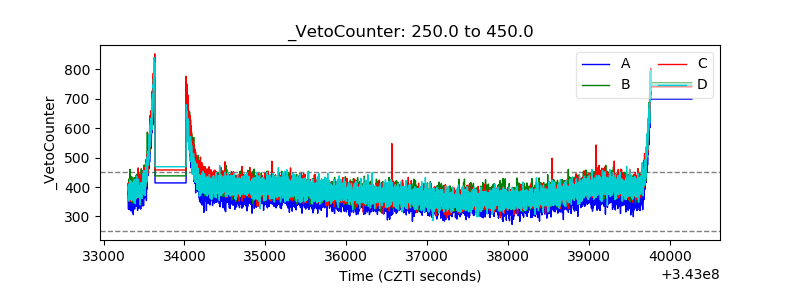 |