| Param | Original file | Final file |
|---|---|---|
| Filename | modeM0/AS1A09_038T45_9000003998cztM0_level2.fits | modeM0/AS1A09_038T45_9000003998cztM0_level2_quad_clean.evt |
| Size (bytes) | 48,758,400 | 21,752,640 |
| Size | 46.5 MB | 20.7 MB |
| Events in quadrant A | 294,194 | 74,715 |
| Events in quadrant B | 281,702 | 76,828 |
| Events in quadrant C | 285,788 | 71,579 |
| Events in quadrant D | 244,506 | 63,619 |
| Mode M9 | |||
|---|---|---|---|
| Quadrant | BADHDUFLAG | Total packets | Discarded packets |
| A | 0 | 7 | 0 |
| B | 0 | 7 | 0 |
| C | 0 | 7 | 0 |
| D | 0 | 7 | 0 |
| Mode M0 | |||
|---|---|---|---|
| Quadrant | BADHDUFLAG | Total packets | Discarded packets |
| A | 0 | 10721 | 0 |
| B | 0 | 10970 | 0 |
| C | 0 | 11450 | 0 |
| D | 0 | 14411 | 0 |
| Mode SS | |||
|---|---|---|---|
| Quadrant | BADHDUFLAG | Total packets | Discarded packets |
| A | 0 | 108 | 0 |
| B | 0 | 108 | 0 |
| C | 0 | 108 | 0 |
| D | 0 | 108 | 0 |
| Quadrant | Total seconds | Saturated seconds | Saturation percentage |
|---|---|---|---|
| A | 5291 | 37 | 0.699301% |
| B | 5291 | 49 | 0.926101% |
| C | 5291 | 79 | 1.493101% |
| D | 5291 | 376 | 7.106407% |
Noise dominated data is calculated using 1-second bins in cleaned event files. If a bin has >2000 counts, and if more than 50% of those come from <1% of pixels, then it is considered to be noise-dominated and hence unusable.
| Quadrant | # 1 sec bins | Bins with >0 counts | Bins with >2000 counts | High rate bins dominated by noise | Noise dominated (total time) | Noise dominated (detector-on time) | Marked lightcurve |
|---|---|---|---|---|---|---|---|
| A | 5290 | 5290 | 0 | 0 | 0.00% | 0.00% | 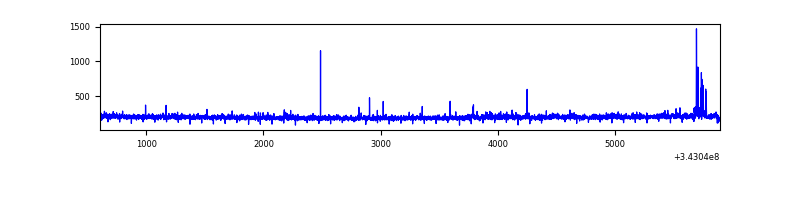 |
| B | 5290 | 5290 | 0 | 0 | 0.00% | 0.00% |  |
| C | 5290 | 5290 | 0 | 0 | 0.00% | 0.00% |  |
| D | 5290 | 5275 | 0 | 0 | 0.00% | 0.00% |  |
Top three noisy pixels from each quadrant. If the there are fewer than three noisy pixels in the level2.evt file, extra rows are filled as -1
| Pixel properties | Quadrant properties | ||||||
|---|---|---|---|---|---|---|---|
| Quadrant | DetID | PixID | Counts | Sigma | Mean | Median | Sigma |
| A | 0 | 29 | 257 | 8.8 | 76 | 72 | 21.0 |
| A | 7 | 110 | 255 | 8.71 | 76 | 72 | 21.0 |
| A | 9 | 19 | 233 | 7.66 | 76 | 72 | 21.0 |
| B | 2 | 9 | 230 | 9.56 | 74 | 71 | 16.6 |
| B | 14 | 254 | 221 | 9.01 | 74 | 71 | 16.6 |
| B | 14 | 253 | 196 | 7.51 | 74 | 71 | 16.6 |
| C | 9 | 209 | 199 | 6.05 | 75 | 70 | 21.3 |
| C | 2 | 191 | 197 | 5.95 | 75 | 70 | 21.3 |
| C | 12 | 241 | 194 | 5.81 | 75 | 70 | 21.3 |
| D | 3 | 14 | 200 | 6.78 | 69 | 63 | 20.2 |
| D | 4 | 246 | 190 | 6.28 | 69 | 63 | 20.2 |
| D | 7 | 3 | 181 | 5.84 | 69 | 63 | 20.2 |
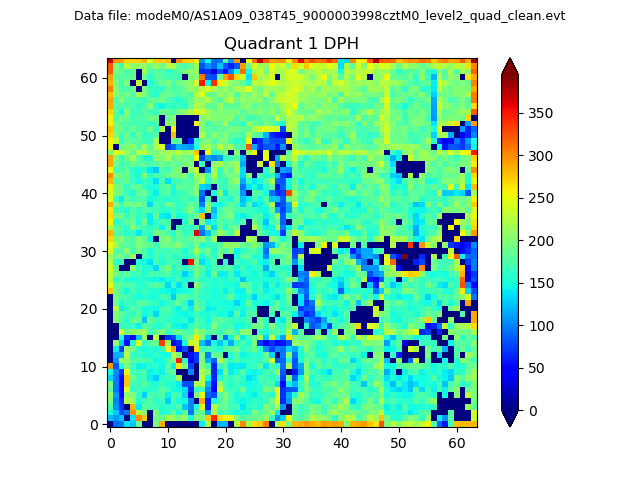
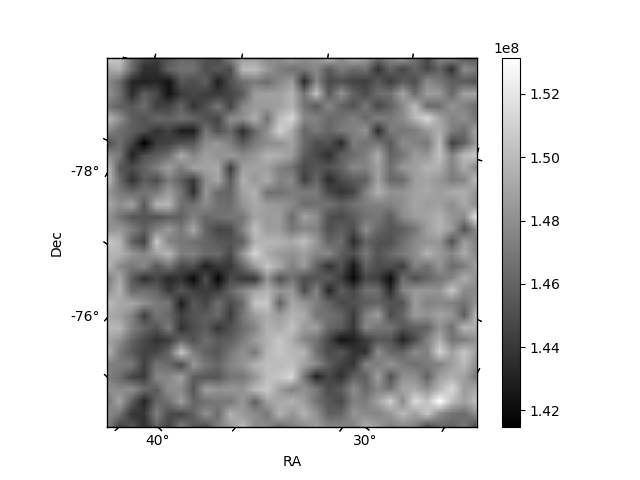
Histogram calculated using DETX and DETY for each event in the final _common_clean file
| Quadrant A |  |
 |
Quadrant B |
|---|---|---|---|
| Quadrant D | 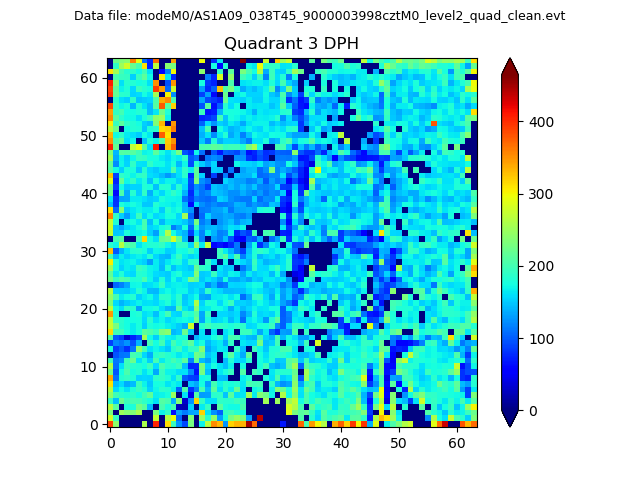 |
 |
Quadrant C |
| Plot type | Count rate plots | Images |
|---|---|---|
| Comparison with Poisson distribution Blue bars denote a histogram of data divided into 1 sec bins. Red curve is a Poisson curve with rate = median count rate of data. |
 |
 |
| Quadrant-wise count rates Data is divided into 100 sec bins |
 |
|
| Module-wise count rates for Quadrant A Data is divided into 100 sec bins |
 |
 |
| Module-wise count rates for Quadrant B Data is divided into 100 sec bins |
 |
 |
| Module-wise count rates for Quadrant C Data is divided into 100 sec bins |
 |
 |
| Module-wise count rates for Quadrant D Data is divided into 100 sec bins |
 |
 |
| Parameter | Plot |
|---|---|
| CZT HV Monitor |  |
| D_VDD | 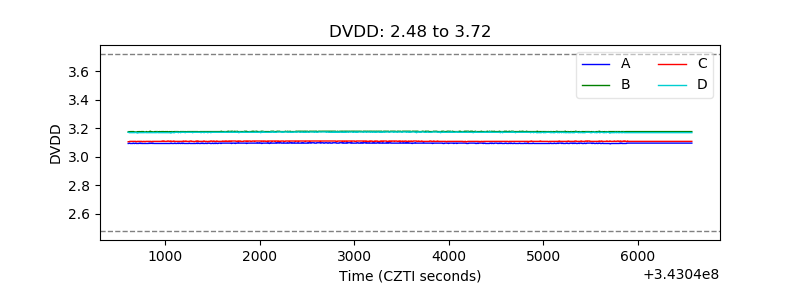 |
| Temperature 1 |  |
| Veto HV Monitor |  |
| Veto LLD |  |
| Alpha Counter |  |
| _CPM_Rate |  |
| CZT Counter |  |
| +2.5 Volts monitor |  |
| +5 Volts monitor |  |
| _ROLL_ROT | 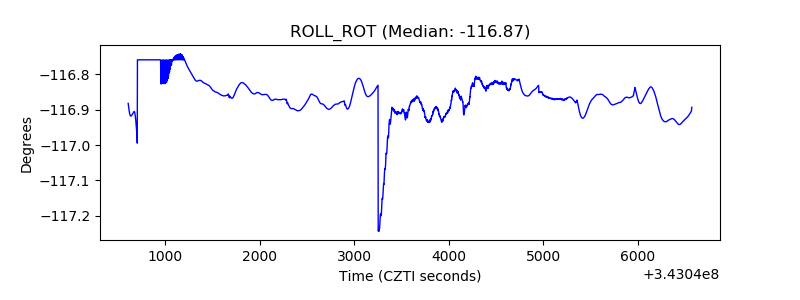 |
| _Roll_DEC |  |
| _Roll_RA | 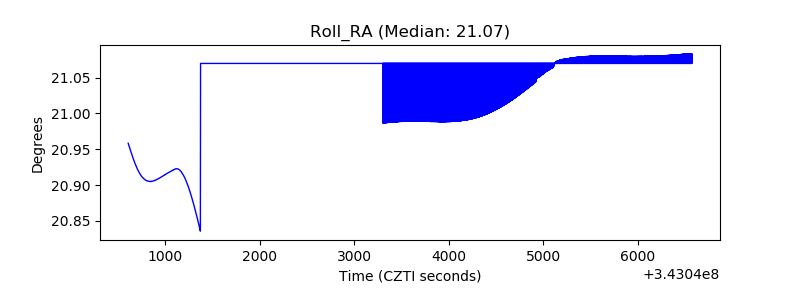 |
| Veto Counter |  |