| Param | Original file | Final file |
|---|---|---|
| Filename | modeM0/AS1A09_038T45_9000003998_27743cztM0_level2.evt | modeM0/AS1A09_038T45_9000003998_27743cztM0_level2_quad_clean.evt |
| Size (bytes) | 363,864,960 | 90,472,320 |
| Size | 347.0 MB | 86.3 MB |
| Events in quadrant A | 2,234,803 | 613,258 |
| Events in quadrant B | 2,382,136 | 620,868 |
| Events in quadrant C | 2,596,328 | 591,730 |
| Events in quadrant D | 3,469,250 | 566,813 |
| Mode M9 | |||
|---|---|---|---|
| Quadrant | BADHDUFLAG | Total packets | Discarded packets |
| A | 0 | 7 | 0 |
| B | 0 | 7 | 0 |
| C | 0 | 7 | 0 |
| D | 0 | 7 | 0 |
| Mode M0 | |||
|---|---|---|---|
| Quadrant | BADHDUFLAG | Total packets | Discarded packets |
| A | 0 | 10026 | 0 |
| B | 0 | 10273 | 0 |
| C | 0 | 10751 | 0 |
| D | 0 | 13709 | 0 |
| Quadrant | Total seconds | Saturated seconds | Saturation percentage |
|---|---|---|---|
| A | 4945 | 37 | 0.748231% |
| B | 4945 | 49 | 0.990900% |
| C | 4946 | 76 | 1.536595% |
| D | 4946 | 376 | 7.602103% |
Noise dominated data is calculated using 1-second bins in cleaned event files. If a bin has >2000 counts, and if more than 50% of those come from <1% of pixels, then it is considered to be noise-dominated and hence unusable.
| Quadrant | # 1 sec bins | Bins with >0 counts | Bins with >2000 counts | High rate bins dominated by noise | Noise dominated (total time) | Noise dominated (detector-on time) | Marked lightcurve |
|---|---|---|---|---|---|---|---|
| A | 4944 | 4944 | 2 | 2 | 0.04% | 0.04% | 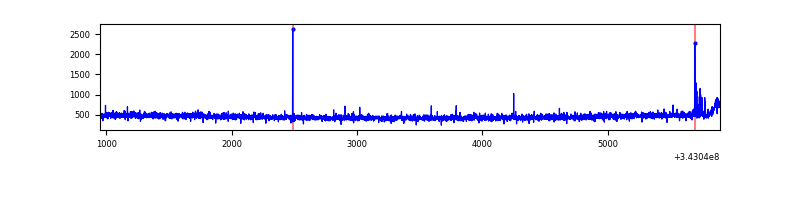 |
| B | 4944 | 4944 | 4 | 4 | 0.08% | 0.08% | 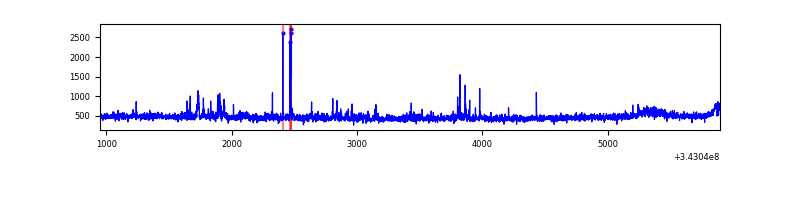 |
| C | 4945 | 4945 | 7 | 7 | 0.14% | 0.14% | 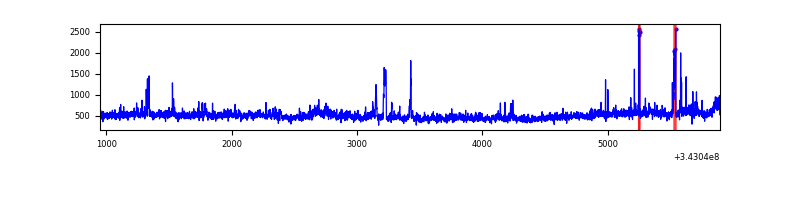 |
| D | 4945 | 4945 | 338 | 338 | 6.84% | 6.84% | 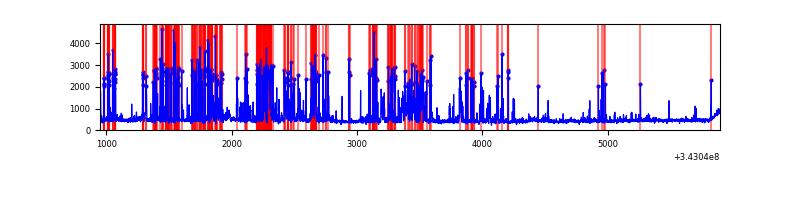 |
Top three noisy pixels from each quadrant. If the there are fewer than three noisy pixels in the level2.evt file, extra rows are filled as -1
| Pixel properties | Quadrant properties | ||||||
|---|---|---|---|---|---|---|---|
| Quadrant | DetID | PixID | Counts | Sigma | Mean | Median | Sigma |
| A | 0 | 13 | 27297 | 229.4 | 570 | 557 | 116.6 |
| A | 13 | 254 | 8655 | 69.47 | 570 | 557 | 116.6 |
| A | 13 | 248 | 5562 | 42.94 | 570 | 557 | 116.6 |
| B | 0 | 190 | 58202 | 532.11 | 568 | 553 | 108.3 |
| B | 3 | 64 | 32677 | 296.51 | 568 | 553 | 108.3 |
| B | 0 | 230 | 27161 | 245.59 | 568 | 553 | 108.3 |
| C | 3 | 233 | 372827 | 2889.04 | 544 | 547 | 128.9 |
| C | 14 | 238 | 86823 | 669.54 | 544 | 547 | 128.9 |
| C | 0 | 207 | 9415 | 68.82 | 544 | 547 | 128.9 |
| D | 1 | 52 | 1256392 | 9753.58 | 533 | 516 | 128.8 |
| D | 2 | 250 | 140429 | 1086.61 | 533 | 516 | 128.8 |
| D | 2 | 234 | 22928 | 174.06 | 533 | 516 | 128.8 |
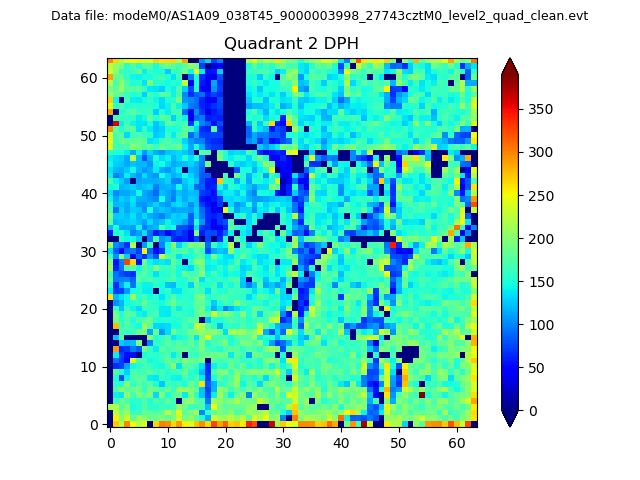
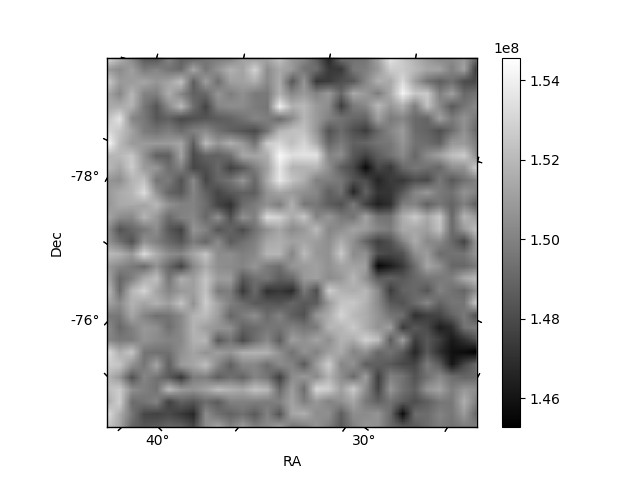
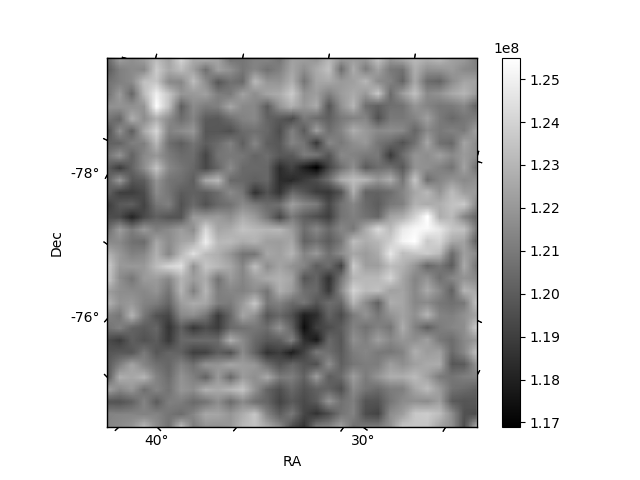
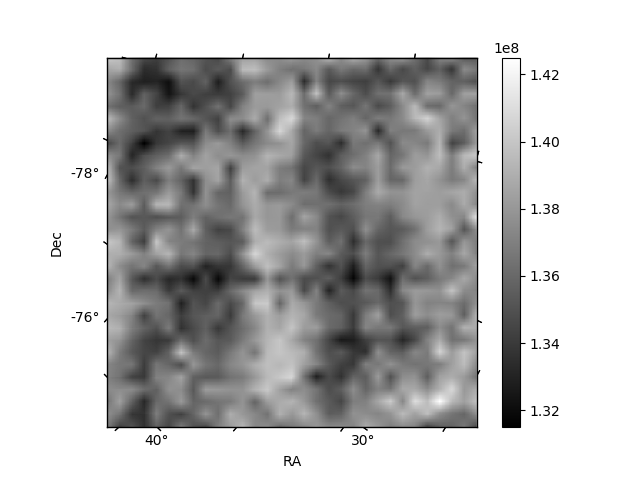
Histogram calculated using DETX and DETY for each event in the final _common_clean file
| Quadrant A | 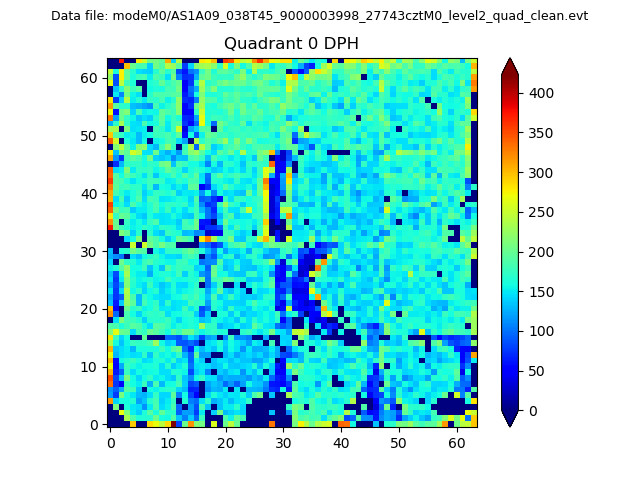 |
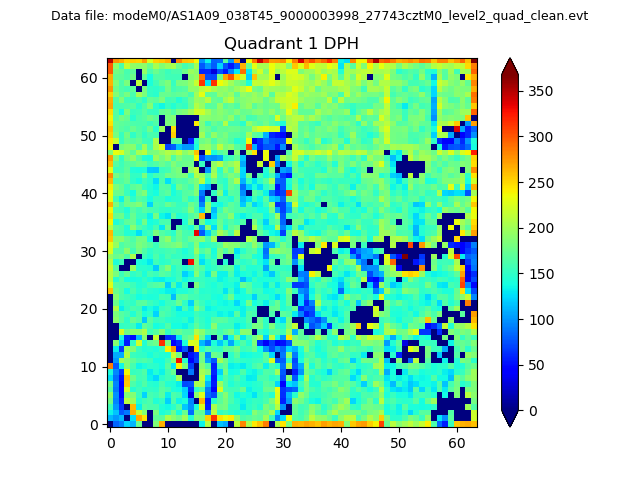 |
Quadrant B |
|---|---|---|---|
| Quadrant D | 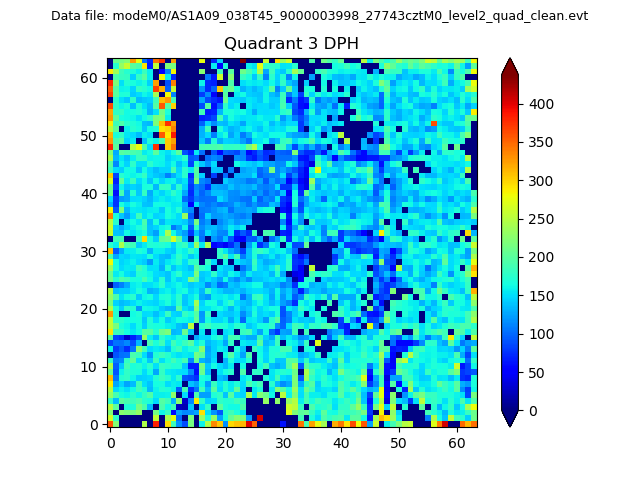 |
 |
Quadrant C |
| Plot type | Count rate plots | Images |
|---|---|---|
| Comparison with Poisson distribution Blue bars denote a histogram of data divided into 1 sec bins. Red curve is a Poisson curve with rate = median count rate of data. |
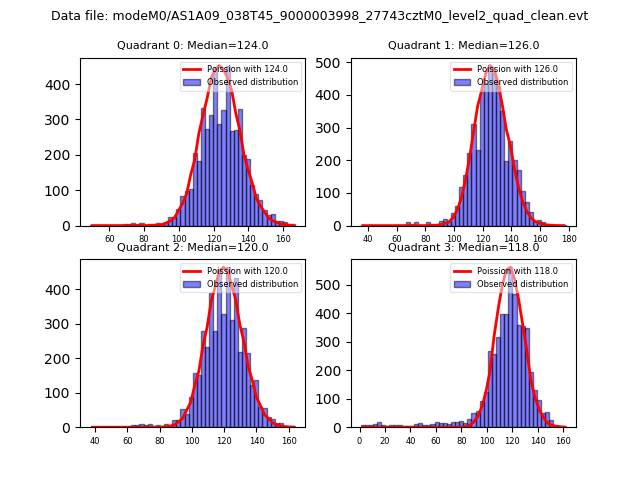 |
 |
| Quadrant-wise count rates Data is divided into 100 sec bins |
 |
|
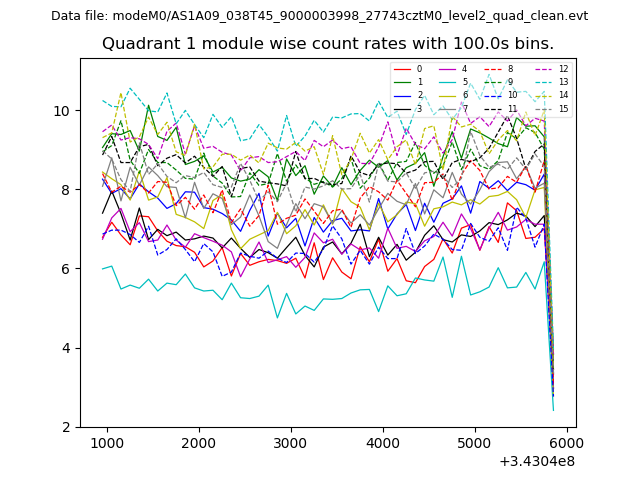
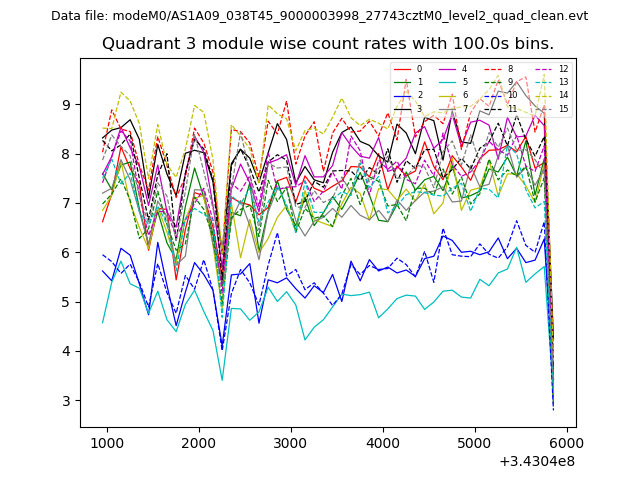
| Module-wise count rates for Quadrant A Data is divided into 100 sec bins |
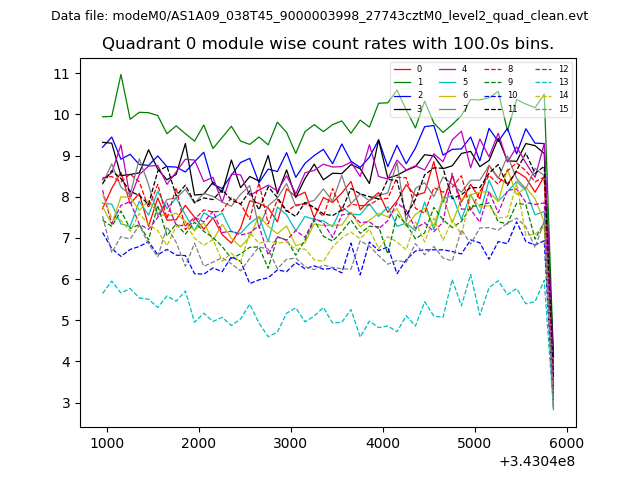 |
 |
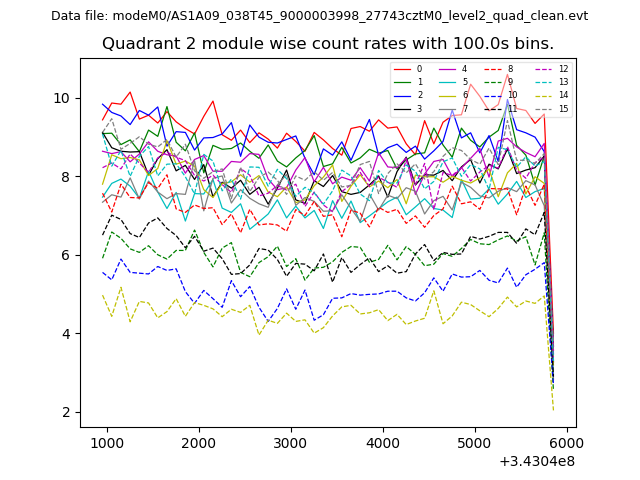
| Module-wise count rates for Quadrant B Data is divided into 100 sec bins |
 |
 |
| Module-wise count rates for Quadrant C Data is divided into 100 sec bins |
 |
 |
| Module-wise count rates for Quadrant D Data is divided into 100 sec bins |
 |
 |
| Parameter | Plot |
|---|---|
| CZT HV Monitor | 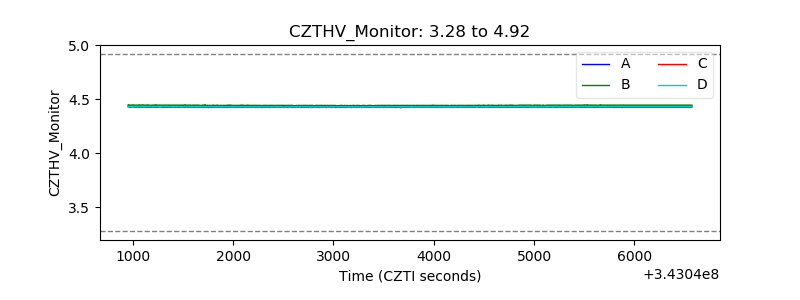 |
| D_VDD | 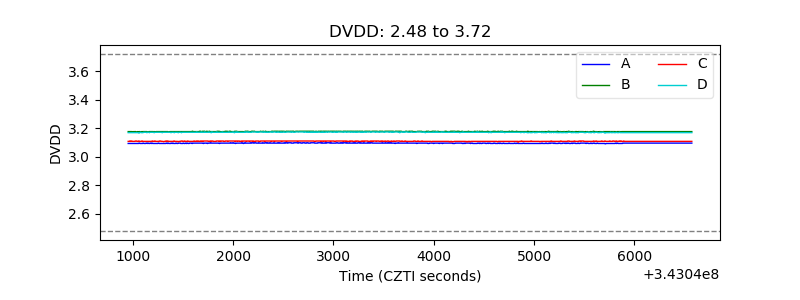 |
| Temperature 1 | 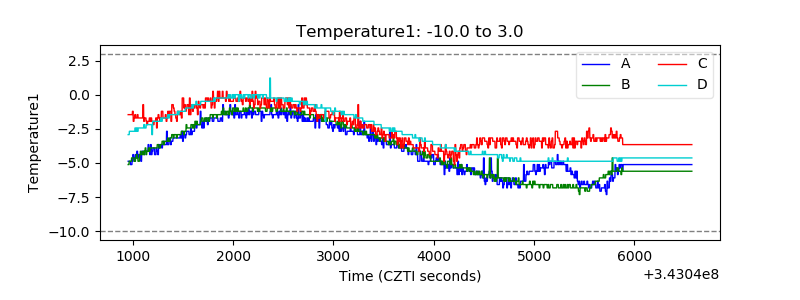 |
| Veto HV Monitor | 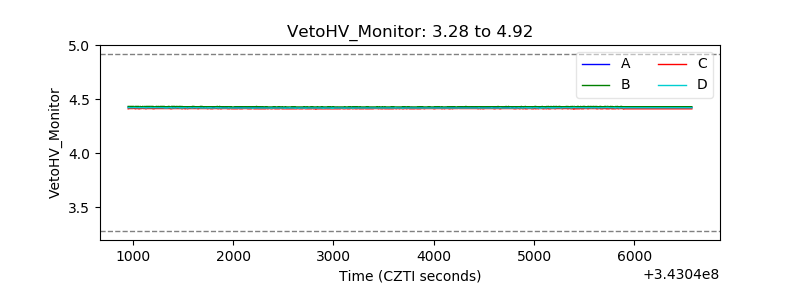 |
| Veto LLD | 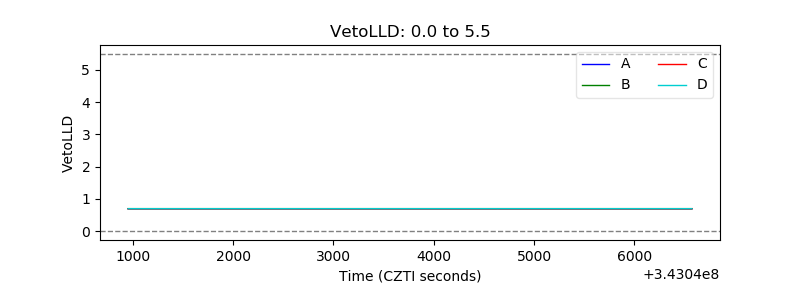 |
| Alpha Counter | 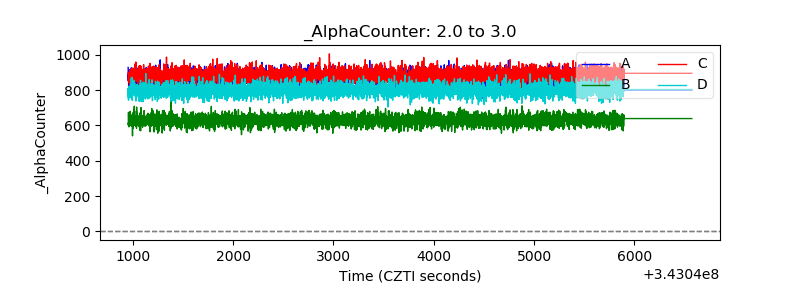 |
| _CPM_Rate | 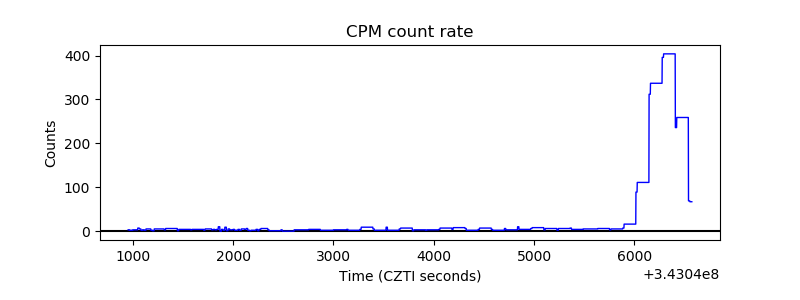 |
| CZT Counter | 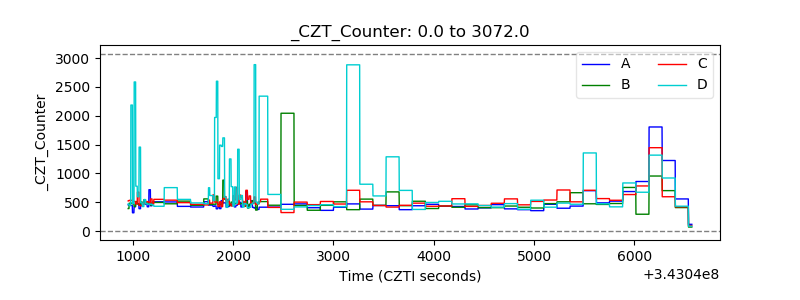 |
| +2.5 Volts monitor |  |
| +5 Volts monitor |  |
| _ROLL_ROT | 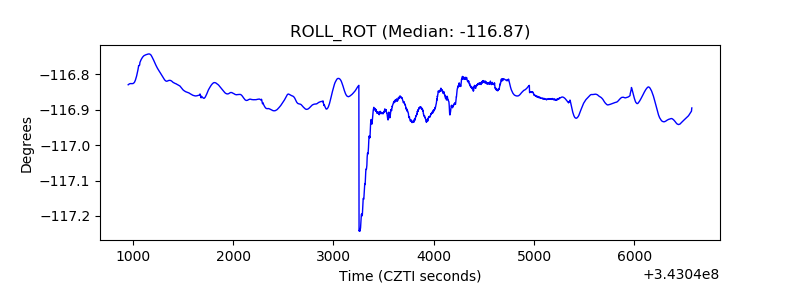 |
| _Roll_DEC | 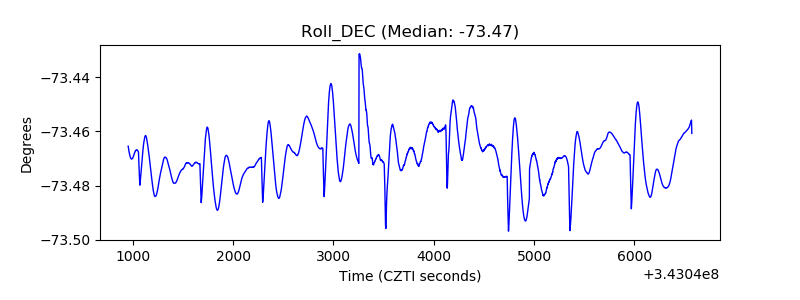 |
| _Roll_RA | 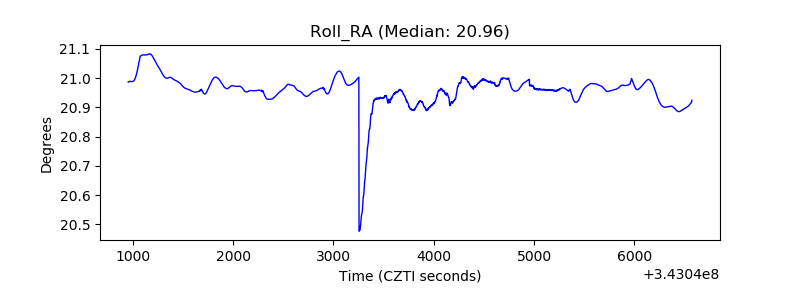 |
| Veto Counter | 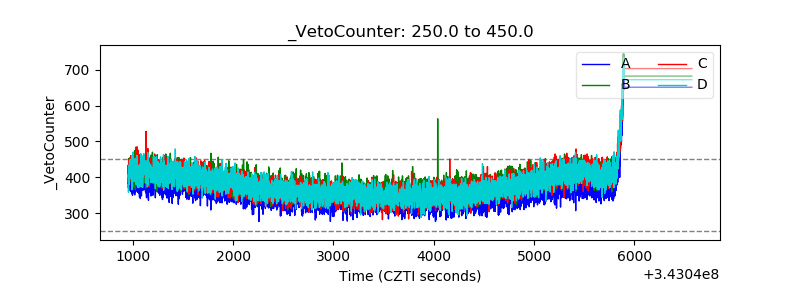 |