| Param | Original file | Final file |
|---|---|---|
| Filename | modeM0/AS1A10_002T05_9000004000_27743cztM0_level2.evt | modeM0/AS1A10_002T05_9000004000_27743cztM0_level2_quad_clean.evt |
| Size (bytes) | 471,579,840 | 89,334,720 |
| Size | 449.7 MB | 85.2 MB |
| Events in quadrant A | 3,373,245 | 587,222 |
| Events in quadrant B | 3,536,837 | 589,979 |
| Events in quadrant C | 3,283,419 | 570,712 |
| Events in quadrant D | 3,695,887 | 553,292 |
| Mode M9 | |||
|---|---|---|---|
| Quadrant | BADHDUFLAG | Total packets | Discarded packets |
| A | 0 | 9 | 0 |
| B | 0 | 9 | 0 |
| C | 0 | 9 | 0 |
| D | 0 | 9 | 0 |
| Mode M0 | |||
|---|---|---|---|
| Quadrant | BADHDUFLAG | Total packets | Discarded packets |
| A | 0 | 13699 | 0 |
| B | 0 | 14193 | 0 |
| C | 0 | 13197 | 0 |
| D | 0 | 14717 | 0 |
| Quadrant | Total seconds | Saturated seconds | Saturation percentage |
|---|---|---|---|
| A | 5782 | 172 | 2.974749% |
| B | 5781 | 130 | 2.248746% |
| C | 5781 | 82 | 1.418440% |
| D | 5781 | 166 | 2.871476% |
Noise dominated data is calculated using 1-second bins in cleaned event files. If a bin has >2000 counts, and if more than 50% of those come from <1% of pixels, then it is considered to be noise-dominated and hence unusable.
| Quadrant | # 1 sec bins | Bins with >0 counts | Bins with >2000 counts | High rate bins dominated by noise | Noise dominated (total time) | Noise dominated (detector-on time) | Marked lightcurve |
|---|---|---|---|---|---|---|---|
| A | 6697 | 5782 | 103 | 103 | 1.54% | 1.78% | 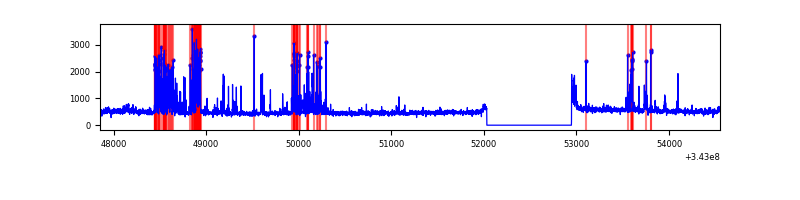 |
| B | 6696 | 5781 | 57 | 57 | 0.85% | 0.99% | 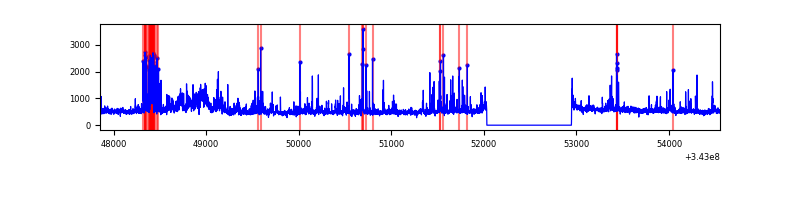 |
| C | 6696 | 5781 | 5 | 5 | 0.07% | 0.09% | 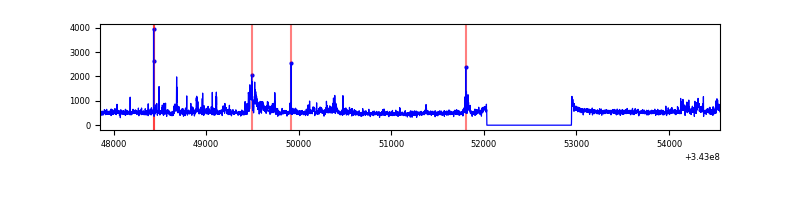 |
| D | 6696 | 5781 | 128 | 128 | 1.91% | 2.21% | 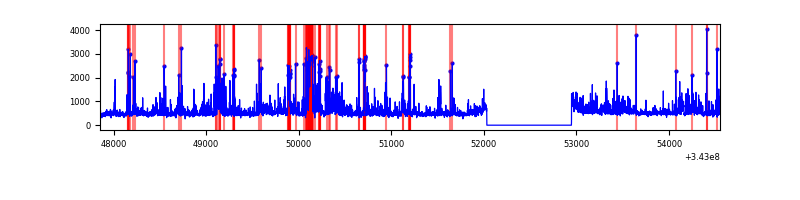 |
Top three noisy pixels from each quadrant. If the there are fewer than three noisy pixels in the level2.evt file, extra rows are filled as -1
| Pixel properties | Quadrant properties | ||||||
|---|---|---|---|---|---|---|---|
| Quadrant | DetID | PixID | Counts | Sigma | Mean | Median | Sigma |
| A | 0 | 13 | 620004 | 4329.44 | 704 | 690 | 143.0 |
| A | 13 | 248 | 19118 | 128.82 | 704 | 690 | 143.0 |
| A | 13 | 254 | 10726 | 70.16 | 704 | 690 | 143.0 |
| B | 10 | 245 | 243501 | 1823.5 | 697 | 680 | 133.2 |
| B | 0 | 230 | 182384 | 1364.53 | 697 | 680 | 133.2 |
| B | 0 | 190 | 153332 | 1146.36 | 697 | 680 | 133.2 |
| C | 3 | 233 | 498756 | 3167.16 | 675 | 680 | 157.3 |
| C | 14 | 238 | 107214 | 677.42 | 675 | 680 | 157.3 |
| C | 0 | 207 | 16417 | 100.07 | 675 | 680 | 157.3 |
| D | 1 | 52 | 463058 | 2807.87 | 681 | 661 | 164.7 |
| D | 15 | 0 | 238899 | 1446.68 | 681 | 661 | 164.7 |
| D | 2 | 250 | 140120 | 846.85 | 681 | 661 | 164.7 |
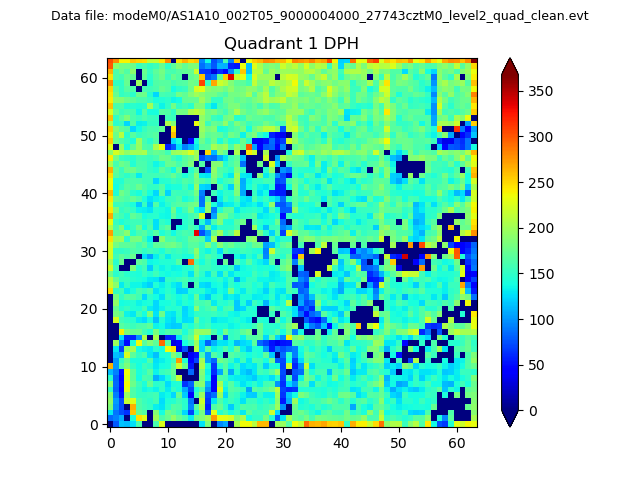
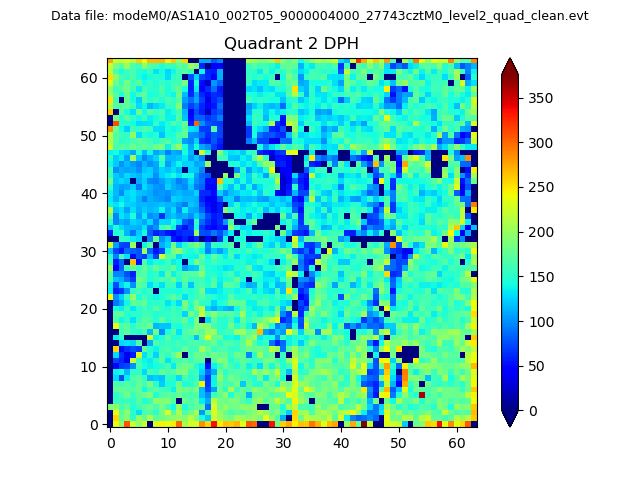
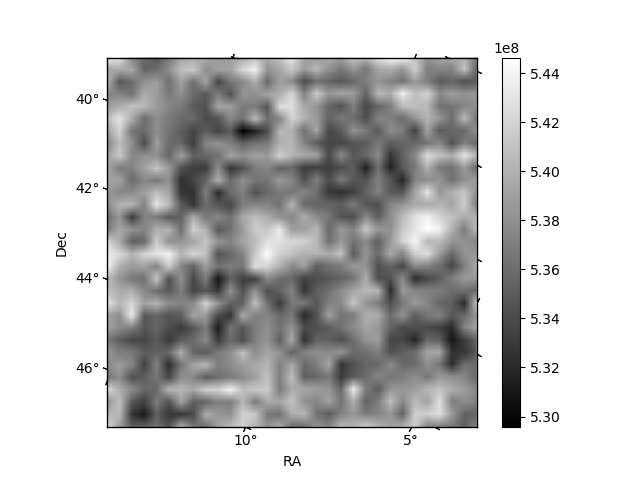
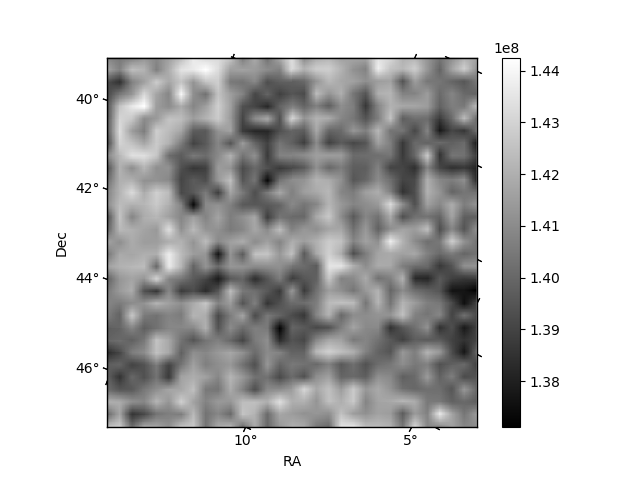
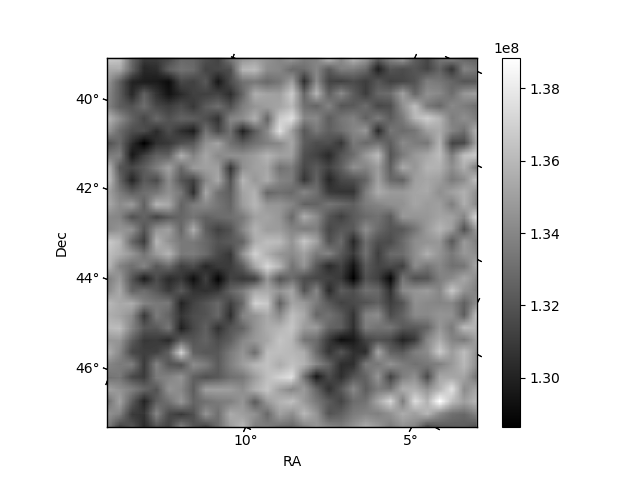
Histogram calculated using DETX and DETY for each event in the final _common_clean file
| Quadrant A |  |
 |
Quadrant B |
|---|---|---|---|
| Quadrant D | 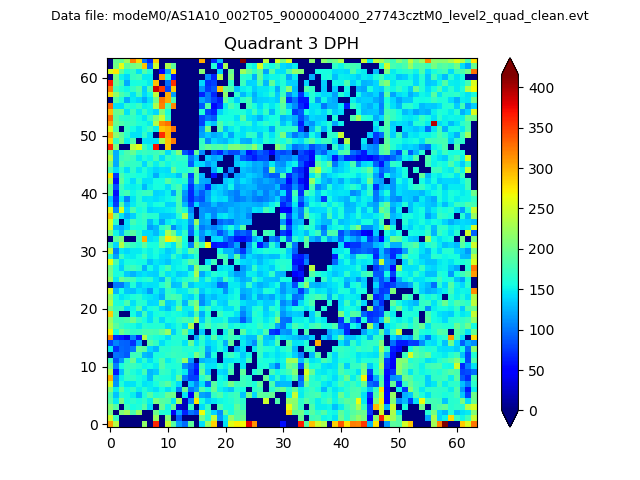 |
 |
Quadrant C |
| Plot type | Count rate plots | Images |
|---|---|---|
| Comparison with Poisson distribution Blue bars denote a histogram of data divided into 1 sec bins. Red curve is a Poisson curve with rate = median count rate of data. |
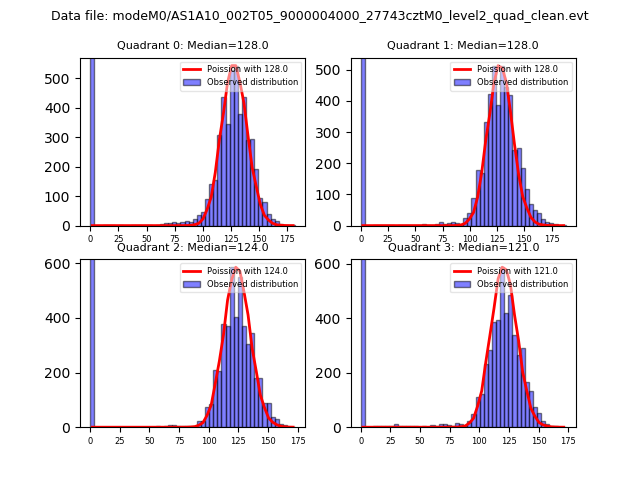 |
 |
| Quadrant-wise count rates Data is divided into 100 sec bins |
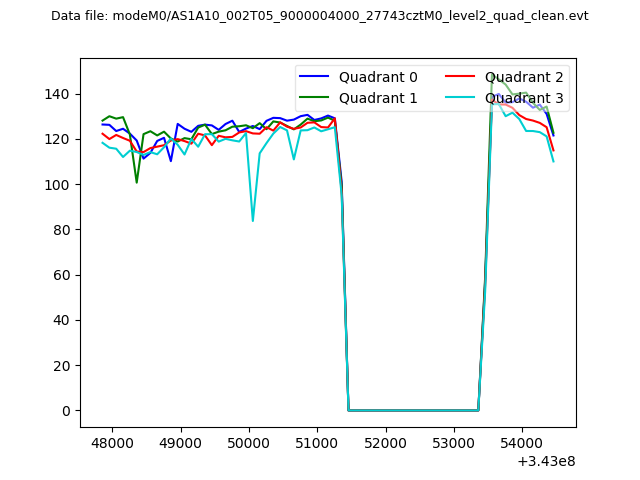 |
|
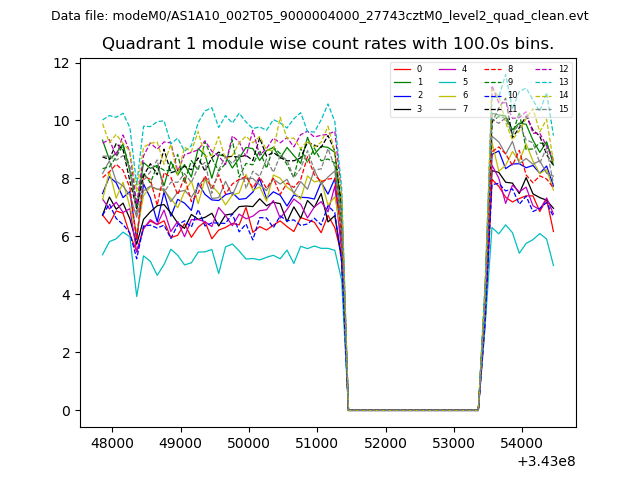
| Module-wise count rates for Quadrant A Data is divided into 100 sec bins |
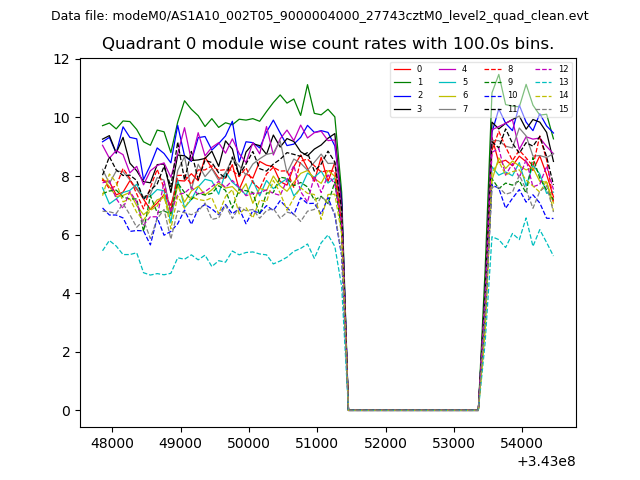 |
 |
| Module-wise count rates for Quadrant B Data is divided into 100 sec bins |
 |
 |
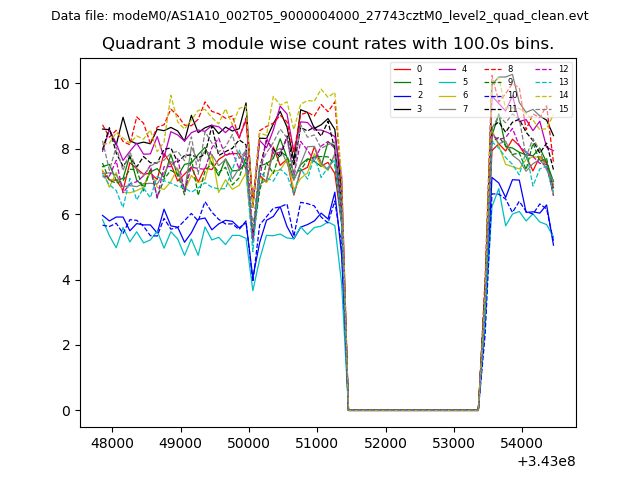
| Module-wise count rates for Quadrant C Data is divided into 100 sec bins |
 |
 |
| Module-wise count rates for Quadrant D Data is divided into 100 sec bins |
 |
 |
| Parameter | Plot |
|---|---|
| CZT HV Monitor | 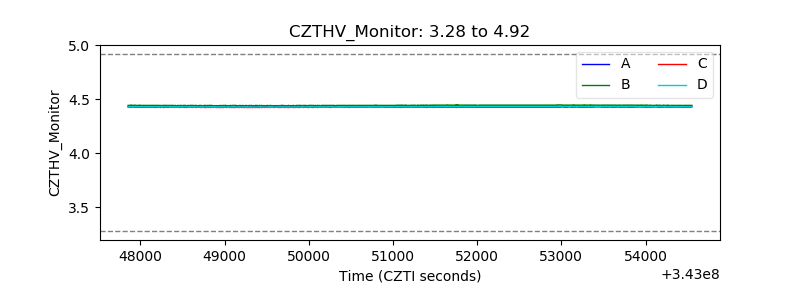 |
| D_VDD | 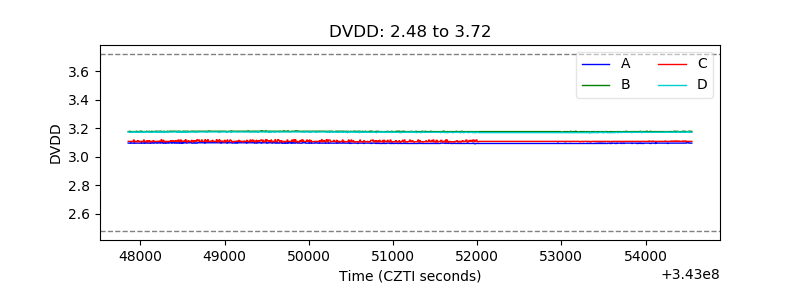 |
| Temperature 1 | 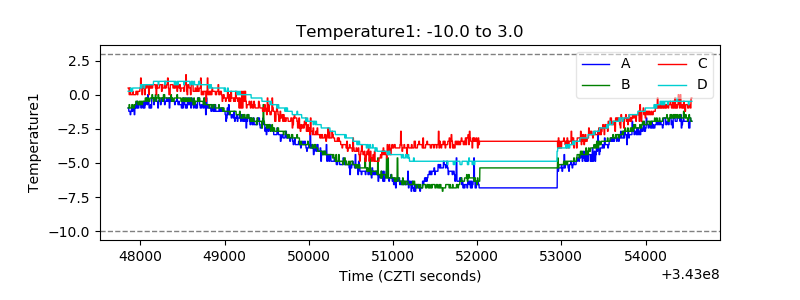 |
| Veto HV Monitor | 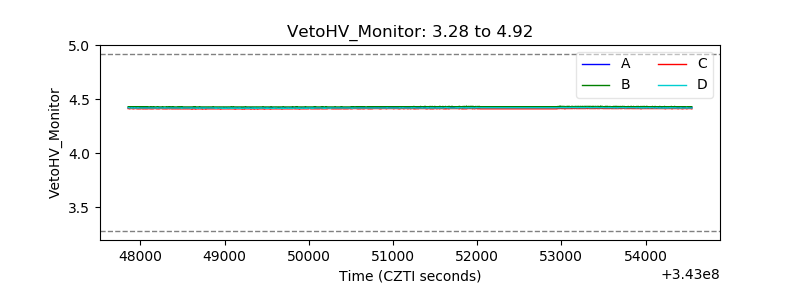 |
| Veto LLD | 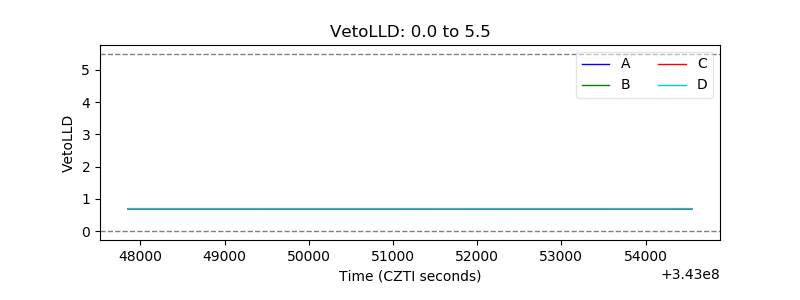 |
| Alpha Counter | 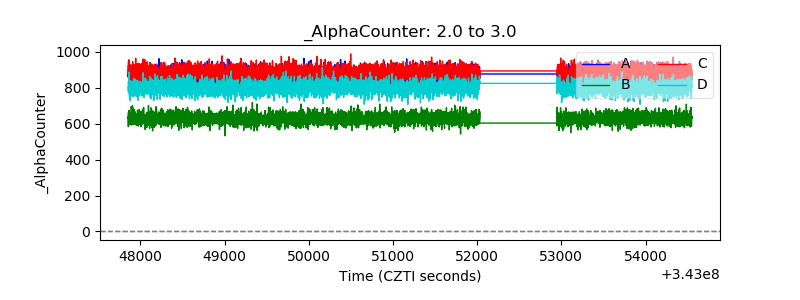 |
| _CPM_Rate | 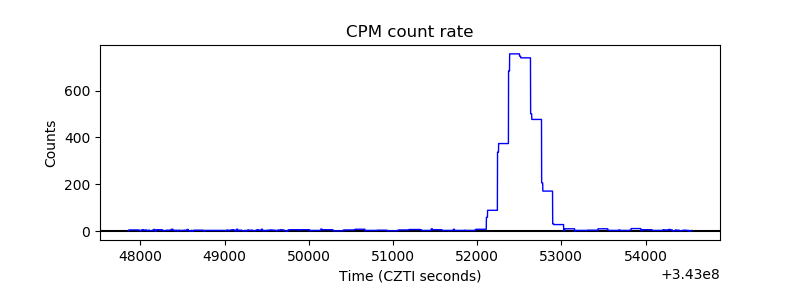 |
| CZT Counter | 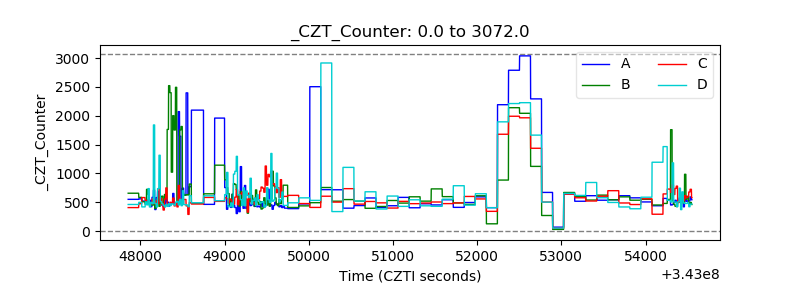 |
| +2.5 Volts monitor | 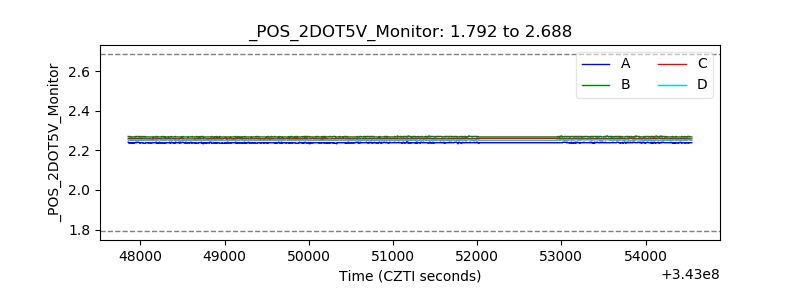 |
| +5 Volts monitor |  |
| _ROLL_ROT | 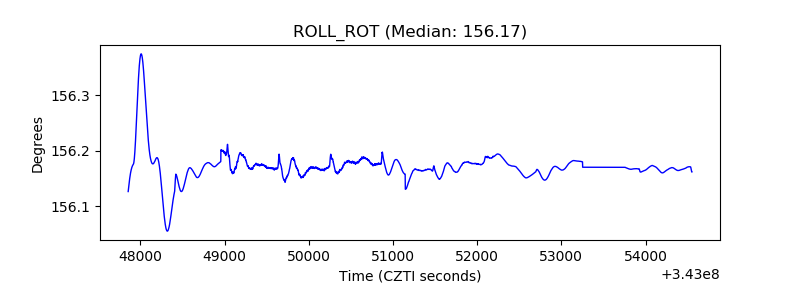 |
| _Roll_DEC | 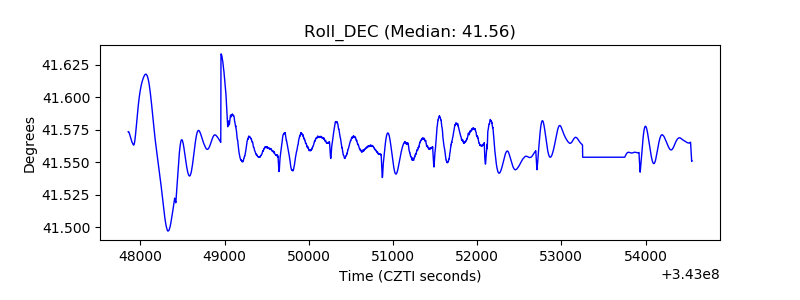 |
| _Roll_RA | 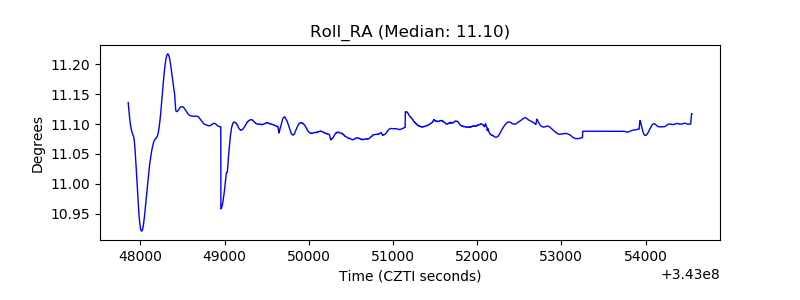 |
| Veto Counter | 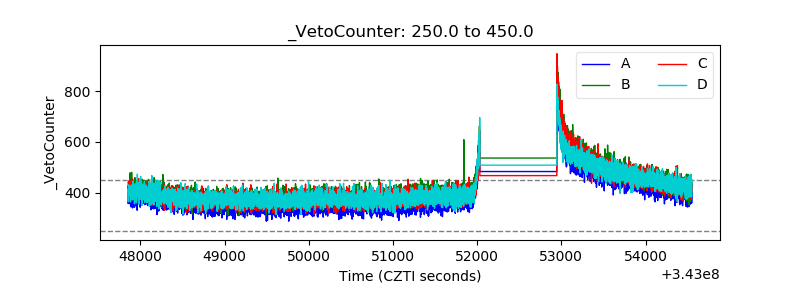 |