| Param | Original file | Final file |
|---|---|---|
| Filename | modeM0/AS1A10_002T05_9000004000_27745cztM0_level2.evt | modeM0/AS1A10_002T05_9000004000_27745cztM0_level2_quad_clean.evt |
| Size (bytes) | 481,584,960 | 106,355,520 |
| Size | 459.3 MB | 101.4 MB |
| Events in quadrant A | 3,469,434 | 711,902 |
| Events in quadrant B | 3,346,047 | 711,818 |
| Events in quadrant C | 3,670,038 | 680,355 |
| Events in quadrant D | 3,663,526 | 669,045 |
| Mode M9 | |||
|---|---|---|---|
| Quadrant | BADHDUFLAG | Total packets | Discarded packets |
| A | 0 | 10 | 0 |
| B | 0 | 10 | 0 |
| C | 0 | 10 | 0 |
| D | 0 | 10 | 0 |
| Mode M0 | |||
|---|---|---|---|
| Quadrant | BADHDUFLAG | Total packets | Discarded packets |
| A | 0 | 14342 | 0 |
| B | 0 | 14121 | 0 |
| C | 0 | 14860 | 0 |
| D | 0 | 15012 | 0 |
| Quadrant | Total seconds | Saturated seconds | Saturation percentage |
|---|---|---|---|
| A | 6415 | 98 | 1.527670% |
| B | 6416 | 66 | 1.028678% |
| C | 6416 | 119 | 1.854738% |
| D | 6416 | 105 | 1.636534% |
Noise dominated data is calculated using 1-second bins in cleaned event files. If a bin has >2000 counts, and if more than 50% of those come from <1% of pixels, then it is considered to be noise-dominated and hence unusable.
| Quadrant | # 1 sec bins | Bins with >0 counts | Bins with >2000 counts | High rate bins dominated by noise | Noise dominated (total time) | Noise dominated (detector-on time) | Marked lightcurve |
|---|---|---|---|---|---|---|---|
| A | 7460 | 6415 | 35 | 35 | 0.47% | 0.55% | 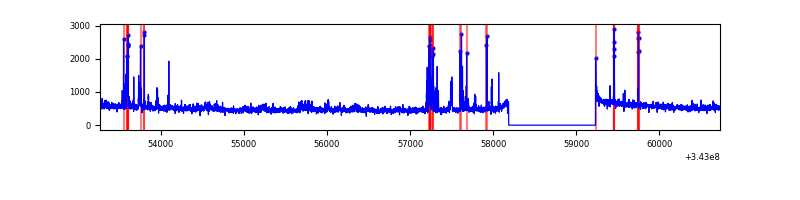 |
| B | 7461 | 6416 | 5 | 5 | 0.07% | 0.08% | 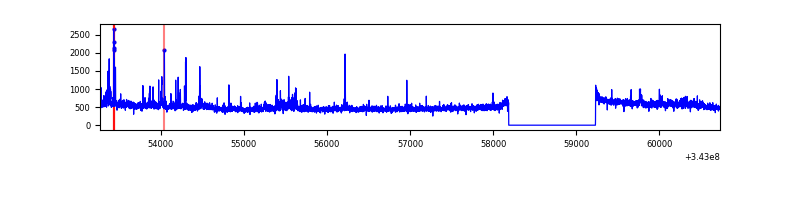 |
| C | 7461 | 6416 | 3 | 3 | 0.04% | 0.05% | 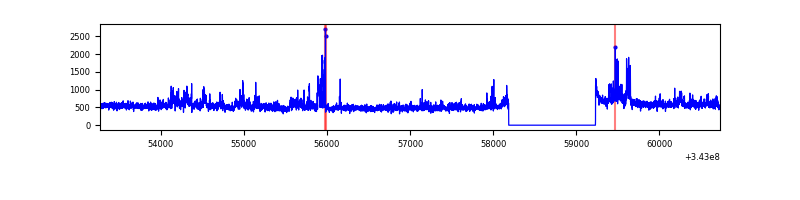 |
| D | 7461 | 6416 | 53 | 53 | 0.71% | 0.83% | 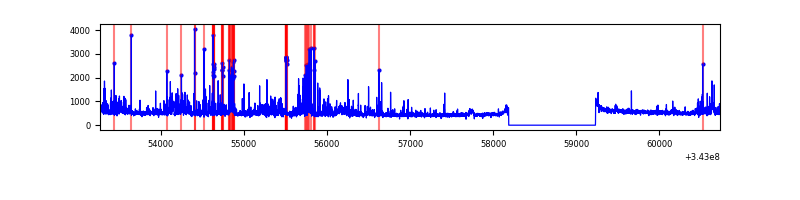 |
Top three noisy pixels from each quadrant. If the there are fewer than three noisy pixels in the level2.evt file, extra rows are filled as -1
| Pixel properties | Quadrant properties | ||||||
|---|---|---|---|---|---|---|---|
| Quadrant | DetID | PixID | Counts | Sigma | Mean | Median | Sigma |
| A | 0 | 13 | 325554 | 1983.31 | 814 | 799 | 163.7 |
| A | 13 | 254 | 10822 | 61.21 | 814 | 799 | 163.7 |
| A | 3 | 137 | 7517 | 41.03 | 814 | 799 | 163.7 |
| B | 10 | 245 | 119919 | 783.05 | 799 | 780 | 152.1 |
| B | 0 | 190 | 38509 | 247.98 | 799 | 780 | 152.1 |
| B | 4 | 200 | 29577 | 189.27 | 799 | 780 | 152.1 |
| C | 3 | 233 | 442605 | 2434.75 | 774 | 779 | 181.5 |
| C | 14 | 238 | 122873 | 672.82 | 774 | 779 | 181.5 |
| C | 10 | 22 | 86279 | 471.16 | 774 | 779 | 181.5 |
| D | 1 | 52 | 579934 | 3110.22 | 786 | 765 | 186.2 |
| D | 2 | 250 | 58374 | 309.37 | 786 | 765 | 186.2 |
| D | 2 | 234 | 27354 | 142.79 | 786 | 765 | 186.2 |
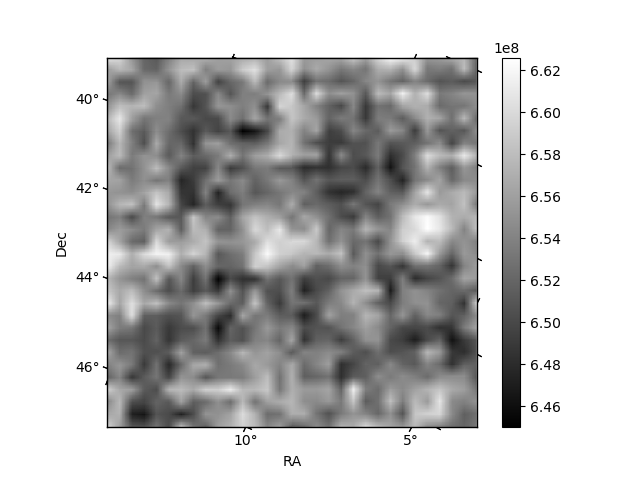
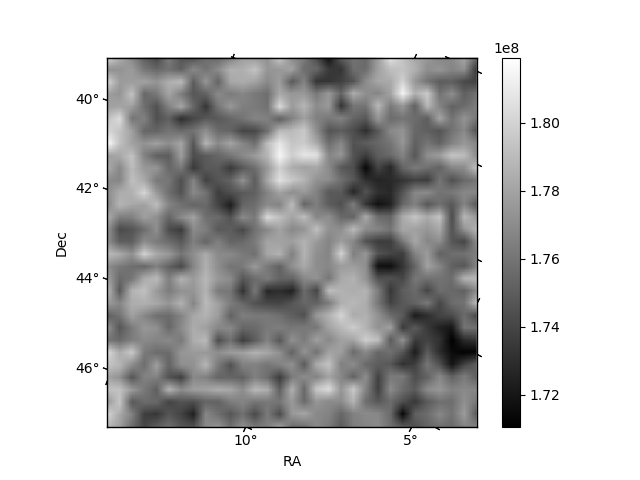
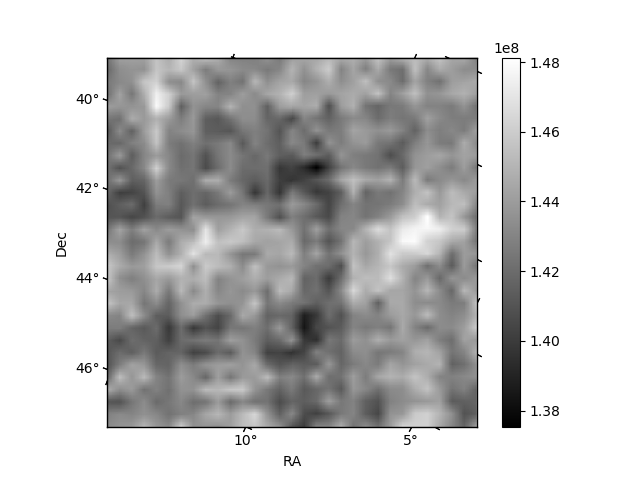
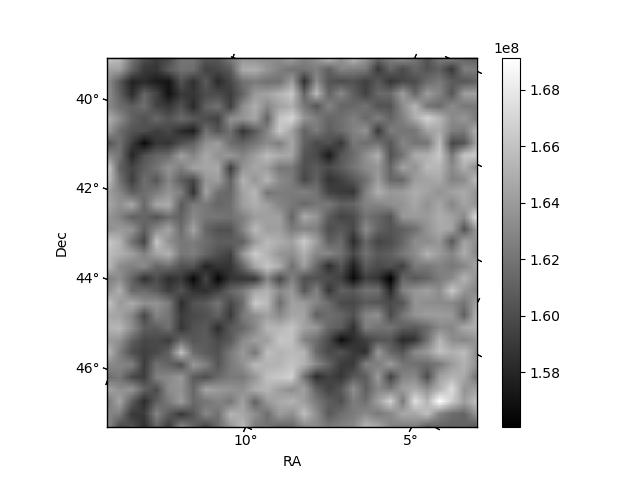
Histogram calculated using DETX and DETY for each event in the final _common_clean file
| Quadrant A | 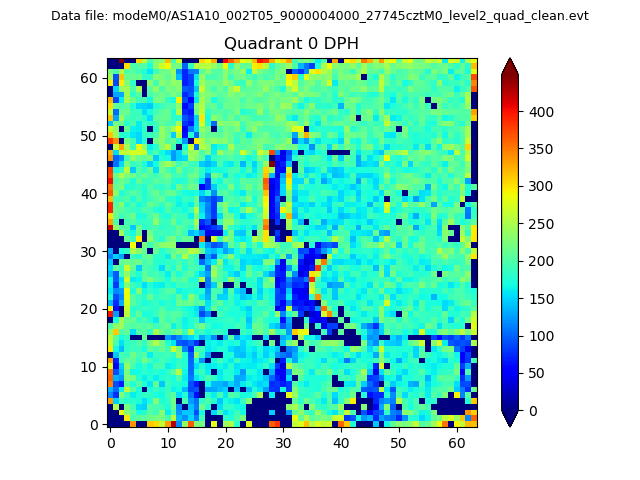 |
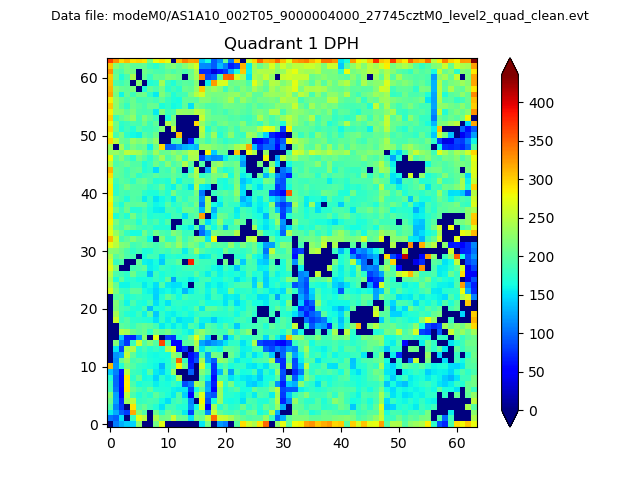 |
Quadrant B |
|---|---|---|---|
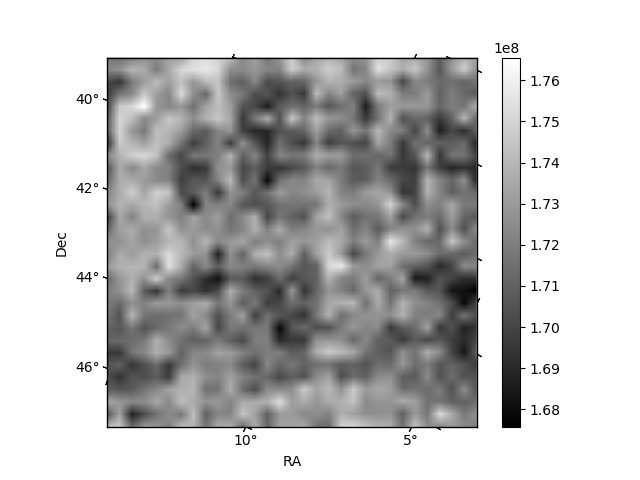
| Quadrant D | 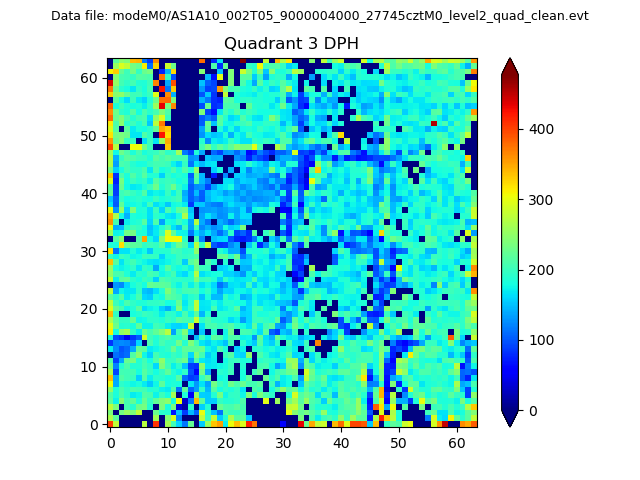 |
 |
Quadrant C |
| Plot type | Count rate plots | Images |
|---|---|---|
| Comparison with Poisson distribution Blue bars denote a histogram of data divided into 1 sec bins. Red curve is a Poisson curve with rate = median count rate of data. |
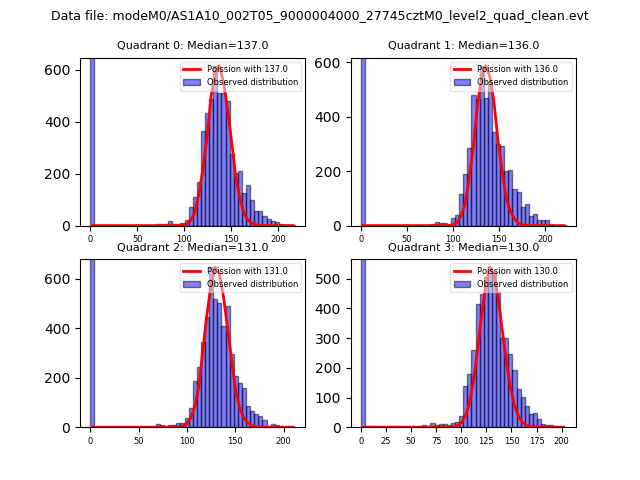 |
 |
| Quadrant-wise count rates Data is divided into 100 sec bins |
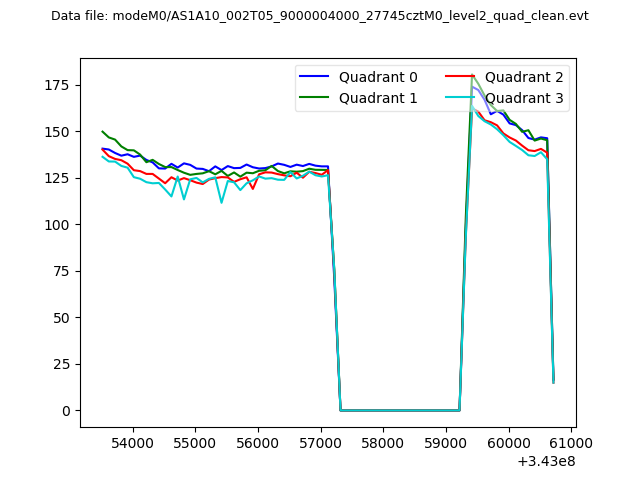 |
|
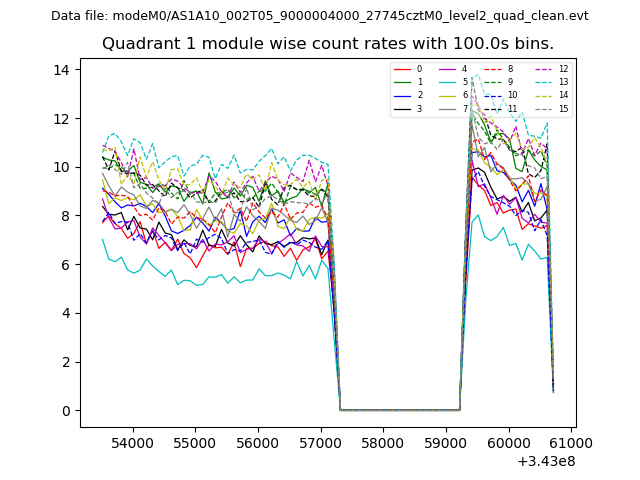
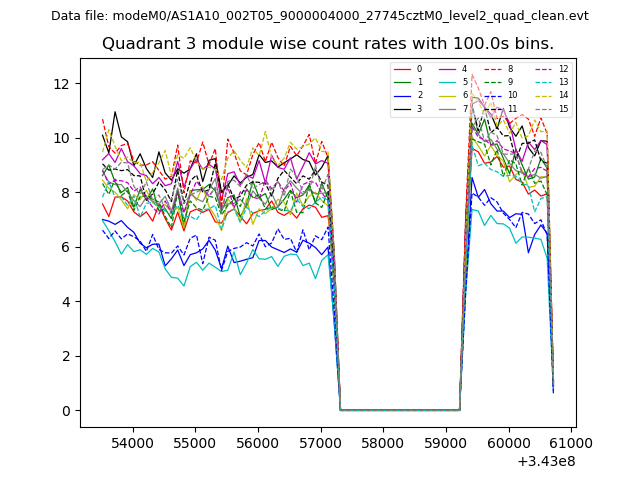
| Module-wise count rates for Quadrant A Data is divided into 100 sec bins |
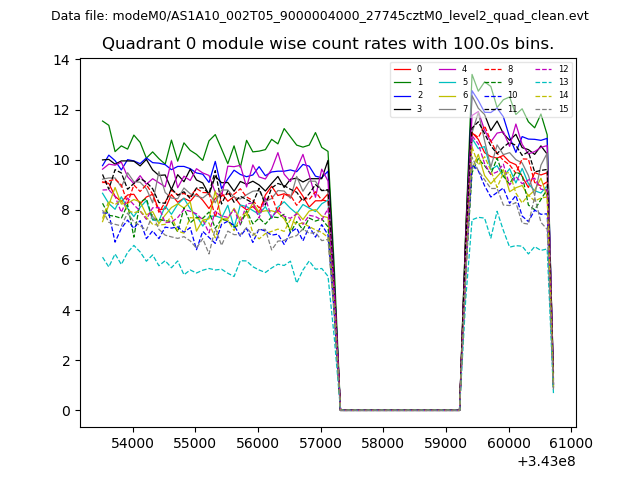 |
 |
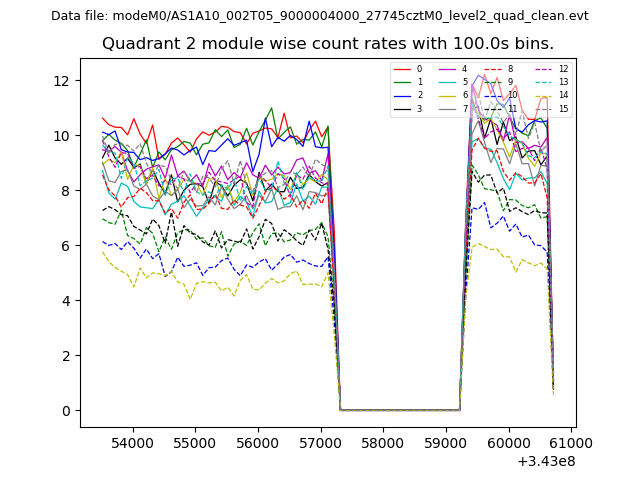
| Module-wise count rates for Quadrant B Data is divided into 100 sec bins |
 |
 |
| Module-wise count rates for Quadrant C Data is divided into 100 sec bins |
 |
 |
| Module-wise count rates for Quadrant D Data is divided into 100 sec bins |
 |
 |
| Parameter | Plot |
|---|---|
| CZT HV Monitor | 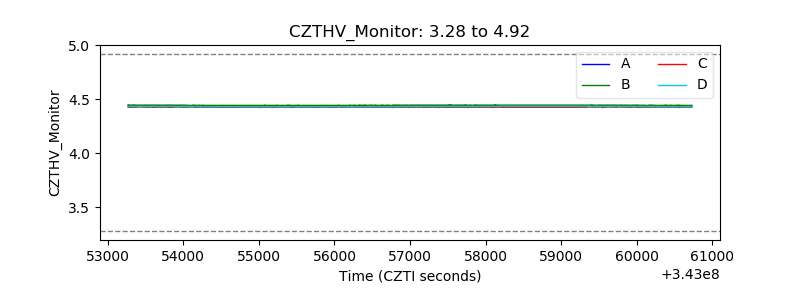 |
| D_VDD | 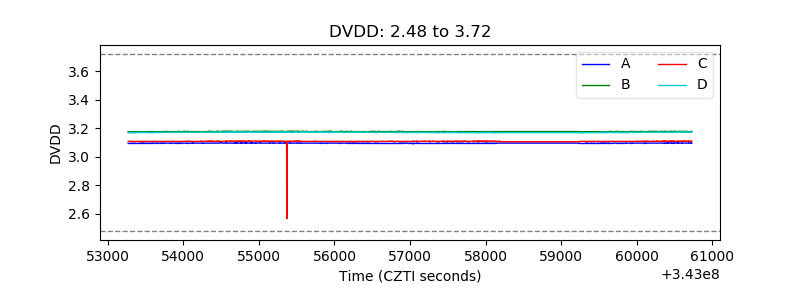 |
| Temperature 1 | 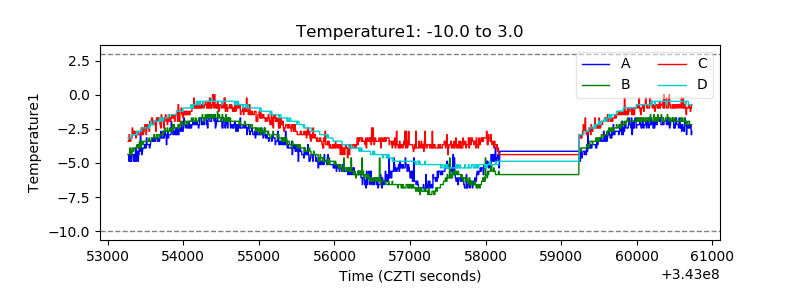 |
| Veto HV Monitor | 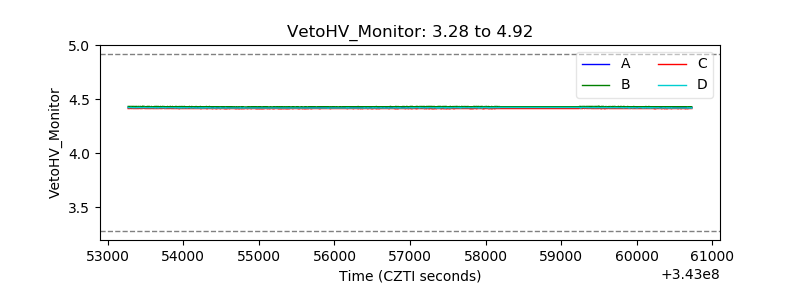 |
| Veto LLD | 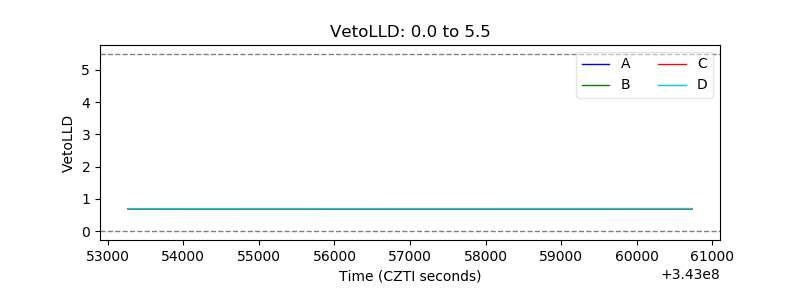 |
| Alpha Counter |  |
| _CPM_Rate | 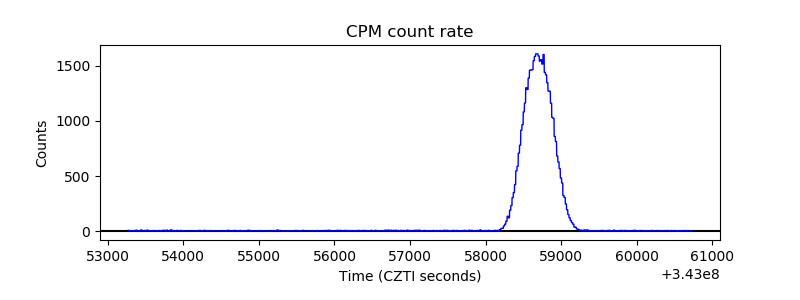 |
| CZT Counter |  |
| +2.5 Volts monitor | 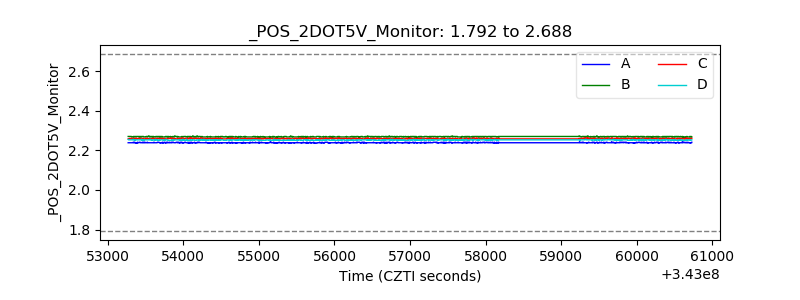 |
| +5 Volts monitor |  |
| _ROLL_ROT | 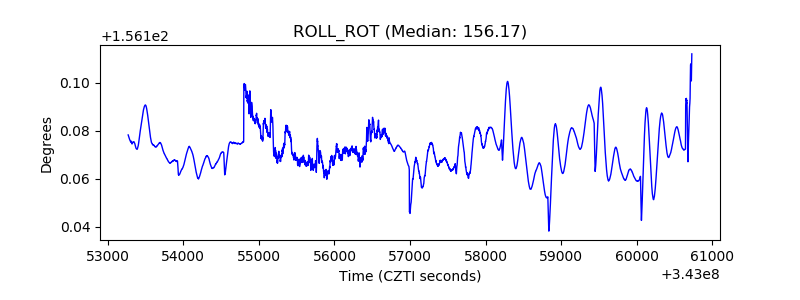 |
| _Roll_DEC | 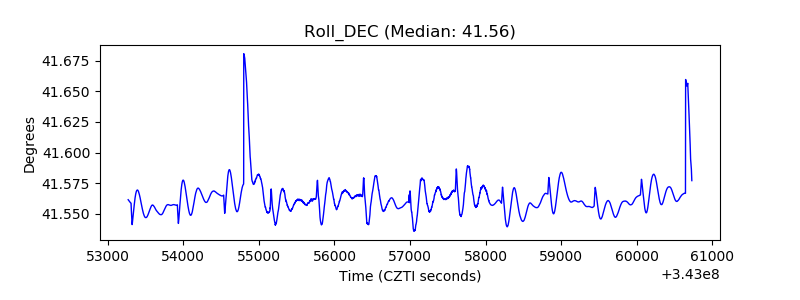 |
| _Roll_RA |  |
| Veto Counter | 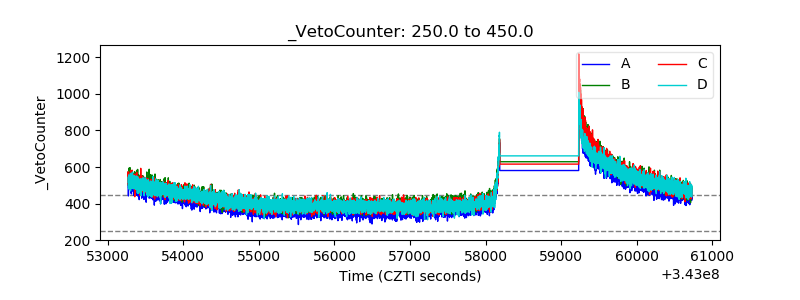 |