| Param | Original file | Final file |
|---|---|---|
| Filename | modeM0/AS1A10_002T05_9000004000_27746cztM0_level2.evt | modeM0/AS1A10_002T05_9000004000_27746cztM0_level2_quad_clean.evt |
| Size (bytes) | 472,389,120 | 110,609,280 |
| Size | 450.5 MB | 105.5 MB |
| Events in quadrant A | 3,255,778 | 751,940 |
| Events in quadrant B | 3,307,778 | 747,533 |
| Events in quadrant C | 3,538,778 | 716,222 |
| Events in quadrant D | 3,784,366 | 702,763 |
| Mode M9 | |||
|---|---|---|---|
| Quadrant | BADHDUFLAG | Total packets | Discarded packets |
| A | 0 | 12 | 0 |
| B | 0 | 12 | 0 |
| C | 0 | 12 | 0 |
| D | 0 | 12 | 0 |
| Mode M0 | |||
|---|---|---|---|
| Quadrant | BADHDUFLAG | Total packets | Discarded packets |
| A | 0 | 13630 | 0 |
| B | 0 | 13862 | 0 |
| C | 0 | 14404 | 0 |
| D | 0 | 15316 | 0 |
| Quadrant | Total seconds | Saturated seconds | Saturation percentage |
|---|---|---|---|
| A | 6186 | 71 | 1.147753% |
| B | 6187 | 80 | 1.293034% |
| C | 6186 | 112 | 1.810540% |
| D | 6186 | 155 | 2.505658% |
Noise dominated data is calculated using 1-second bins in cleaned event files. If a bin has >2000 counts, and if more than 50% of those come from <1% of pixels, then it is considered to be noise-dominated and hence unusable.
| Quadrant | # 1 sec bins | Bins with >0 counts | Bins with >2000 counts | High rate bins dominated by noise | Noise dominated (total time) | Noise dominated (detector-on time) | Marked lightcurve |
|---|---|---|---|---|---|---|---|
| A | 7336 | 6186 | 6 | 6 | 0.08% | 0.10% | 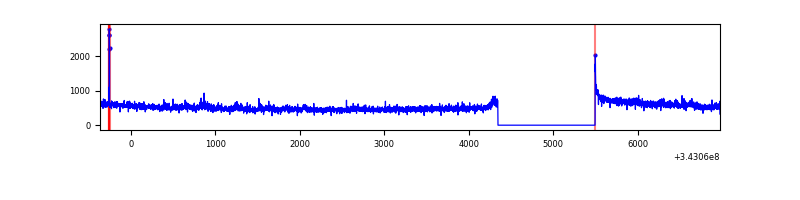 |
| B | 7337 | 6187 | 6 | 6 | 0.08% | 0.10% |  |
| C | 7336 | 6186 | 1 | 1 | 0.01% | 0.02% | 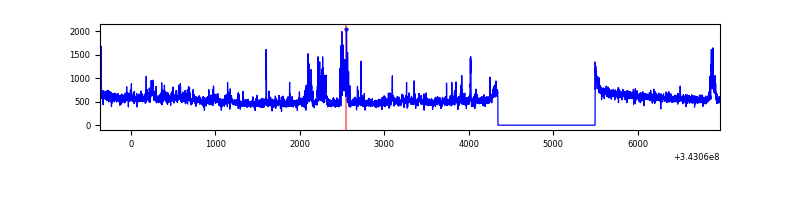 |
| D | 7336 | 6186 | 83 | 83 | 1.13% | 1.34% | 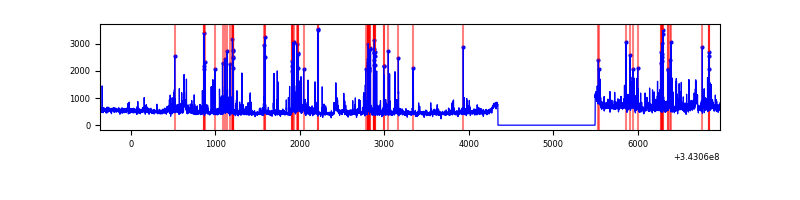 |
Top three noisy pixels from each quadrant. If the there are fewer than three noisy pixels in the level2.evt file, extra rows are filled as -1
| Pixel properties | Quadrant properties | ||||||
|---|---|---|---|---|---|---|---|
| Quadrant | DetID | PixID | Counts | Sigma | Mean | Median | Sigma |
| A | 0 | 13 | 133121 | 823.56 | 808 | 793 | 160.7 |
| A | 13 | 254 | 10908 | 62.95 | 808 | 793 | 160.7 |
| A | 8 | 192 | 7216 | 39.97 | 808 | 793 | 160.7 |
| B | 10 | 245 | 113797 | 766.02 | 790 | 771 | 147.5 |
| B | 0 | 190 | 46506 | 309.96 | 790 | 771 | 147.5 |
| B | 4 | 200 | 31870 | 210.77 | 790 | 771 | 147.5 |
| C | 3 | 233 | 327989 | 1809.46 | 773 | 779 | 180.8 |
| C | 14 | 238 | 123518 | 678.74 | 773 | 779 | 180.8 |
| C | 10 | 22 | 70638 | 386.32 | 773 | 779 | 180.8 |
| D | 1 | 52 | 616346 | 3372.82 | 782 | 764 | 182.5 |
| D | 13 | 104 | 121302 | 660.44 | 782 | 764 | 182.5 |
| D | 2 | 250 | 48810 | 263.25 | 782 | 764 | 182.5 |
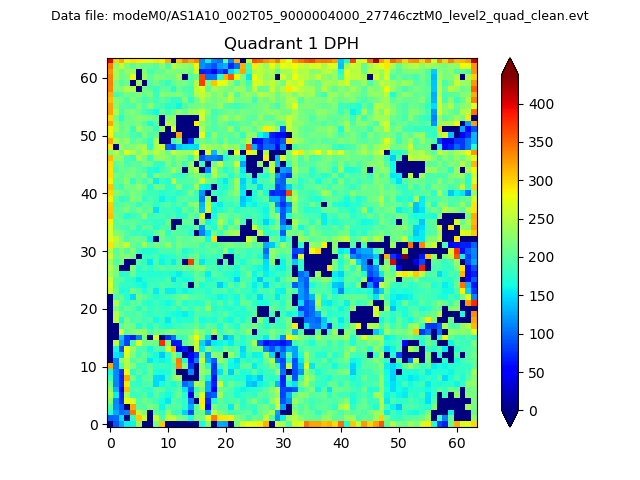
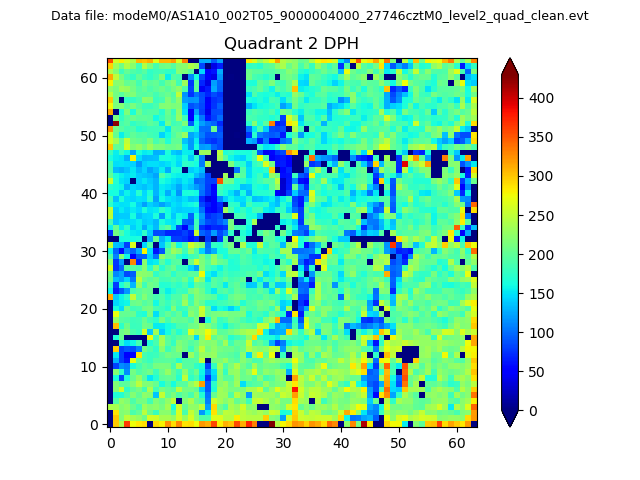
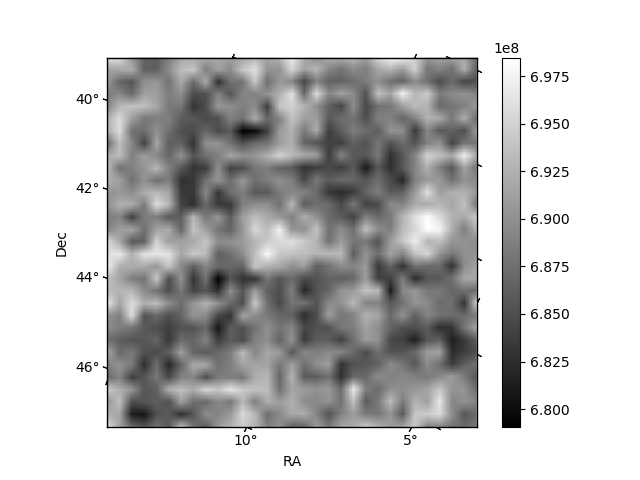
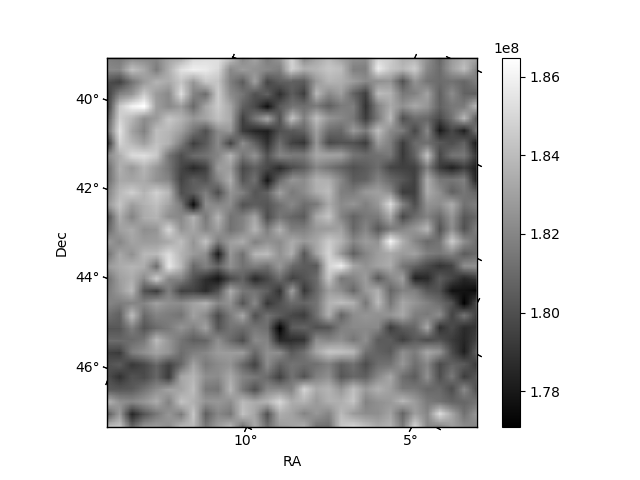
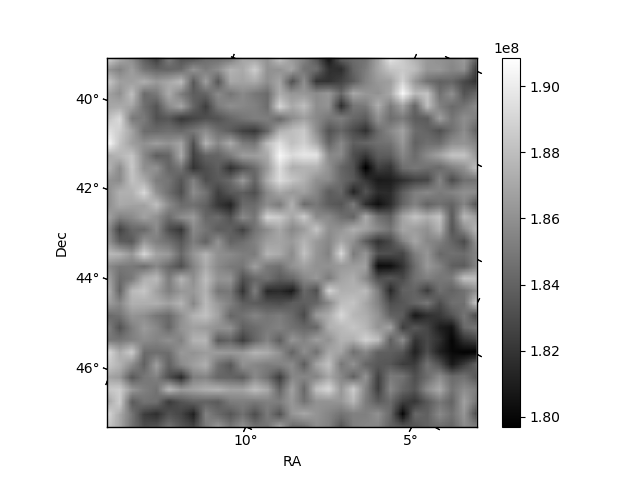
Histogram calculated using DETX and DETY for each event in the final _common_clean file
| Quadrant A | 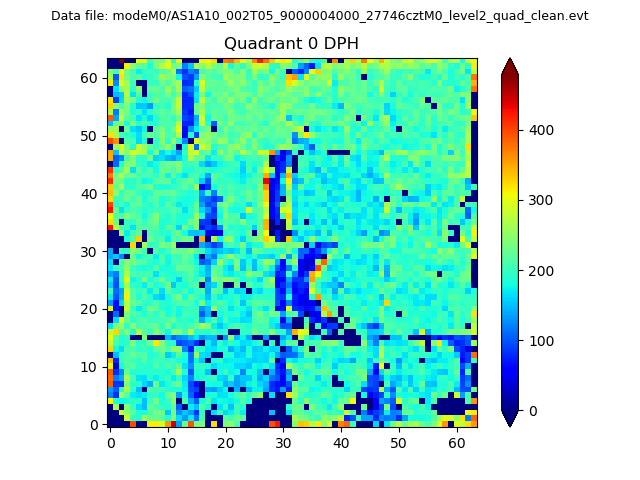 |
 |
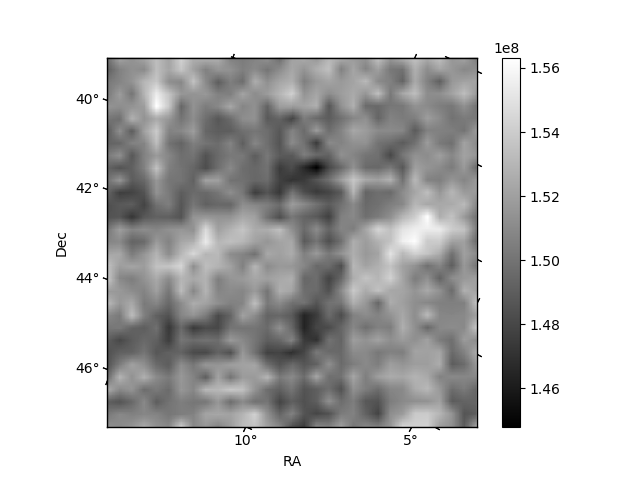
Quadrant B |
|---|---|---|---|
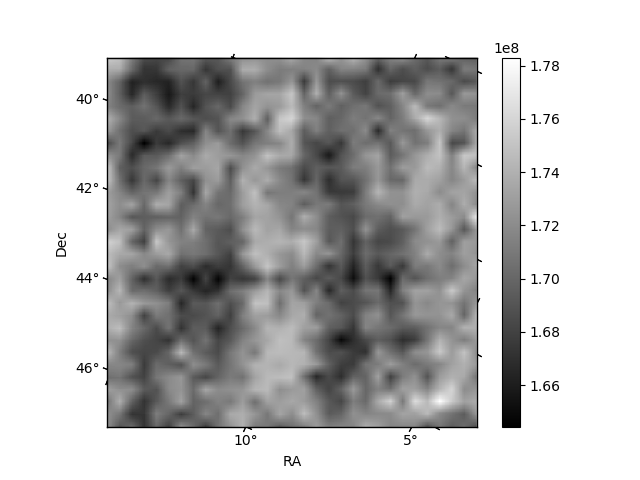
| Quadrant D | 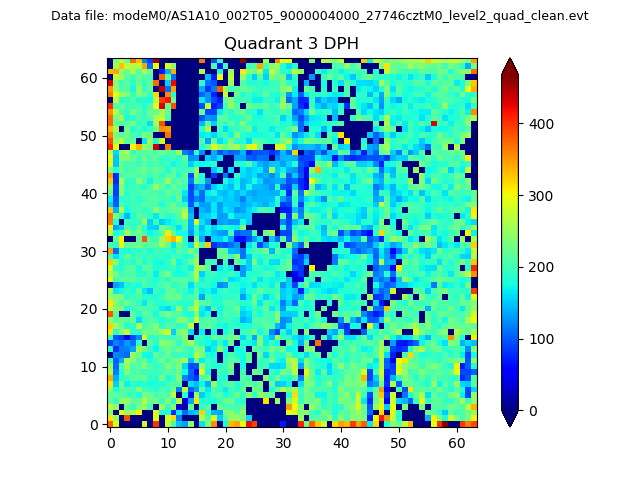 |
 |
Quadrant C |
| Plot type | Count rate plots | Images |
|---|---|---|
| Comparison with Poisson distribution Blue bars denote a histogram of data divided into 1 sec bins. Red curve is a Poisson curve with rate = median count rate of data. |
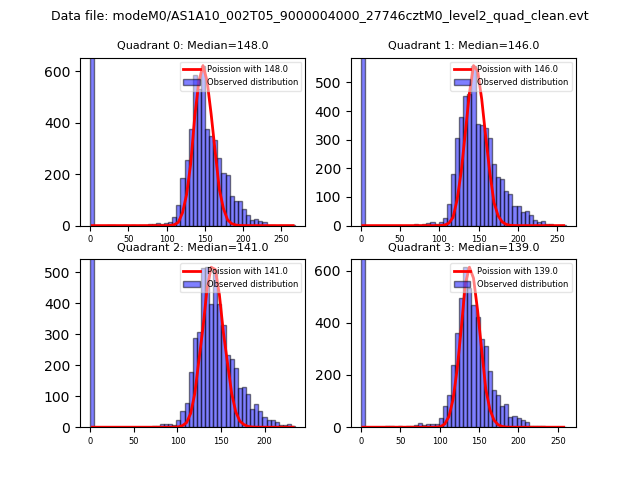 |
 |
| Quadrant-wise count rates Data is divided into 100 sec bins |
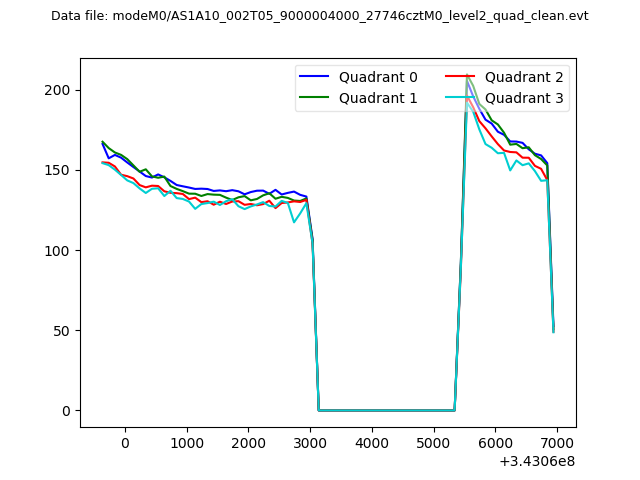 |
|
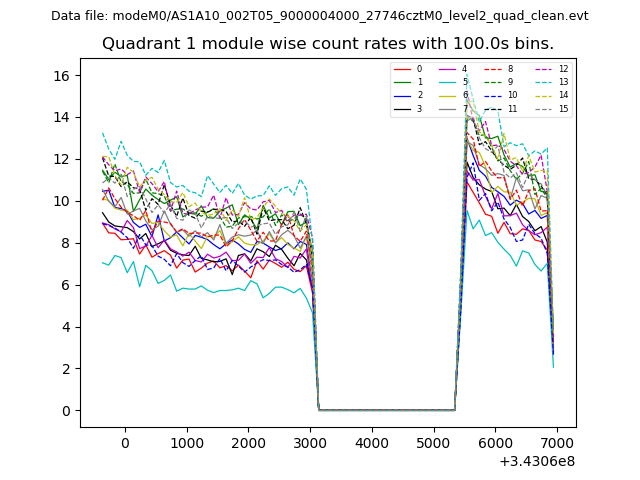
| Module-wise count rates for Quadrant A Data is divided into 100 sec bins |
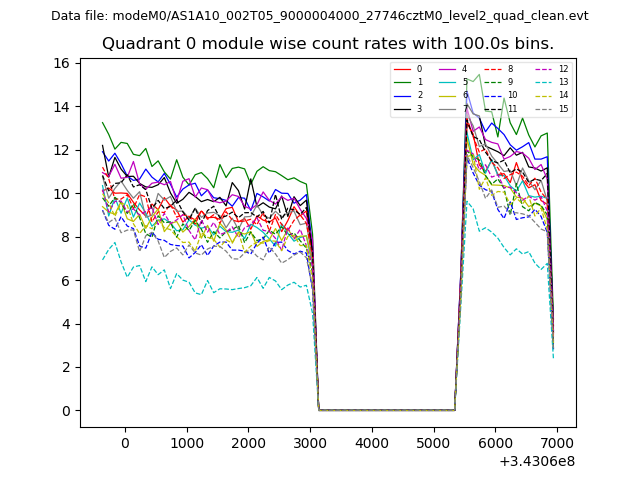 |
 |
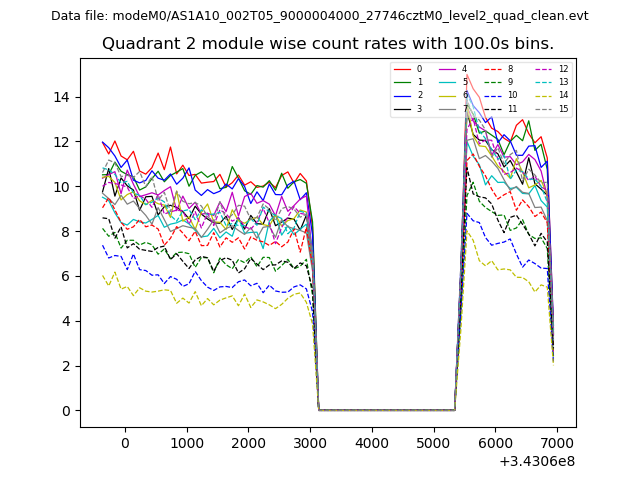
| Module-wise count rates for Quadrant B Data is divided into 100 sec bins |
 |
 |
| Module-wise count rates for Quadrant C Data is divided into 100 sec bins |
 |
 |
| Module-wise count rates for Quadrant D Data is divided into 100 sec bins |
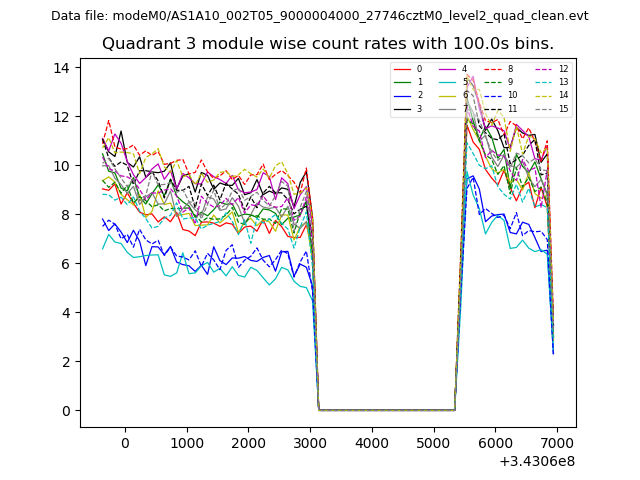 |
 |
| Parameter | Plot |
|---|---|
| CZT HV Monitor | 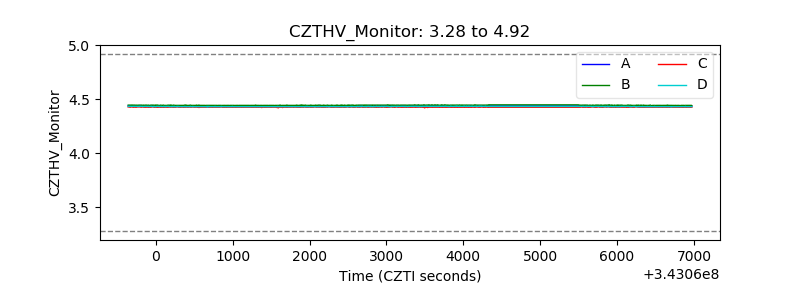 |
| D_VDD | 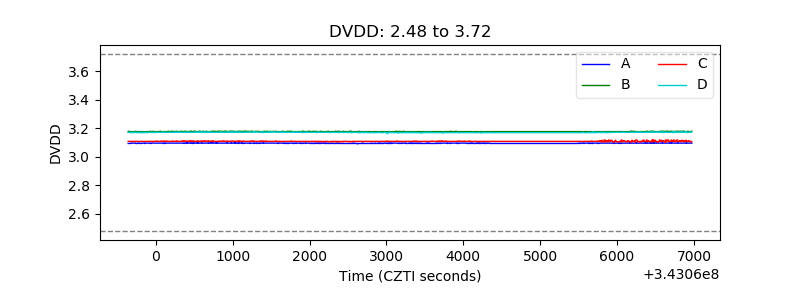 |
| Temperature 1 |  |
| Veto HV Monitor | 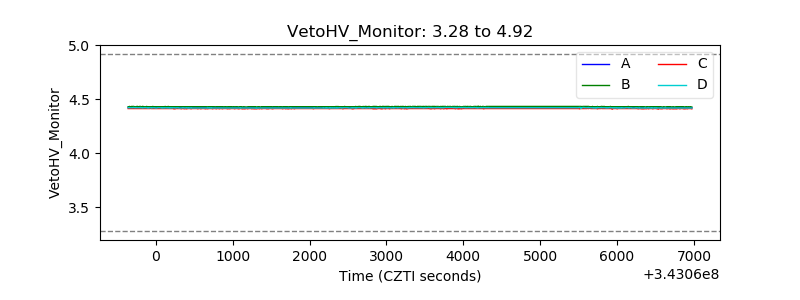 |
| Veto LLD | 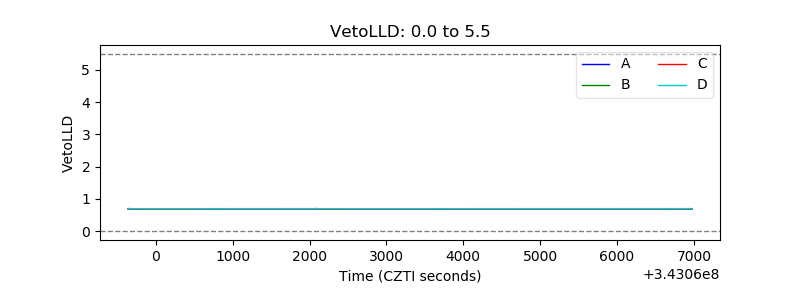 |
| Alpha Counter | 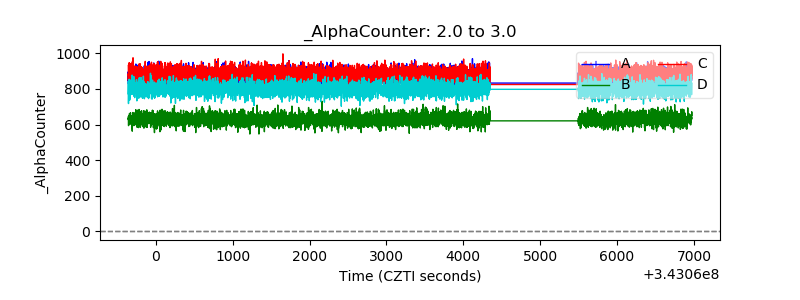 |
| _CPM_Rate | 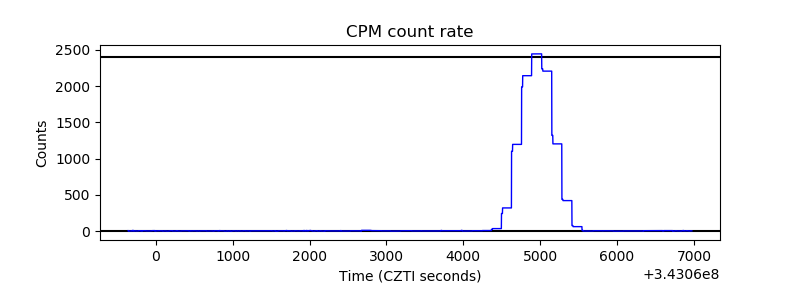 |
| CZT Counter | 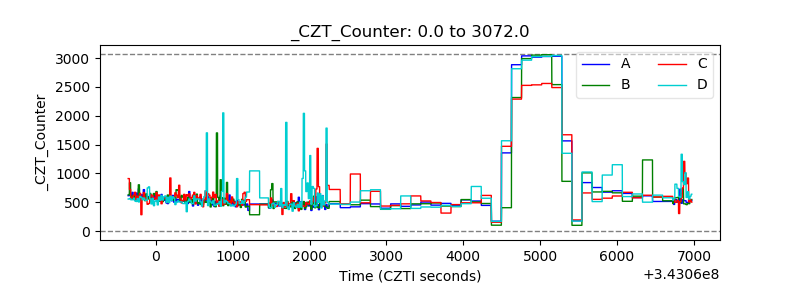 |
| +2.5 Volts monitor |  |
| +5 Volts monitor | 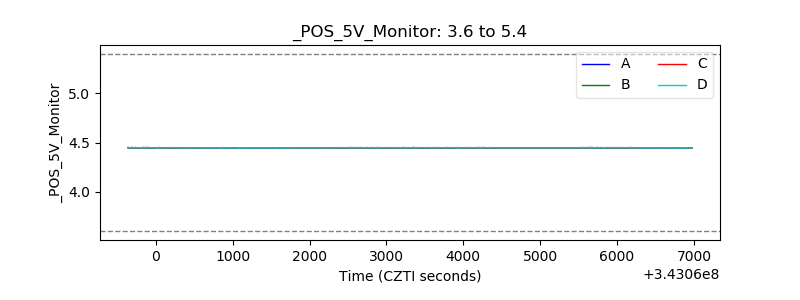 |
| _ROLL_ROT | 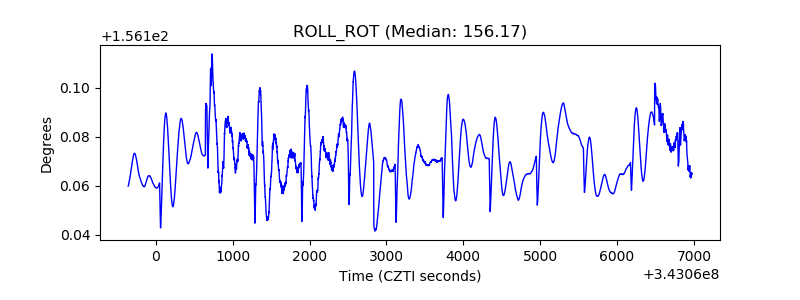 |
| _Roll_DEC | 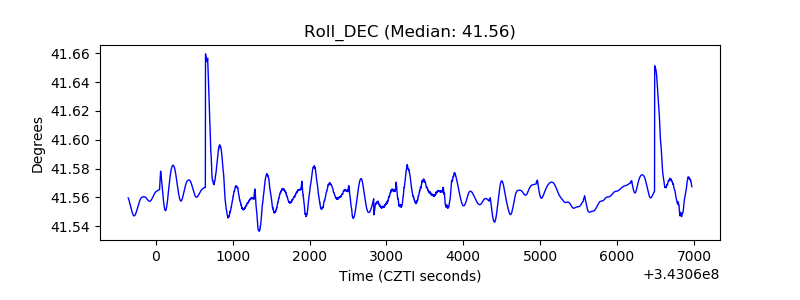 |
| _Roll_RA | 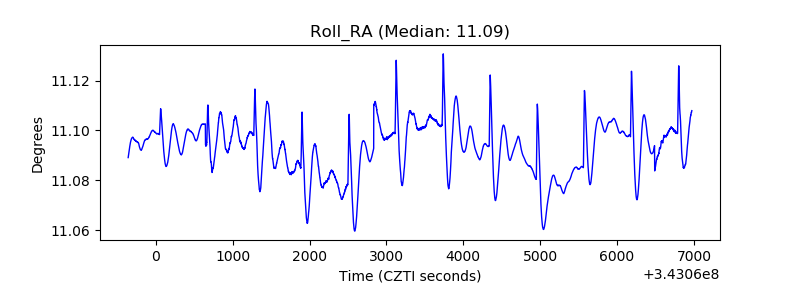 |
| Veto Counter | 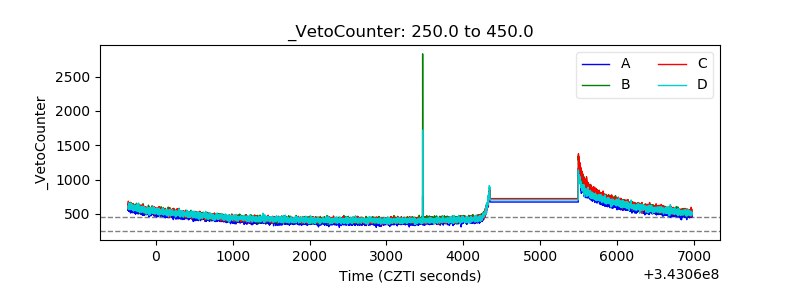 |