| Param | Original file | Final file |
|---|---|---|
| Filename | modeM0/AS1A10_002T05_9000004000_27747cztM0_level2.evt | modeM0/AS1A10_002T05_9000004000_27747cztM0_level2_quad_clean.evt |
| Size (bytes) | 514,535,040 | 118,010,880 |
| Size | 490.7 MB | 112.5 MB |
| Events in quadrant A | 3,699,842 | 803,033 |
| Events in quadrant B | 3,523,647 | 801,305 |
| Events in quadrant C | 3,600,814 | 771,371 |
| Events in quadrant D | 4,320,711 | 748,292 |
| Mode M9 | |||
|---|---|---|---|
| Quadrant | BADHDUFLAG | Total packets | Discarded packets |
| A | 0 | 17 | 0 |
| B | 0 | 18 | 0 |
| C | 0 | 18 | 0 |
| D | 0 | 18 | 0 |
| Mode M0 | |||
|---|---|---|---|
| Quadrant | BADHDUFLAG | Total packets | Discarded packets |
| A | 0 | 15372 | 0 |
| B | 0 | 14642 | 0 |
| C | 0 | 14789 | 0 |
| D | 0 | 17224 | 0 |
| Quadrant | Total seconds | Saturated seconds | Saturation percentage |
|---|---|---|---|
| A | 6459 | 81 | 1.254064% |
| B | 6459 | 71 | 1.099241% |
| C | 6459 | 107 | 1.656603% |
| D | 6459 | 155 | 2.399752% |
Noise dominated data is calculated using 1-second bins in cleaned event files. If a bin has >2000 counts, and if more than 50% of those come from <1% of pixels, then it is considered to be noise-dominated and hence unusable.
| Quadrant | # 1 sec bins | Bins with >0 counts | Bins with >2000 counts | High rate bins dominated by noise | Noise dominated (total time) | Noise dominated (detector-on time) | Marked lightcurve |
|---|---|---|---|---|---|---|---|
| A | 7754 | 6459 | 4 | 4 | 0.05% | 0.06% | 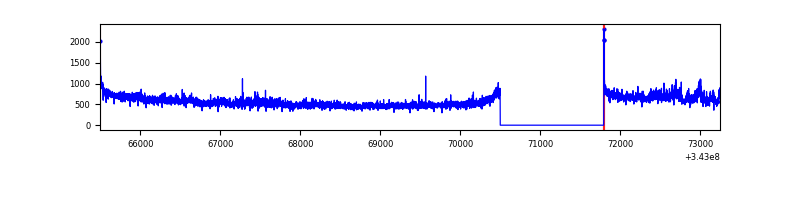 |
| B | 7754 | 6459 | 3 | 3 | 0.04% | 0.05% | 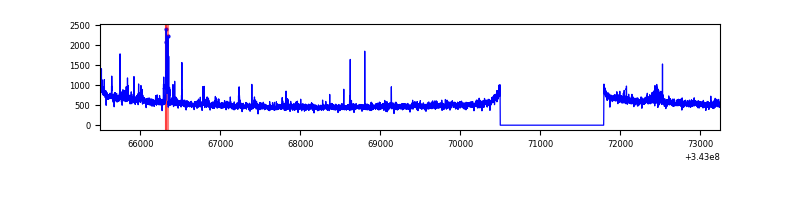 |
| C | 7754 | 6459 | 0 | 0 | 0.00% | 0.00% | 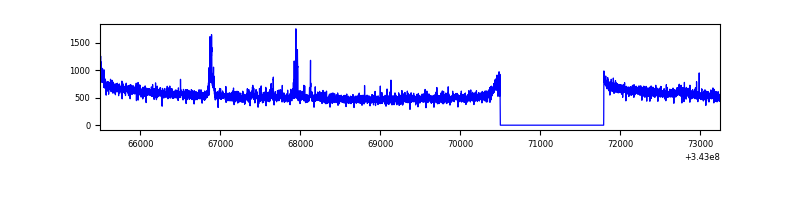 |
| D | 7754 | 6459 | 83 | 83 | 1.07% | 1.29% | 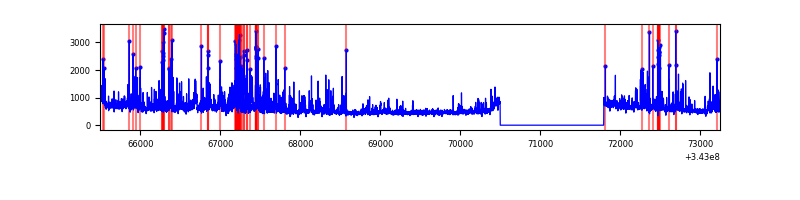 |
Top three noisy pixels from each quadrant. If the there are fewer than three noisy pixels in the level2.evt file, extra rows are filled as -1
| Pixel properties | Quadrant properties | ||||||
|---|---|---|---|---|---|---|---|
| Quadrant | DetID | PixID | Counts | Sigma | Mean | Median | Sigma |
| A | 0 | 13 | 222992 | 1283.03 | 880 | 867 | 173.1 |
| A | 6 | 16 | 70036 | 399.53 | 880 | 867 | 173.1 |
| A | 8 | 192 | 14319 | 77.7 | 880 | 867 | 173.1 |
| B | 0 | 190 | 61930 | 382.33 | 863 | 844 | 159.8 |
| B | 10 | 245 | 42257 | 259.2 | 863 | 844 | 159.8 |
| B | 4 | 200 | 21119 | 126.9 | 863 | 844 | 159.8 |
| C | 14 | 238 | 135026 | 691.46 | 843 | 852 | 194.0 |
| C | 3 | 233 | 132445 | 678.15 | 843 | 852 | 194.0 |
| C | 8 | 208 | 16632 | 81.32 | 843 | 852 | 194.0 |
| D | 1 | 52 | 994006 | 5007.09 | 851 | 833 | 198.4 |
| D | 2 | 250 | 64828 | 322.63 | 851 | 833 | 198.4 |
| D | 2 | 234 | 28670 | 140.34 | 851 | 833 | 198.4 |
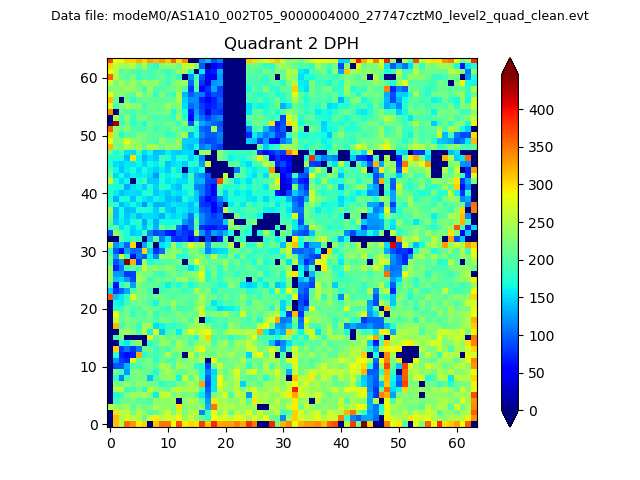
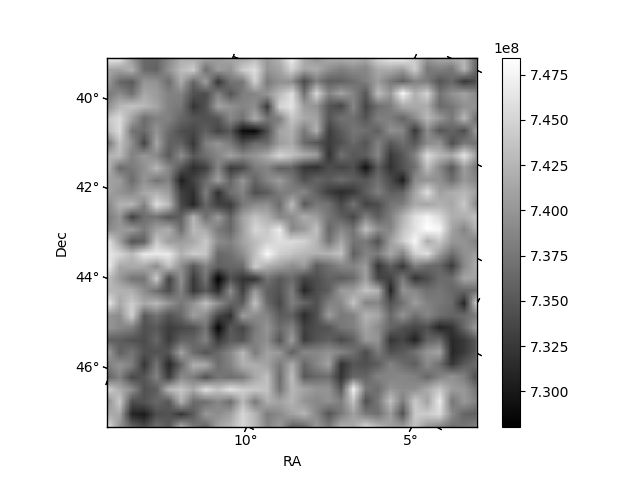
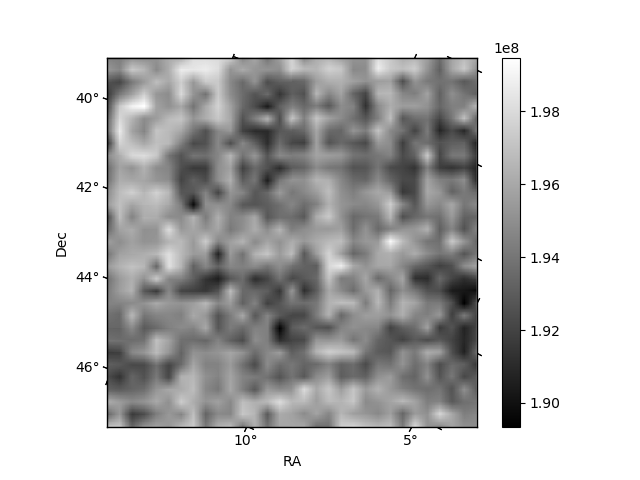
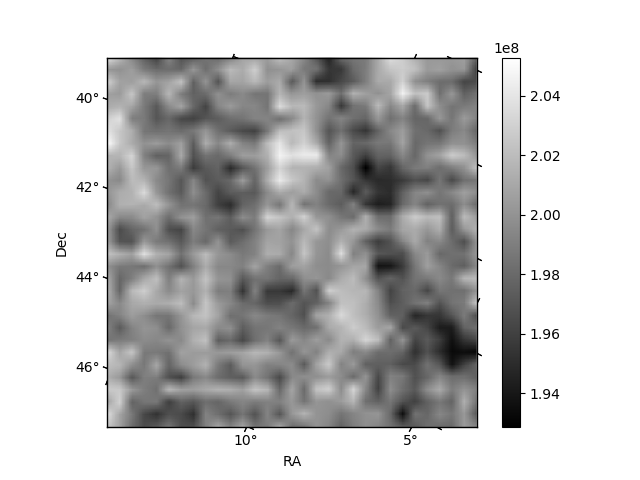
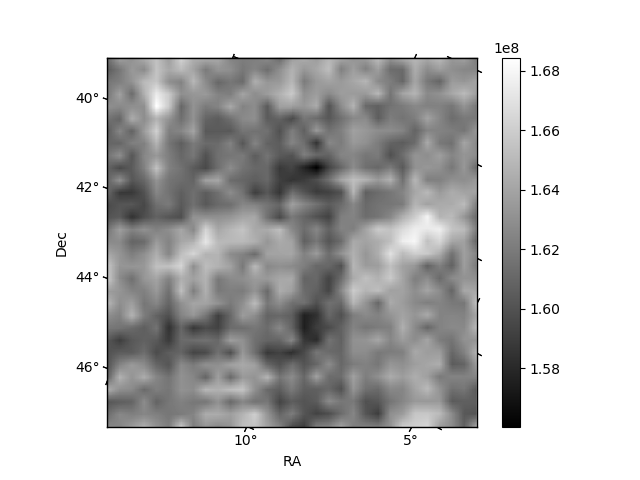
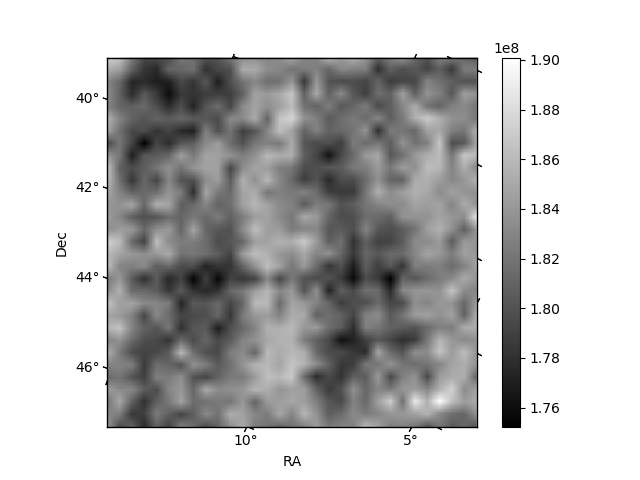
Histogram calculated using DETX and DETY for each event in the final _common_clean file
| Quadrant A | 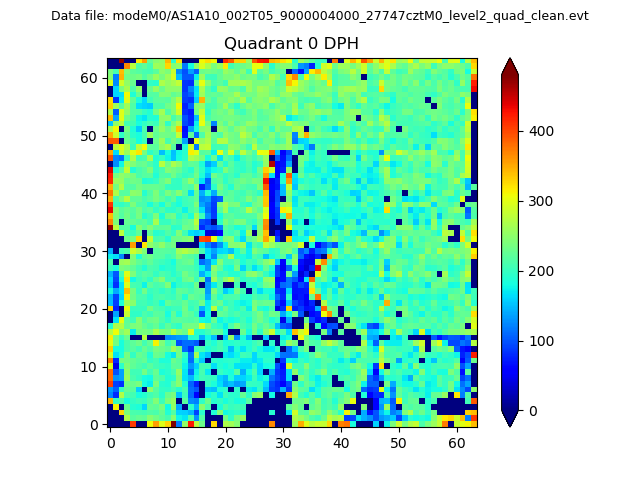 |
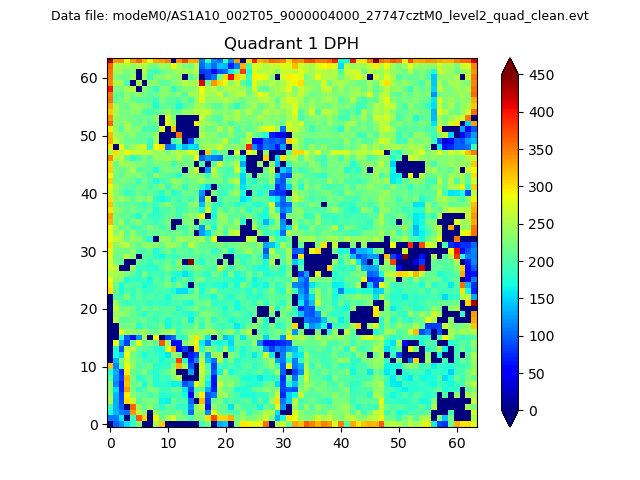 |
Quadrant B |
|---|---|---|---|
| Quadrant D | 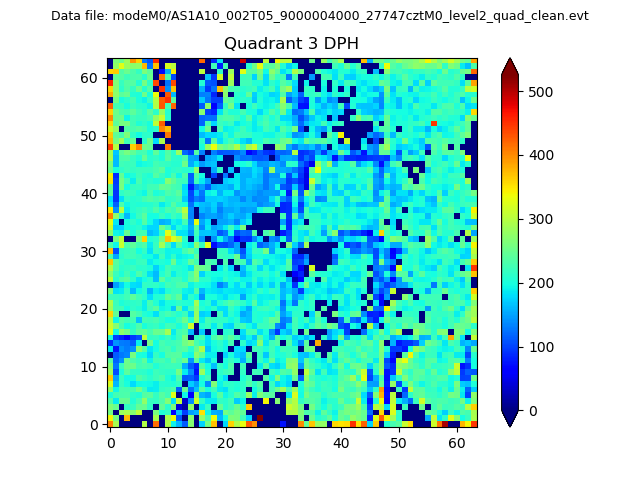 |
 |
Quadrant C |
| Plot type | Count rate plots | Images |
|---|---|---|
| Comparison with Poisson distribution Blue bars denote a histogram of data divided into 1 sec bins. Red curve is a Poisson curve with rate = median count rate of data. |
 |
 |
| Quadrant-wise count rates Data is divided into 100 sec bins |
 |
|
| Module-wise count rates for Quadrant A Data is divided into 100 sec bins |
 |
 |
| Module-wise count rates for Quadrant B Data is divided into 100 sec bins |
 |
 |
| Module-wise count rates for Quadrant C Data is divided into 100 sec bins |
 |
 |
| Module-wise count rates for Quadrant D Data is divided into 100 sec bins |
 |
 |
| Parameter | Plot |
|---|---|
| CZT HV Monitor |  |
| D_VDD | 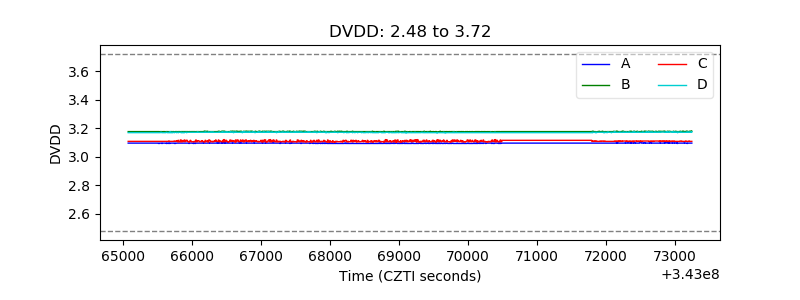 |
| Temperature 1 | 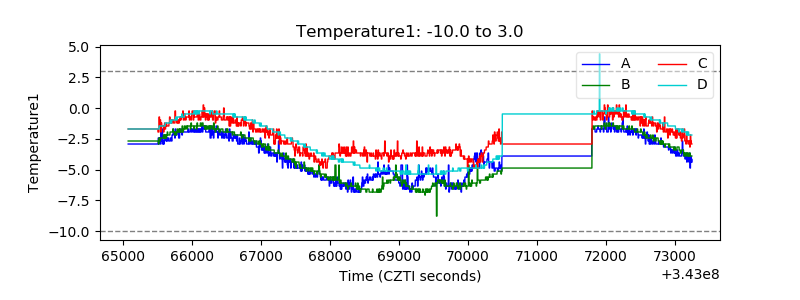 |
| Veto HV Monitor | 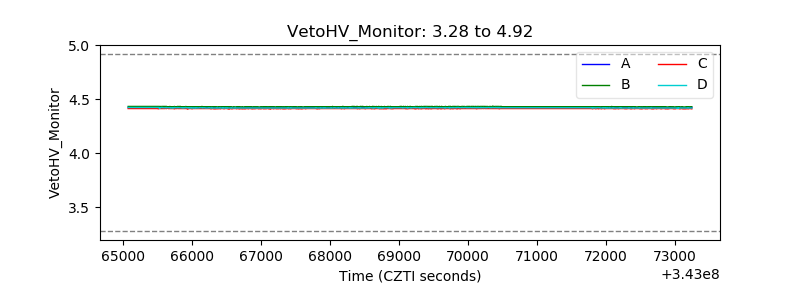 |
| Veto LLD | 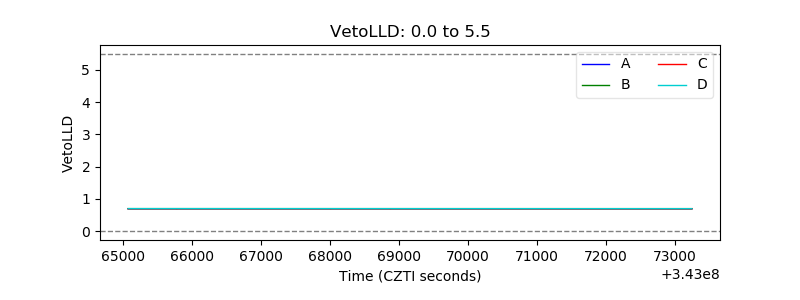 |
| Alpha Counter |  |
| _CPM_Rate |  |
| CZT Counter | 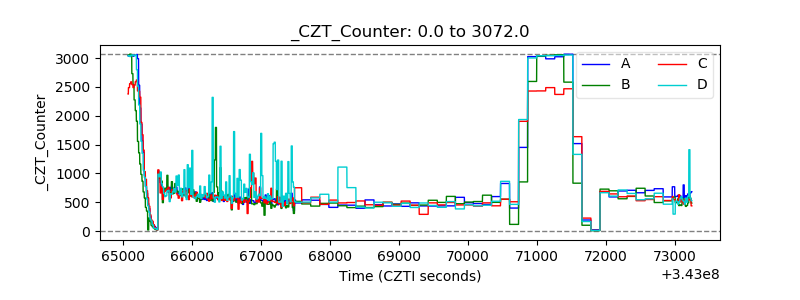 |
| +2.5 Volts monitor |  |
| +5 Volts monitor |  |
| _ROLL_ROT |  |
| _Roll_DEC | 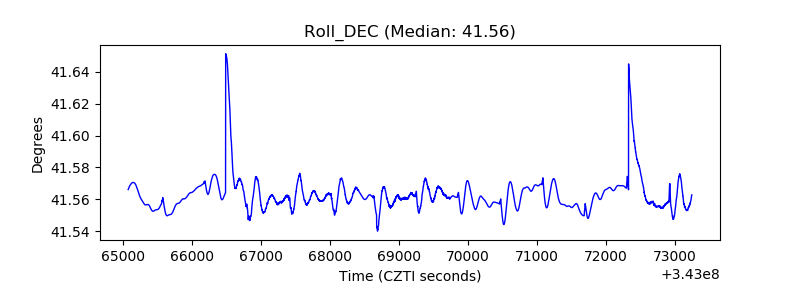 |
| _Roll_RA | 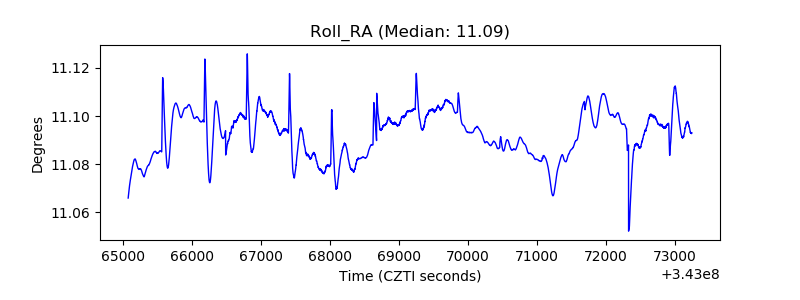 |
| Veto Counter |  |