| Param | Original file | Final file |
|---|---|---|
| Filename | modeM0/AS1A10_002T05_9000004000_27748cztM0_level2.evt | modeM0/AS1A10_002T05_9000004000_27748cztM0_level2_quad_clean.evt |
| Size (bytes) | 488,407,680 | 105,958,080 |
| Size | 465.8 MB | 101.0 MB |
| Events in quadrant A | 3,472,484 | 712,169 |
| Events in quadrant B | 3,465,705 | 711,121 |
| Events in quadrant C | 3,572,515 | 687,273 |
| Events in quadrant D | 3,862,003 | 667,613 |
| Mode M9 | |||
|---|---|---|---|
| Quadrant | BADHDUFLAG | Total packets | Discarded packets |
| A | 0 | 14 | 0 |
| B | 0 | 15 | 0 |
| C | 0 | 15 | 0 |
| D | 0 | 15 | 0 |
| Mode M0 | |||
|---|---|---|---|
| Quadrant | BADHDUFLAG | Total packets | Discarded packets |
| A | 0 | 14447 | 0 |
| B | 0 | 14300 | 0 |
| C | 0 | 14610 | 0 |
| D | 0 | 15596 | 0 |
| Quadrant | Total seconds | Saturated seconds | Saturation percentage |
|---|---|---|---|
| A | 6171 | 63 | 1.020904% |
| B | 6171 | 85 | 1.377410% |
| C | 6170 | 133 | 2.155592% |
| D | 6170 | 134 | 2.171799% |
Noise dominated data is calculated using 1-second bins in cleaned event files. If a bin has >2000 counts, and if more than 50% of those come from <1% of pixels, then it is considered to be noise-dominated and hence unusable.
| Quadrant | # 1 sec bins | Bins with >0 counts | Bins with >2000 counts | High rate bins dominated by noise | Noise dominated (total time) | Noise dominated (detector-on time) | Marked lightcurve |
|---|---|---|---|---|---|---|---|
| A | 7491 | 6171 | 5 | 5 | 0.07% | 0.08% | 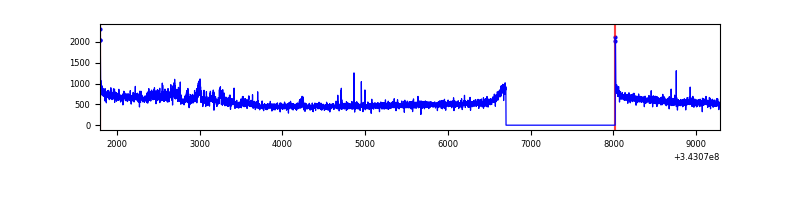 |
| B | 7491 | 6172 | 16 | 16 | 0.21% | 0.26% | 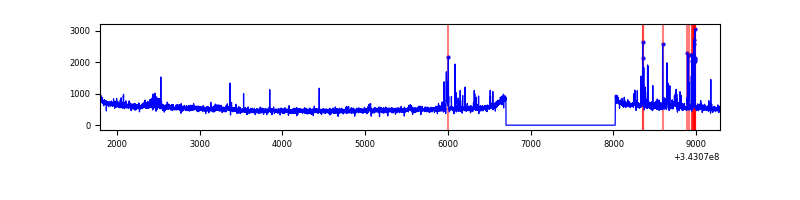 |
| C | 7490 | 6170 | 8 | 8 | 0.11% | 0.13% | 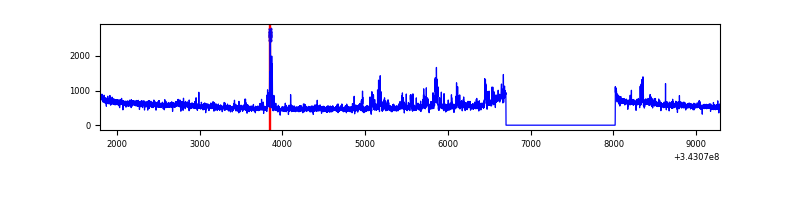 |
| D | 7490 | 6170 | 68 | 68 | 0.91% | 1.10% | 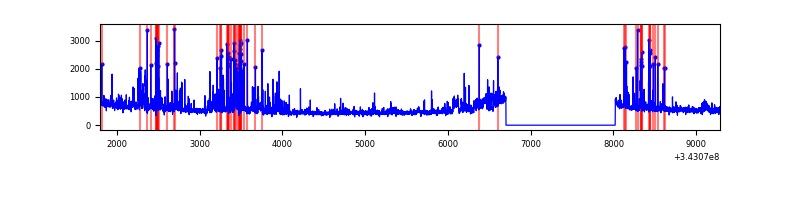 |
Top three noisy pixels from each quadrant. If the there are fewer than three noisy pixels in the level2.evt file, extra rows are filled as -1
| Pixel properties | Quadrant properties | ||||||
|---|---|---|---|---|---|---|---|
| Quadrant | DetID | PixID | Counts | Sigma | Mean | Median | Sigma |
| A | 0 | 13 | 111650 | 667.35 | 841 | 825 | 166.1 |
| A | 6 | 16 | 101411 | 605.7 | 841 | 825 | 166.1 |
| A | 8 | 192 | 15528 | 88.54 | 841 | 825 | 166.1 |
| B | 10 | 245 | 141835 | 929.53 | 826 | 807 | 151.7 |
| B | 0 | 190 | 49600 | 321.6 | 826 | 807 | 151.7 |
| B | 4 | 200 | 32875 | 211.36 | 826 | 807 | 151.7 |
| C | 3 | 233 | 214250 | 1147.19 | 809 | 817 | 186.0 |
| C | 14 | 238 | 130519 | 697.14 | 809 | 817 | 186.0 |
| C | 10 | 22 | 50275 | 265.83 | 809 | 817 | 186.0 |
| D | 1 | 52 | 643800 | 3326.82 | 817 | 797 | 193.3 |
| D | 2 | 250 | 101109 | 519.0 | 817 | 797 | 193.3 |
| D | 2 | 234 | 27269 | 136.96 | 817 | 797 | 193.3 |
Histogram calculated using DETX and DETY for each event in the final _common_clean file
| Quadrant A | 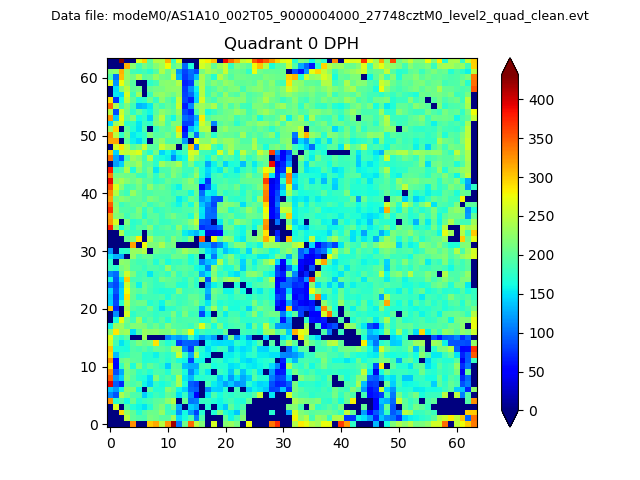 |
 |
Quadrant B |
|---|---|---|---|
| Quadrant D |  |
 |
Quadrant C |
| Plot type | Count rate plots | Images |
|---|---|---|
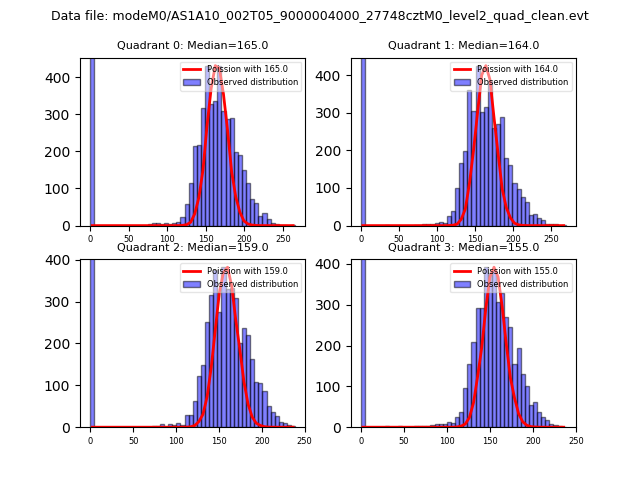
| Comparison with Poisson distribution Blue bars denote a histogram of data divided into 1 sec bins. Red curve is a Poisson curve with rate = median count rate of data. |
 |
 |
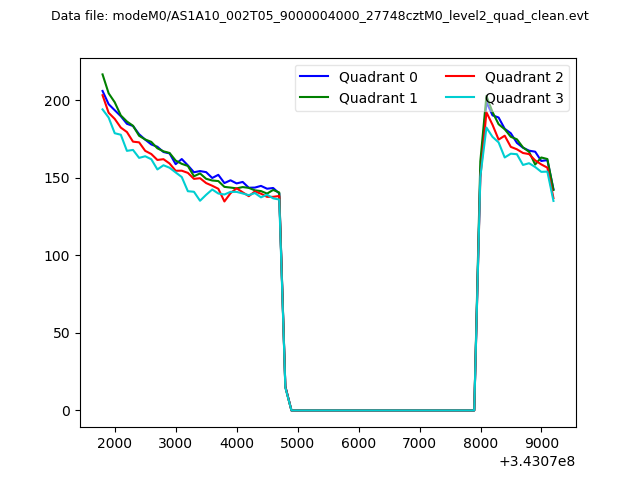
| Quadrant-wise count rates Data is divided into 100 sec bins |
 |
|
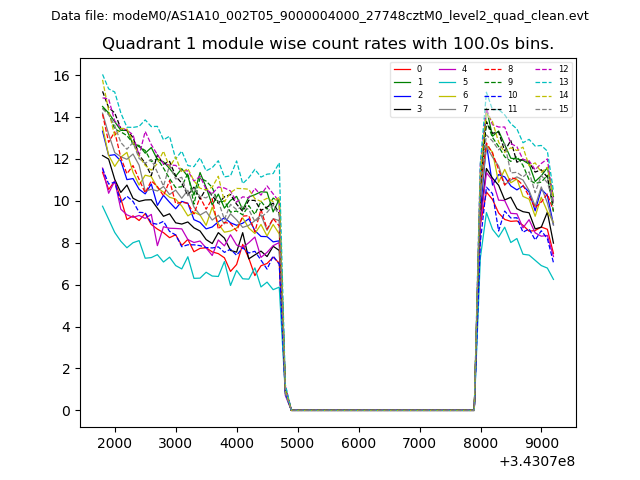
| Module-wise count rates for Quadrant A Data is divided into 100 sec bins |
 |
 |
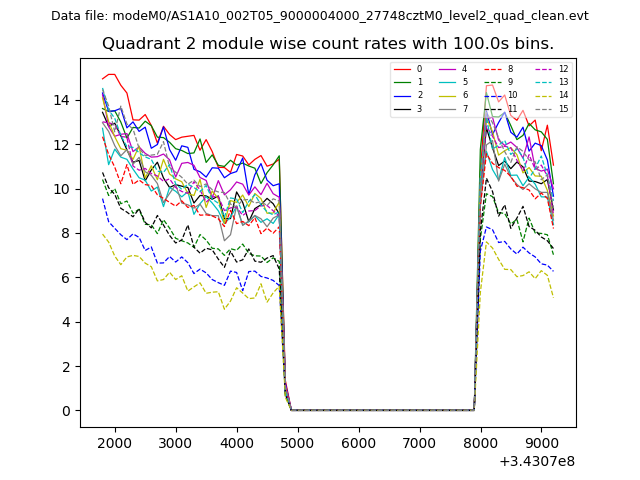
| Module-wise count rates for Quadrant B Data is divided into 100 sec bins |
 |
 |
| Module-wise count rates for Quadrant C Data is divided into 100 sec bins |
 |
 |
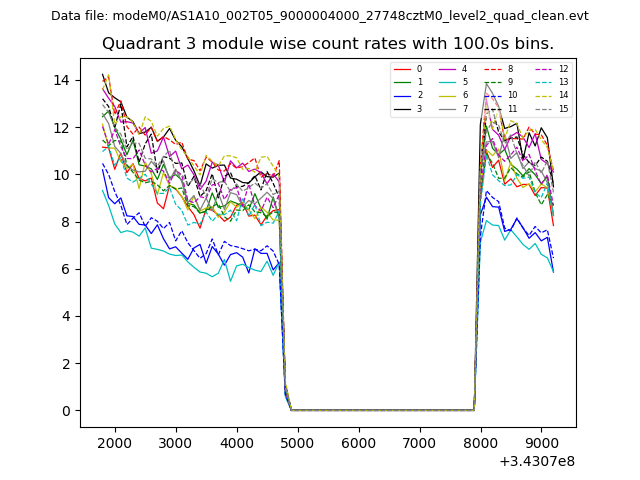
| Module-wise count rates for Quadrant D Data is divided into 100 sec bins |
 |
 |
| Parameter | Plot |
|---|---|
| CZT HV Monitor | 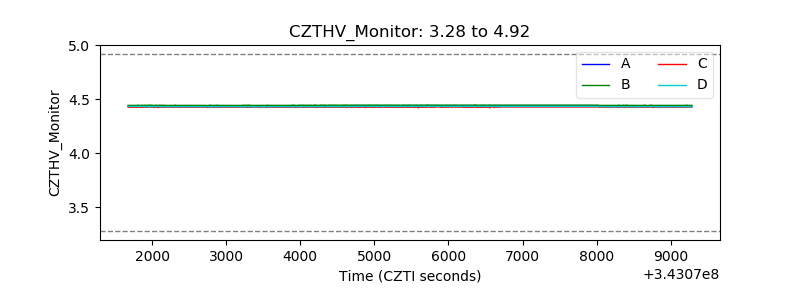 |
| D_VDD | 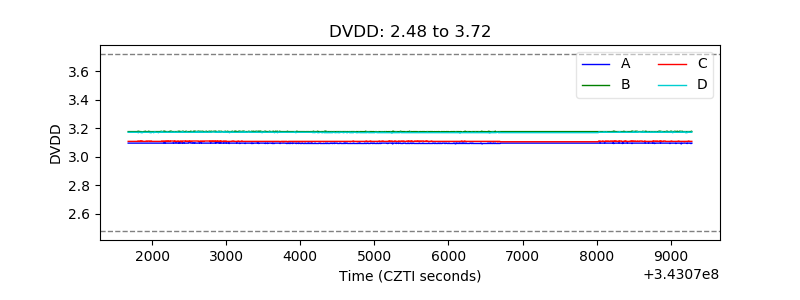 |
| Temperature 1 | 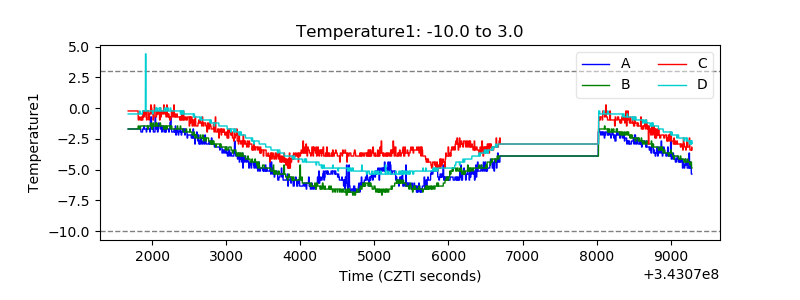 |
| Veto HV Monitor | 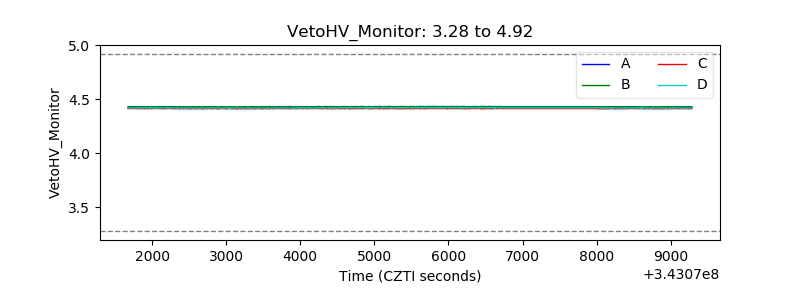 |
| Veto LLD | 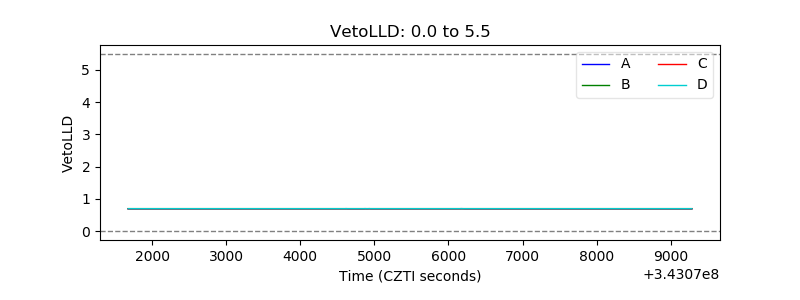 |
| Alpha Counter | 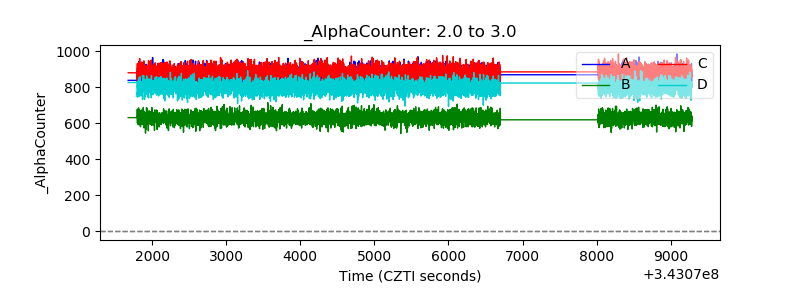 |
| _CPM_Rate | 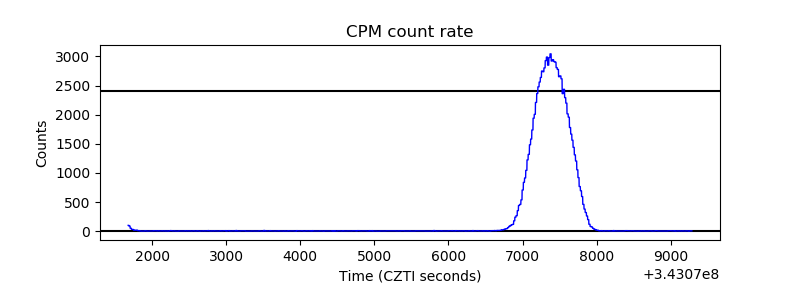 |
| CZT Counter |  |
| +2.5 Volts monitor |  |
| +5 Volts monitor | 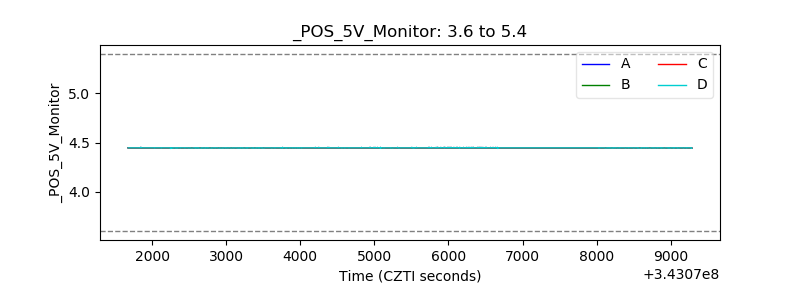 |
| _ROLL_ROT | 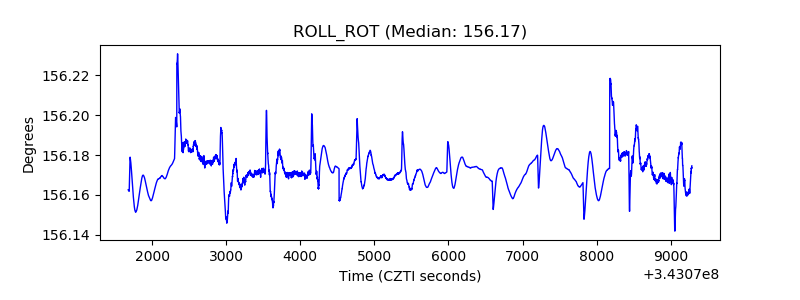 |
| _Roll_DEC | 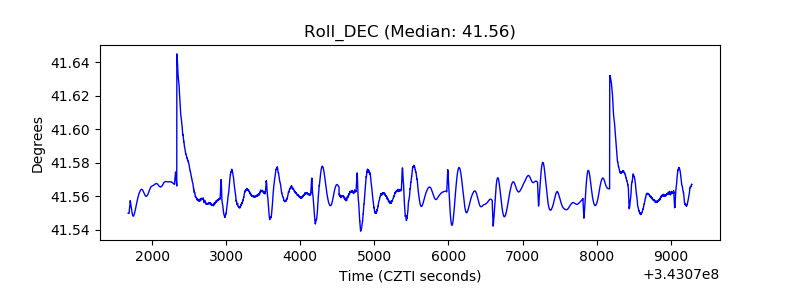 |
| _Roll_RA |  |
| Veto Counter | 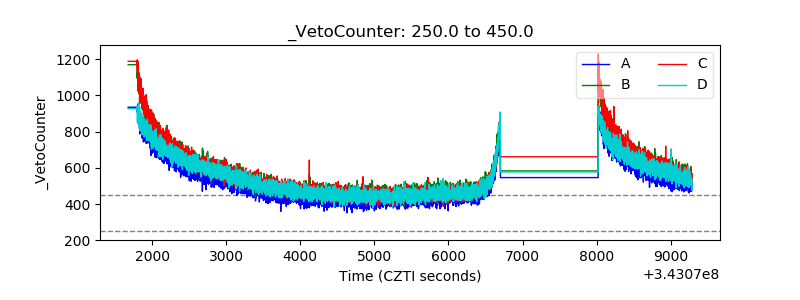 |