| Param | Original file | Final file |
|---|---|---|
| Filename | modeM0/AS1A10_002T05_9000004000_27749cztM0_level2.evt | modeM0/AS1A10_002T05_9000004000_27749cztM0_level2_quad_clean.evt |
| Size (bytes) | 465,117,120 | 100,296,000 |
| Size | 443.6 MB | 95.6 MB |
| Events in quadrant A | 3,249,224 | 664,547 |
| Events in quadrant B | 3,690,659 | 661,253 |
| Events in quadrant C | 3,377,175 | 647,507 |
| Events in quadrant D | 3,346,935 | 630,199 |
| Mode M9 | |||
|---|---|---|---|
| Quadrant | BADHDUFLAG | Total packets | Discarded packets |
| A | 0 | 22 | 0 |
| B | 0 | 23 | 0 |
| C | 0 | 23 | 0 |
| D | 0 | 23 | 0 |
| Mode M0 | |||
|---|---|---|---|
| Quadrant | BADHDUFLAG | Total packets | Discarded packets |
| A | 0 | 13491 | 0 |
| B | 0 | 14890 | 0 |
| C | 0 | 13833 | 0 |
| D | 0 | 13956 | 0 |
| Quadrant | Total seconds | Saturated seconds | Saturation percentage |
|---|---|---|---|
| A | 6220 | 62 | 0.996785% |
| B | 6220 | 141 | 2.266881% |
| C | 6219 | 108 | 1.736614% |
| D | 6219 | 57 | 0.916546% |
Noise dominated data is calculated using 1-second bins in cleaned event files. If a bin has >2000 counts, and if more than 50% of those come from <1% of pixels, then it is considered to be noise-dominated and hence unusable.
| Quadrant | # 1 sec bins | Bins with >0 counts | Bins with >2000 counts | High rate bins dominated by noise | Noise dominated (total time) | Noise dominated (detector-on time) | Marked lightcurve |
|---|---|---|---|---|---|---|---|
| A | 7535 | 6220 | 3 | 3 | 0.04% | 0.05% | 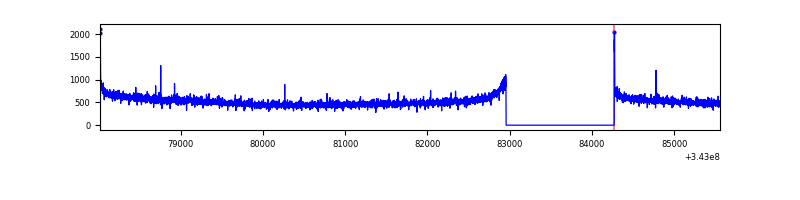 |
| B | 7535 | 6220 | 83 | 83 | 1.10% | 1.33% | 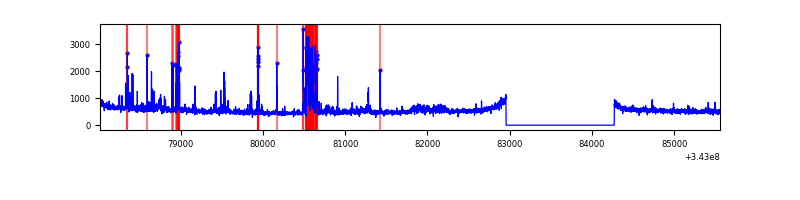 |
| C | 7534 | 6219 | 0 | 0 | 0.00% | 0.00% | 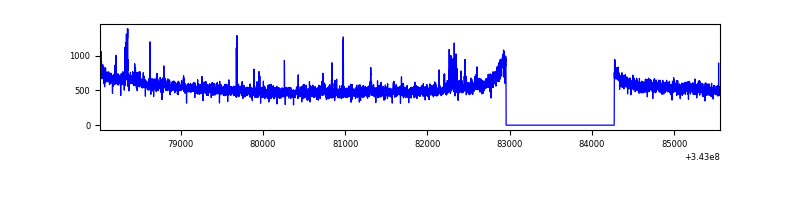 |
| D | 7534 | 6220 | 24 | 24 | 0.32% | 0.39% | 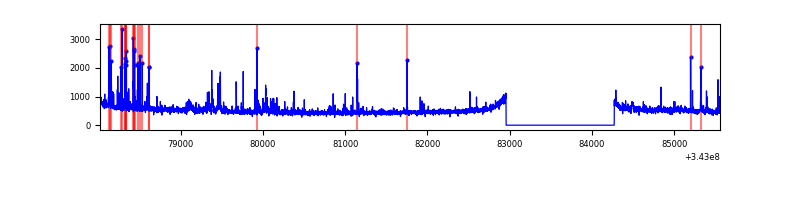 |
Top three noisy pixels from each quadrant. If the there are fewer than three noisy pixels in the level2.evt file, extra rows are filled as -1
| Pixel properties | Quadrant properties | ||||||
|---|---|---|---|---|---|---|---|
| Quadrant | DetID | PixID | Counts | Sigma | Mean | Median | Sigma |
| A | 0 | 13 | 45079 | 272.45 | 825 | 810 | 162.5 |
| A | 8 | 192 | 14804 | 86.13 | 825 | 810 | 162.5 |
| A | 13 | 254 | 11211 | 64.01 | 825 | 810 | 162.5 |
| B | 10 | 245 | 405568 | 2682.81 | 814 | 796 | 150.9 |
| B | 4 | 200 | 71723 | 470.1 | 814 | 796 | 150.9 |
| B | 0 | 190 | 20790 | 132.52 | 814 | 796 | 150.9 |
| C | 14 | 238 | 129161 | 690.82 | 800 | 806 | 185.8 |
| C | 3 | 233 | 97483 | 520.32 | 800 | 806 | 185.8 |
| C | 15 | 208 | 33483 | 175.87 | 800 | 806 | 185.8 |
| D | 1 | 52 | 241892 | 1287.45 | 803 | 784 | 187.3 |
| D | 2 | 250 | 45681 | 239.74 | 803 | 784 | 187.3 |
| D | 2 | 234 | 26425 | 136.92 | 803 | 784 | 187.3 |
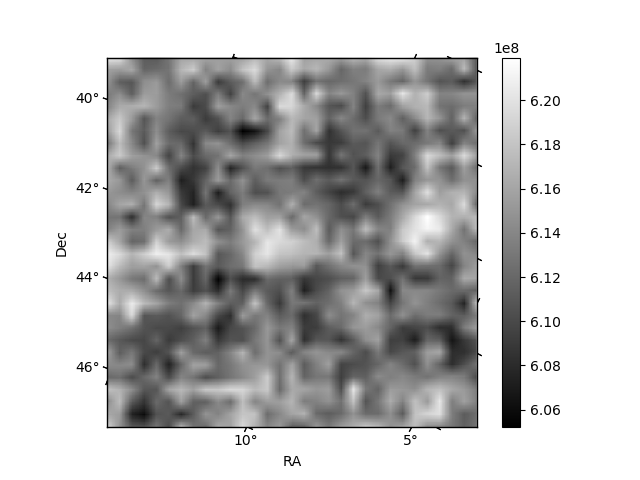
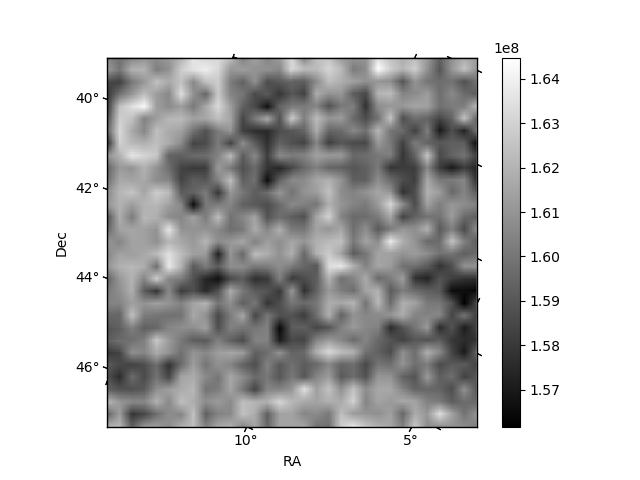
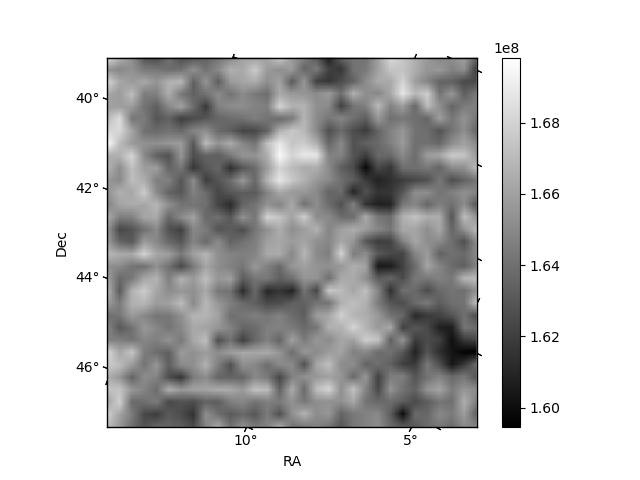
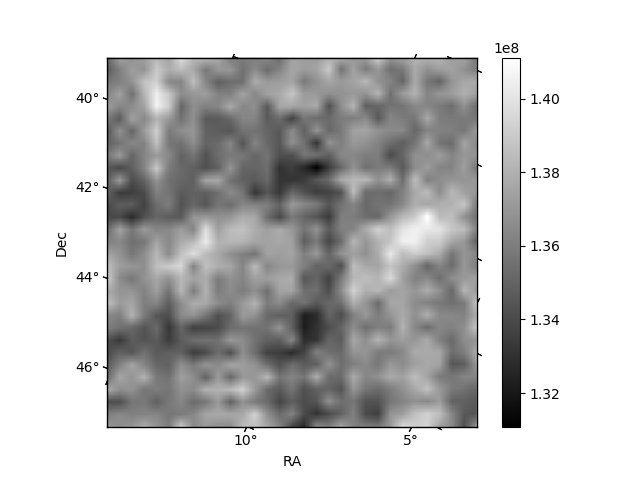
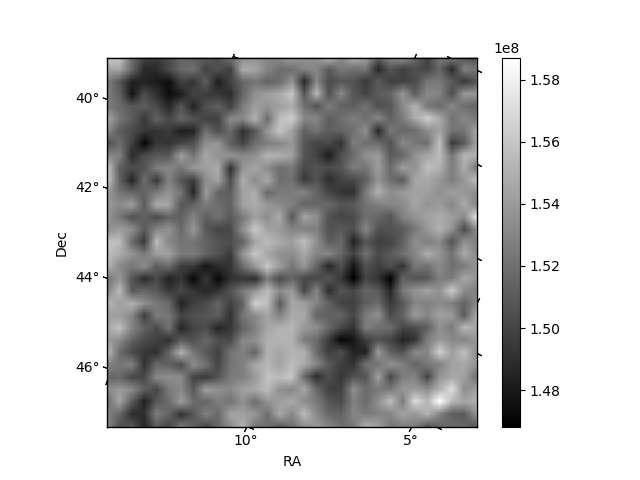
Histogram calculated using DETX and DETY for each event in the final _common_clean file
| Quadrant A | 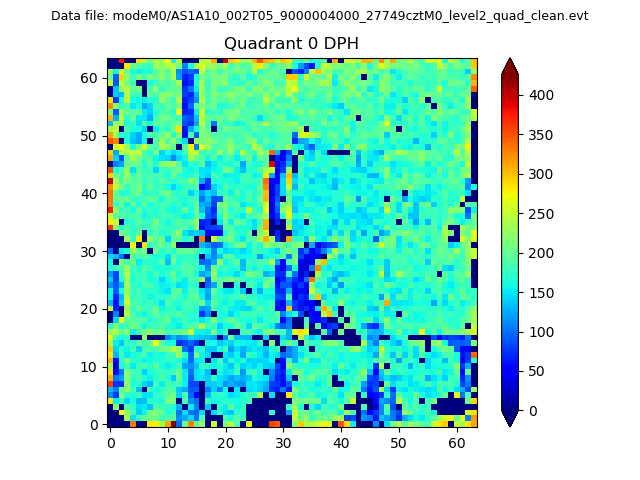 |
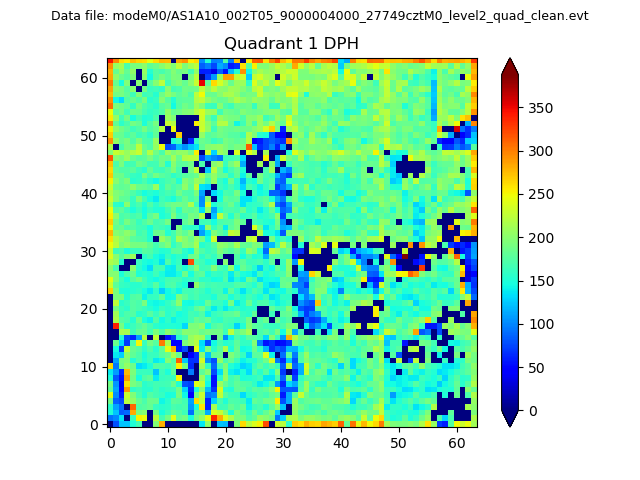 |
Quadrant B |
|---|---|---|---|
| Quadrant D | 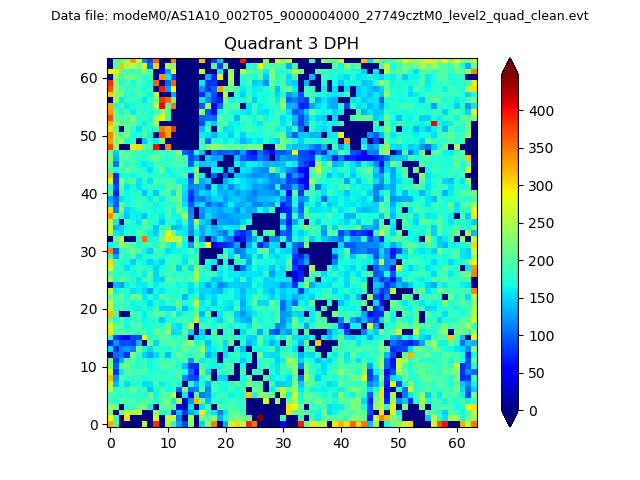 |
 |
Quadrant C |
| Plot type | Count rate plots | Images |
|---|---|---|
| Comparison with Poisson distribution Blue bars denote a histogram of data divided into 1 sec bins. Red curve is a Poisson curve with rate = median count rate of data. |
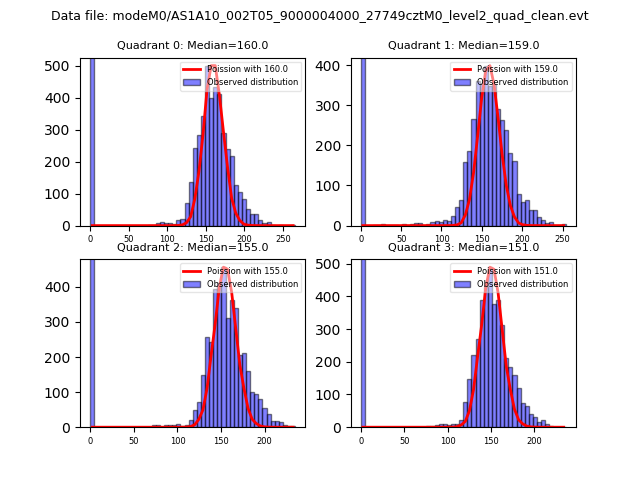 |
 |
| Quadrant-wise count rates Data is divided into 100 sec bins |
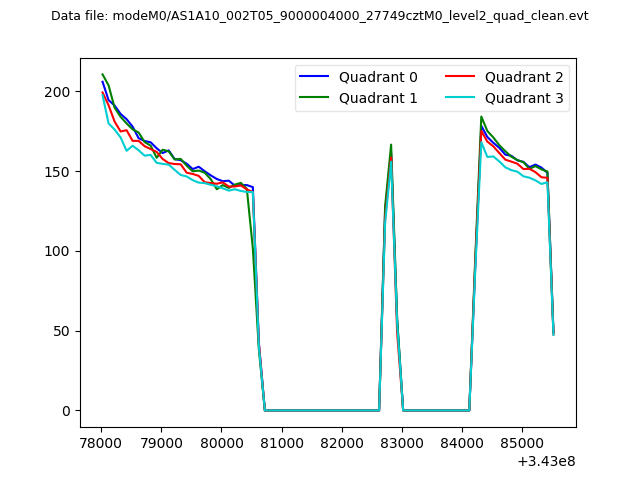 |
|
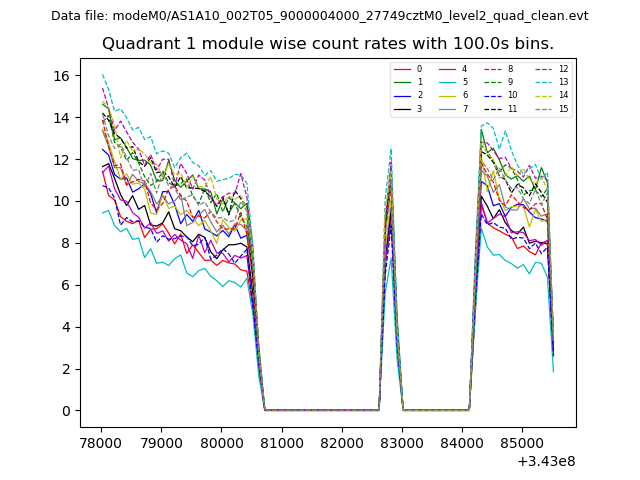
| Module-wise count rates for Quadrant A Data is divided into 100 sec bins |
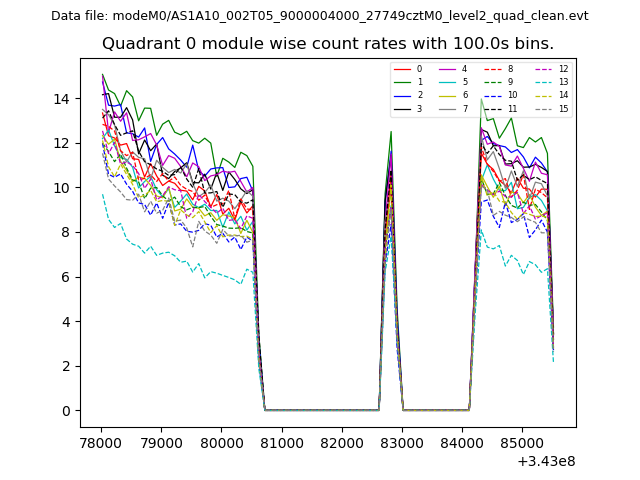 |
 |
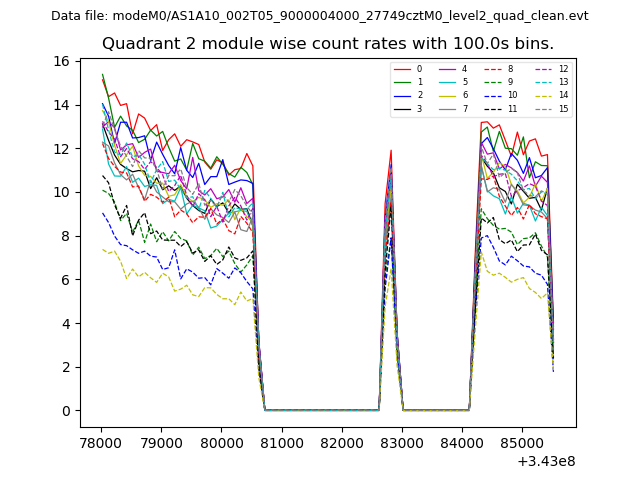
| Module-wise count rates for Quadrant B Data is divided into 100 sec bins |
 |
 |
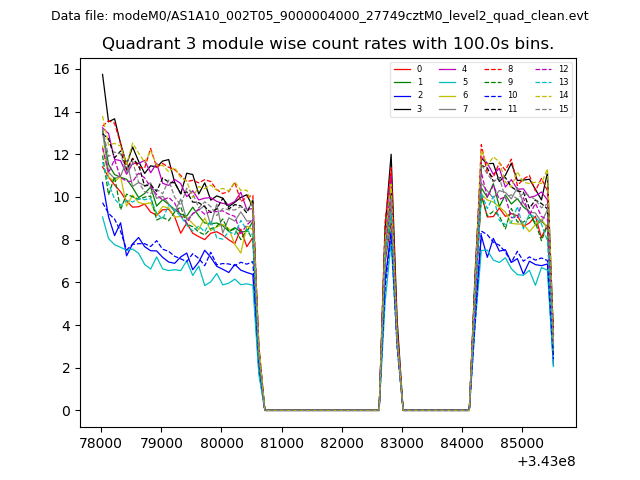
| Module-wise count rates for Quadrant C Data is divided into 100 sec bins |
 |
 |
| Module-wise count rates for Quadrant D Data is divided into 100 sec bins |
 |
 |
| Parameter | Plot |
|---|---|
| CZT HV Monitor | 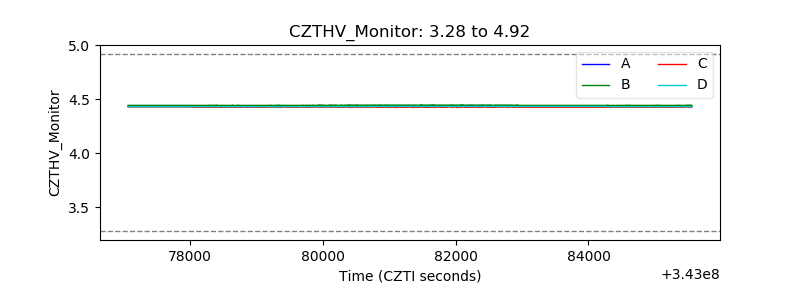 |
| D_VDD | 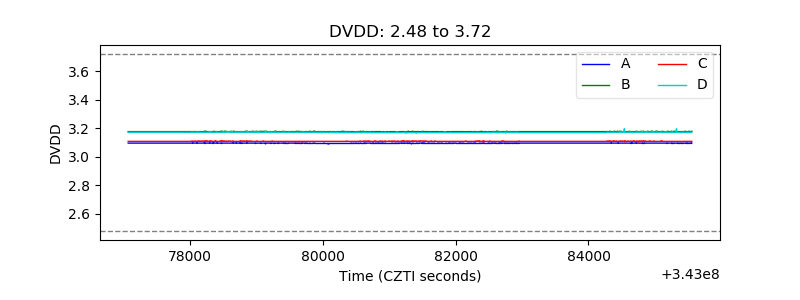 |
| Temperature 1 |  |
| Veto HV Monitor | 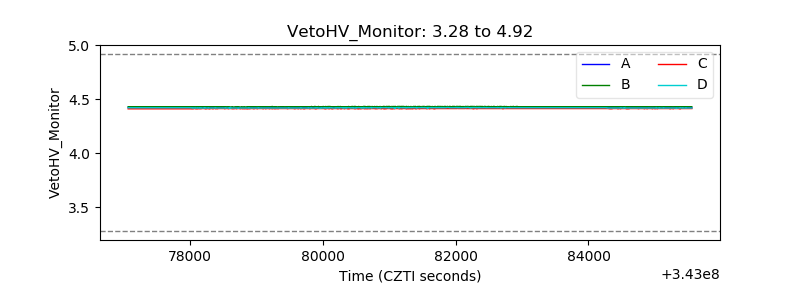 |
| Veto LLD | 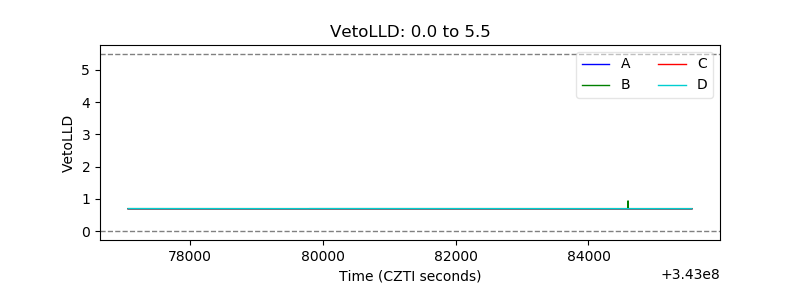 |
| Alpha Counter | 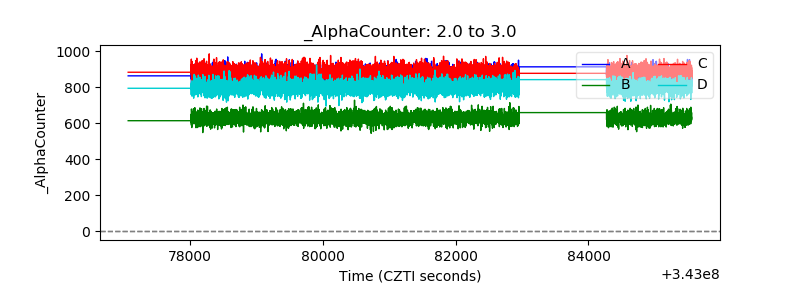 |
| _CPM_Rate | 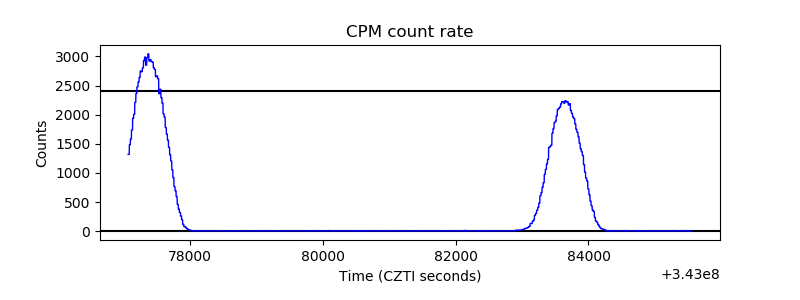 |
| CZT Counter |  |
| +2.5 Volts monitor |  |
| +5 Volts monitor | 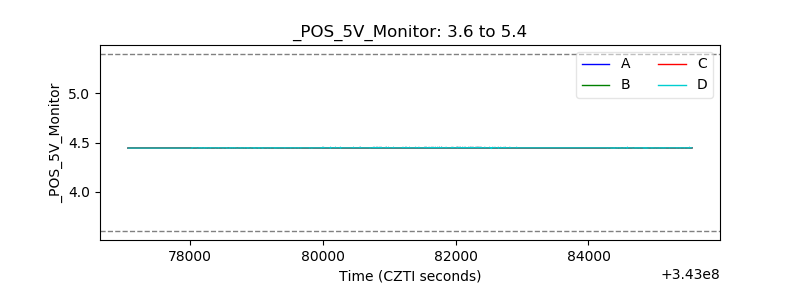 |
| _ROLL_ROT | 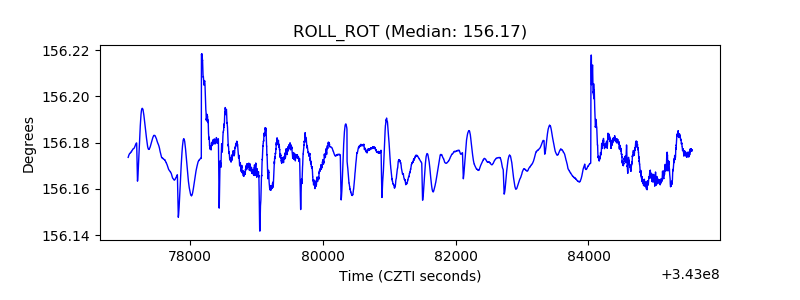 |
| _Roll_DEC | 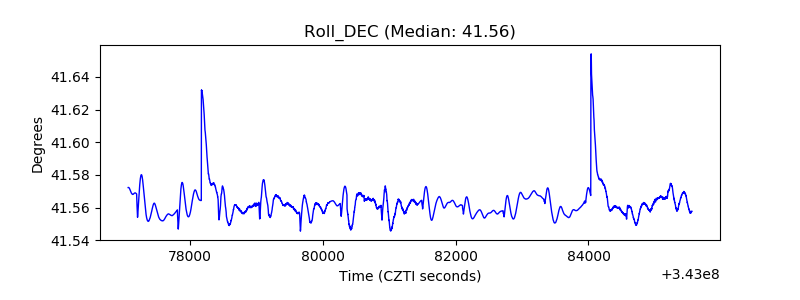 |
| _Roll_RA | 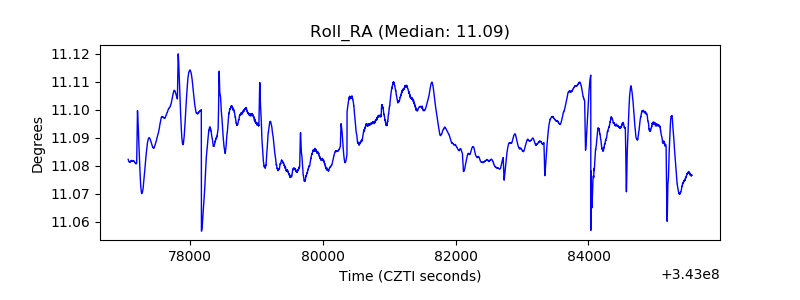 |
| Veto Counter | 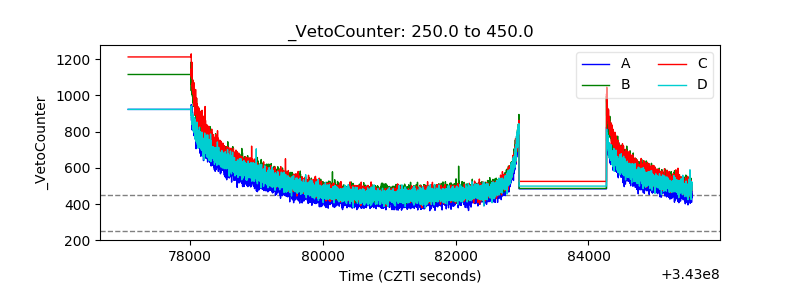 |