| Param | Original file | Final file |
|---|---|---|
| Filename | modeM0/AS1A10_002T05_9000004000_27750cztM0_level2.evt | modeM0/AS1A10_002T05_9000004000_27750cztM0_level2_quad_clean.evt |
| Size (bytes) | 432,950,400 | 95,509,440 |
| Size | 412.9 MB | 91.1 MB |
| Events in quadrant A | 3,116,360 | 623,683 |
| Events in quadrant B | 3,167,030 | 630,266 |
| Events in quadrant C | 3,260,795 | 608,586 |
| Events in quadrant D | 3,140,925 | 591,714 |
| Mode M9 | |||
|---|---|---|---|
| Quadrant | BADHDUFLAG | Total packets | Discarded packets |
| A | 0 | 18 | 0 |
| B | 0 | 19 | 0 |
| C | 0 | 19 | 0 |
| D | 0 | 19 | 0 |
| Mode M0 | |||
|---|---|---|---|
| Quadrant | BADHDUFLAG | Total packets | Discarded packets |
| A | 0 | 13210 | 0 |
| B | 0 | 13382 | 0 |
| C | 0 | 13488 | 0 |
| D | 0 | 13527 | 0 |
| Quadrant | Total seconds | Saturated seconds | Saturation percentage |
|---|---|---|---|
| A | 6277 | 34 | 0.541660% |
| B | 6277 | 53 | 0.844352% |
| C | 6277 | 103 | 1.640911% |
| D | 6277 | 26 | 0.414211% |
Noise dominated data is calculated using 1-second bins in cleaned event files. If a bin has >2000 counts, and if more than 50% of those come from <1% of pixels, then it is considered to be noise-dominated and hence unusable.
| Quadrant | # 1 sec bins | Bins with >0 counts | Bins with >2000 counts | High rate bins dominated by noise | Noise dominated (total time) | Noise dominated (detector-on time) | Marked lightcurve |
|---|---|---|---|---|---|---|---|
| A | 7467 | 6278 | 1 | 1 | 0.01% | 0.02% | 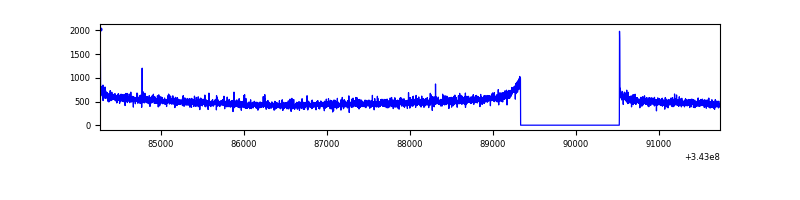 |
| B | 7467 | 6278 | 1 | 1 | 0.01% | 0.02% | 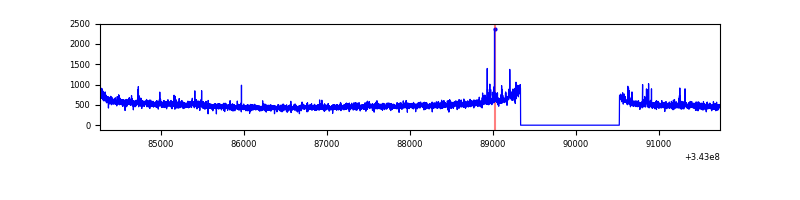 |
| C | 7467 | 6277 | 0 | 0 | 0.00% | 0.00% | 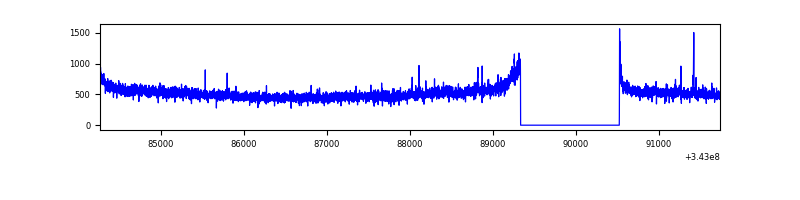 |
| D | 7467 | 6278 | 7 | 7 | 0.09% | 0.11% | 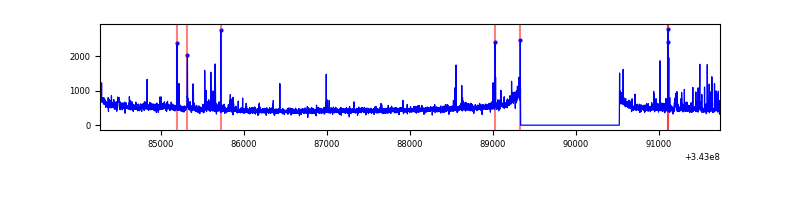 |
Top three noisy pixels from each quadrant. If the there are fewer than three noisy pixels in the level2.evt file, extra rows are filled as -1
| Pixel properties | Quadrant properties | ||||||
|---|---|---|---|---|---|---|---|
| Quadrant | DetID | PixID | Counts | Sigma | Mean | Median | Sigma |
| A | 0 | 13 | 24663 | 150.32 | 795 | 780 | 158.9 |
| A | 8 | 192 | 14824 | 88.39 | 795 | 780 | 158.9 |
| A | 13 | 254 | 11789 | 69.29 | 795 | 780 | 158.9 |
| B | 0 | 190 | 42959 | 283.99 | 792 | 772 | 148.5 |
| B | 4 | 200 | 22643 | 147.23 | 792 | 772 | 148.5 |
| B | 12 | 111 | 17915 | 115.4 | 792 | 772 | 148.5 |
| C | 14 | 238 | 125136 | 692.43 | 774 | 780 | 179.6 |
| C | 3 | 233 | 114903 | 635.45 | 774 | 780 | 179.6 |
| C | 13 | 61 | 5162 | 24.4 | 774 | 780 | 179.6 |
| D | 1 | 52 | 131041 | 713.42 | 774 | 754 | 182.6 |
| D | 2 | 250 | 64013 | 346.39 | 774 | 754 | 182.6 |
| D | 2 | 234 | 27632 | 147.18 | 774 | 754 | 182.6 |
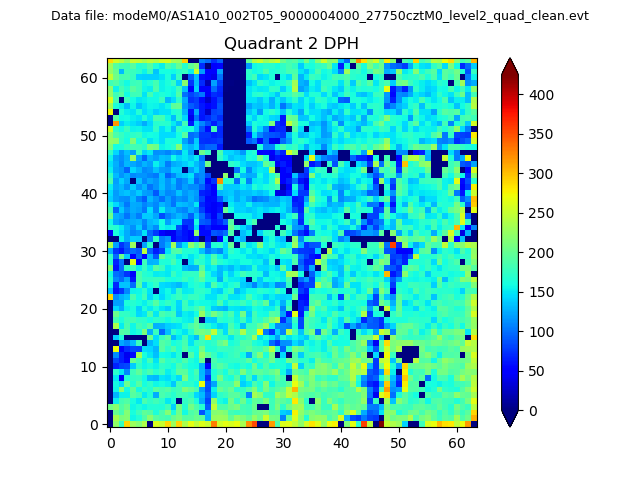
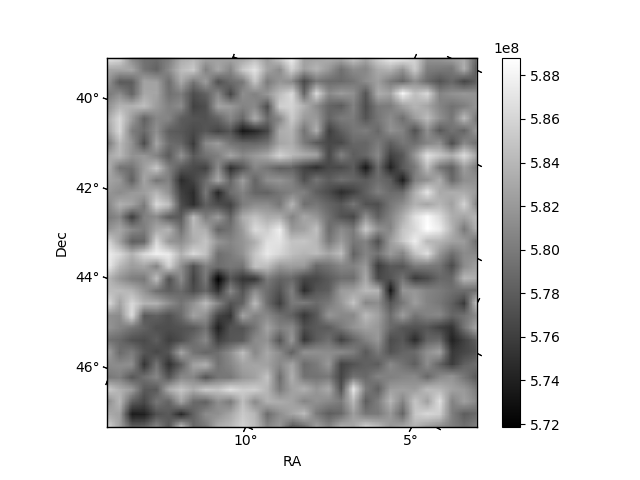
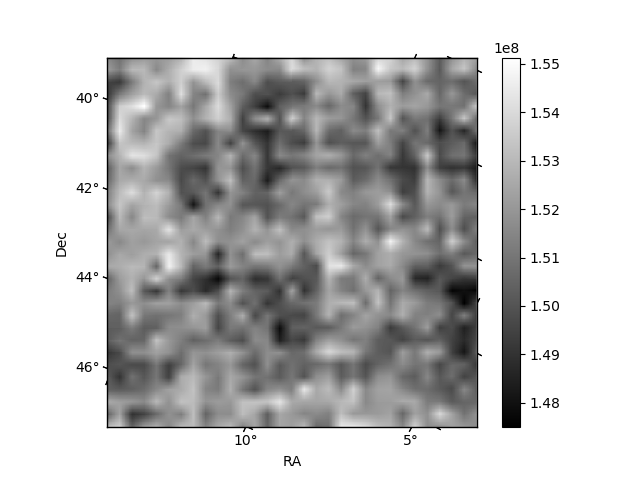
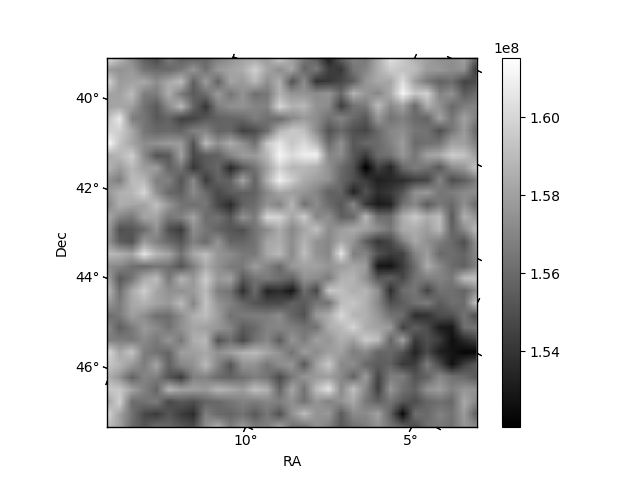
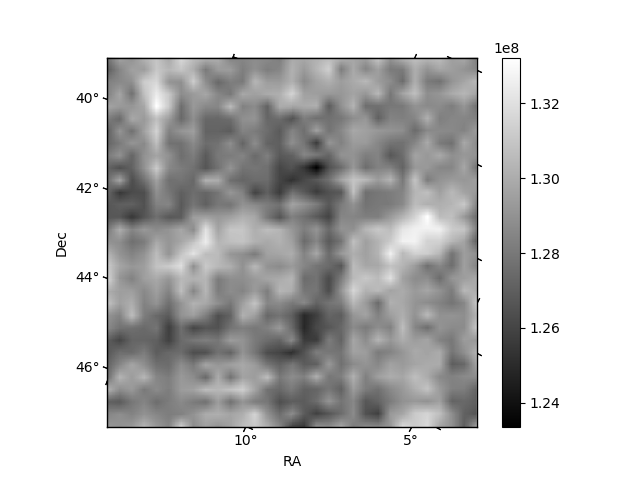
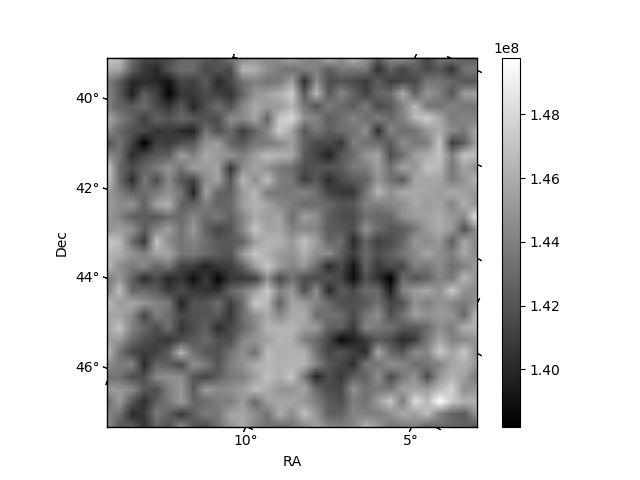
Histogram calculated using DETX and DETY for each event in the final _common_clean file
| Quadrant A | 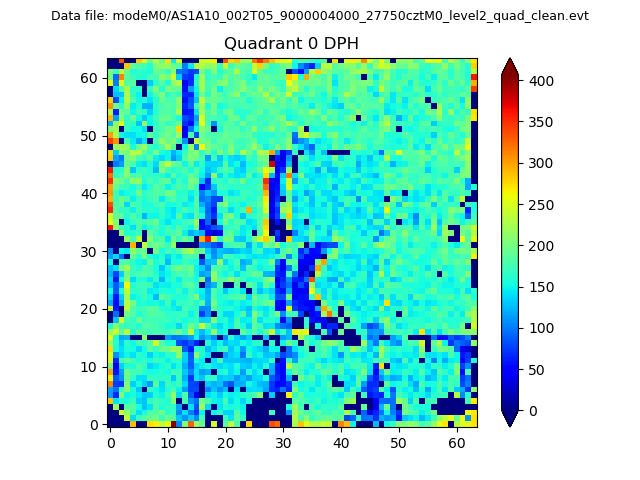 |
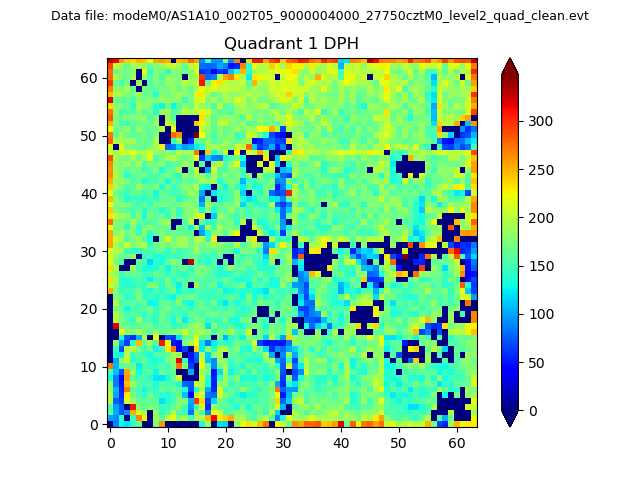 |
Quadrant B |
|---|---|---|---|
| Quadrant D | 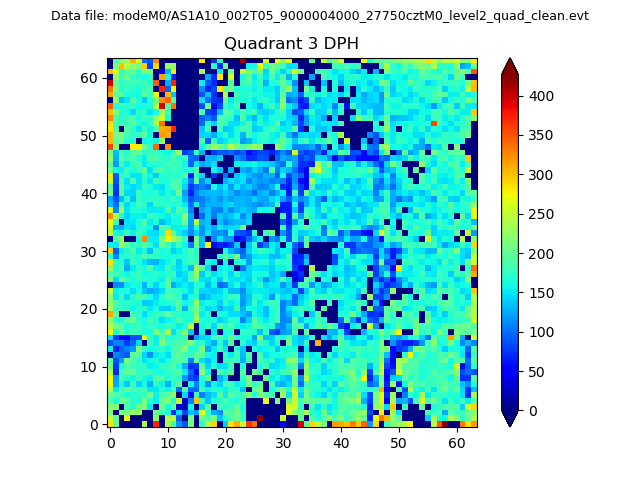 |
 |
Quadrant C |
| Plot type | Count rate plots | Images |
|---|---|---|
| Comparison with Poisson distribution Blue bars denote a histogram of data divided into 1 sec bins. Red curve is a Poisson curve with rate = median count rate of data. |
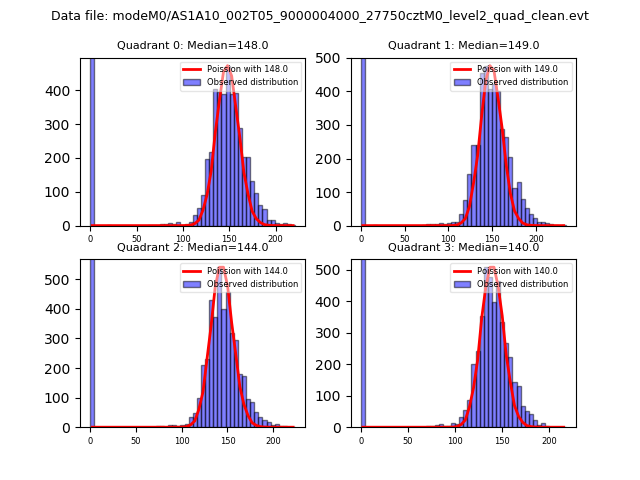 |
 |
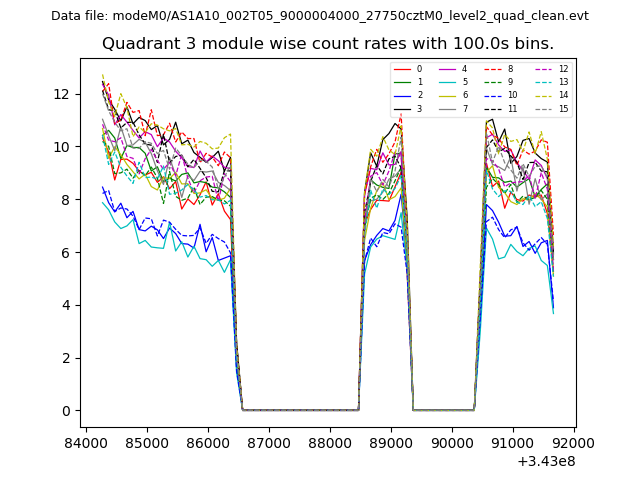
| Quadrant-wise count rates Data is divided into 100 sec bins |
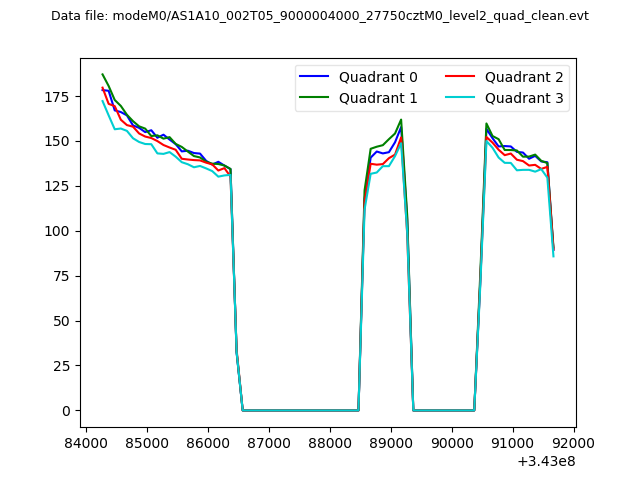 |
|
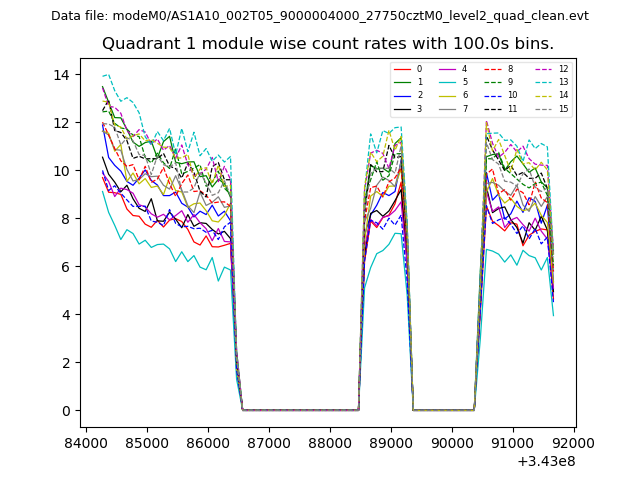
| Module-wise count rates for Quadrant A Data is divided into 100 sec bins |
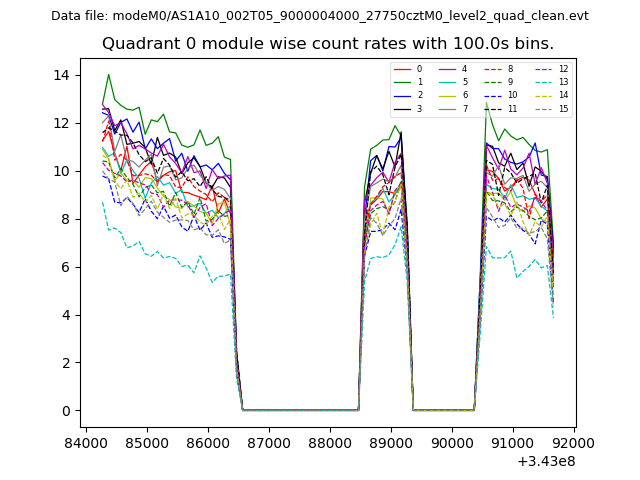 |
 |
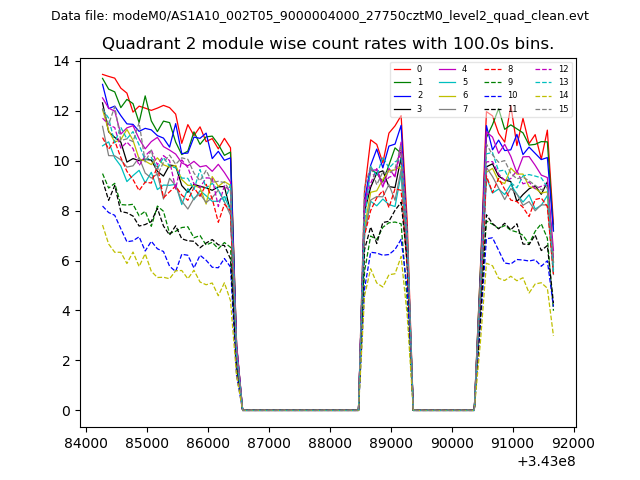
| Module-wise count rates for Quadrant B Data is divided into 100 sec bins |
 |
 |
| Module-wise count rates for Quadrant C Data is divided into 100 sec bins |
 |
 |
| Module-wise count rates for Quadrant D Data is divided into 100 sec bins |
 |
 |
| Parameter | Plot |
|---|---|
| CZT HV Monitor |  |
| D_VDD | 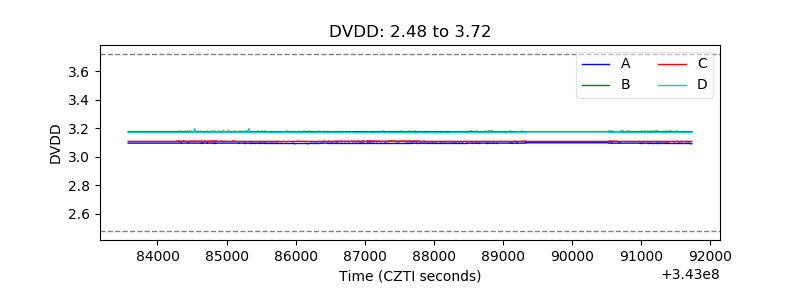 |
| Temperature 1 | 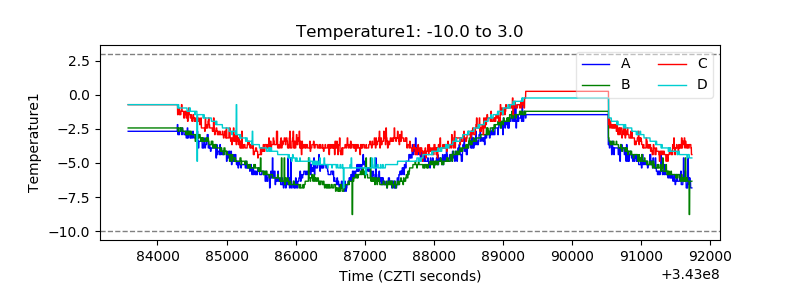 |
| Veto HV Monitor | 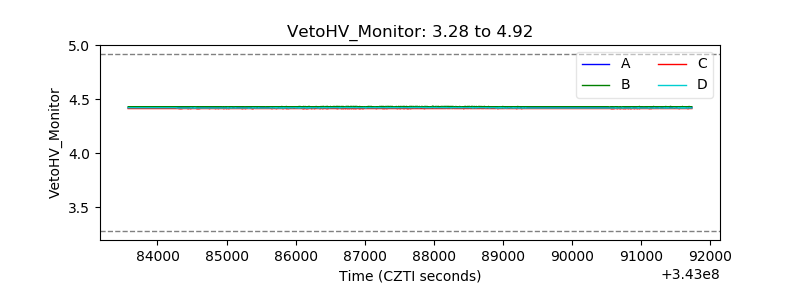 |
| Veto LLD | 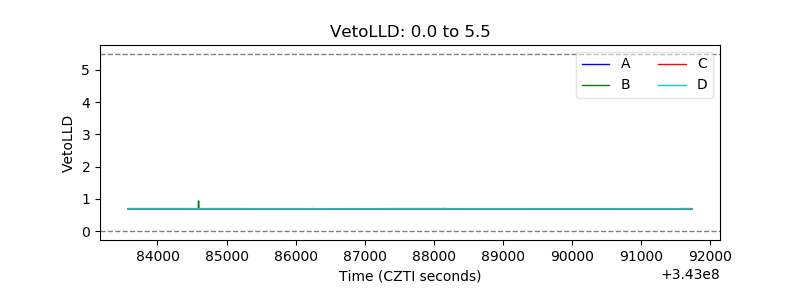 |
| Alpha Counter | 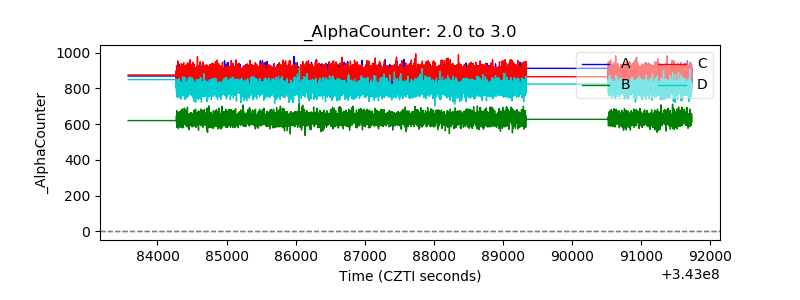 |
| _CPM_Rate | 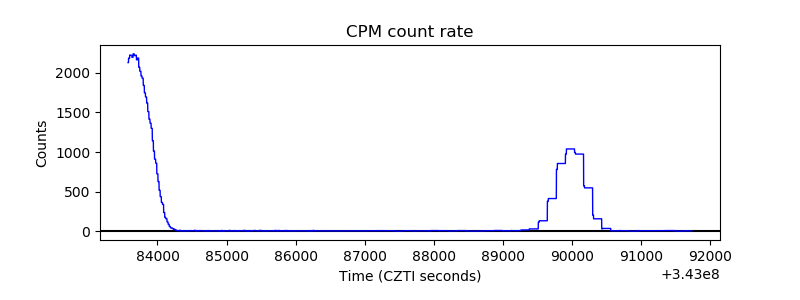 |
| CZT Counter | 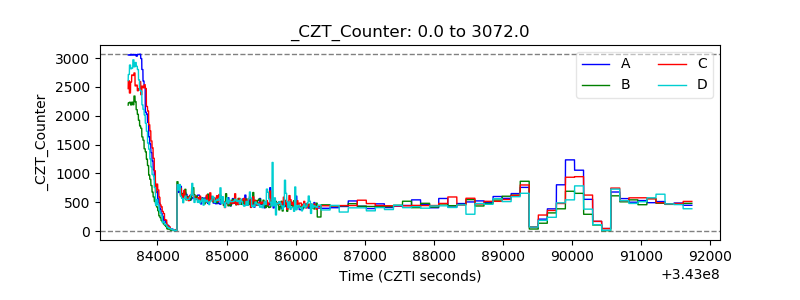 |
| +2.5 Volts monitor |  |
| +5 Volts monitor |  |
| _ROLL_ROT | 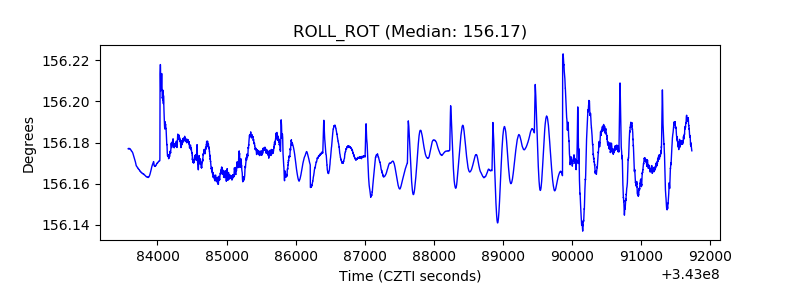 |
| _Roll_DEC | 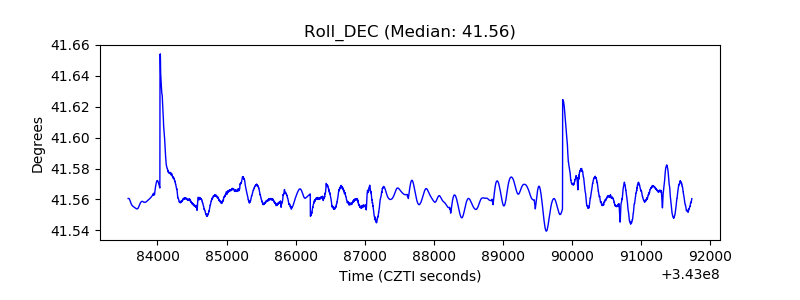 |
| _Roll_RA | 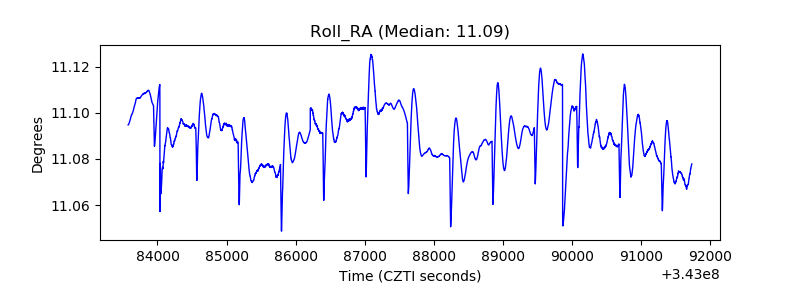 |
| Veto Counter | 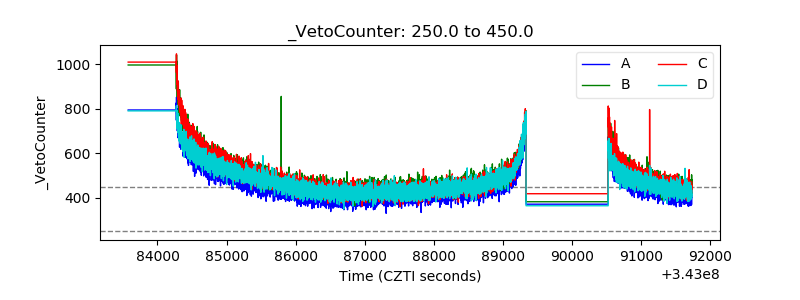 |