| Param | Original file | Final file |
|---|---|---|
| Filename | modeM0/AS1A10_002T05_9000004000_27751cztM0_level2.evt | modeM0/AS1A10_002T05_9000004000_27751cztM0_level2_quad_clean.evt |
| Size (bytes) | 470,387,520 | 98,213,760 |
| Size | 448.6 MB | 93.7 MB |
| Events in quadrant A | 3,170,707 | 637,160 |
| Events in quadrant B | 3,249,554 | 642,060 |
| Events in quadrant C | 3,670,774 | 619,384 |
| Events in quadrant D | 3,700,140 | 609,302 |
| Mode M9 | |||
|---|---|---|---|
| Quadrant | BADHDUFLAG | Total packets | Discarded packets |
| A | 0 | 18 | 0 |
| B | 0 | 19 | 0 |
| C | 0 | 19 | 0 |
| D | 0 | 19 | 0 |
| Mode M0 | |||
|---|---|---|---|
| Quadrant | BADHDUFLAG | Total packets | Discarded packets |
| A | 0 | 13781 | 0 |
| B | 0 | 13990 | 0 |
| C | 0 | 15063 | 0 |
| D | 0 | 15551 | 0 |
| Quadrant | Total seconds | Saturated seconds | Saturation percentage |
|---|---|---|---|
| A | 6691 | 28 | 0.418473% |
| B | 6691 | 36 | 0.538036% |
| C | 6691 | 79 | 1.180690% |
| D | 6691 | 26 | 0.388582% |
Noise dominated data is calculated using 1-second bins in cleaned event files. If a bin has >2000 counts, and if more than 50% of those come from <1% of pixels, then it is considered to be noise-dominated and hence unusable.
| Quadrant | # 1 sec bins | Bins with >0 counts | Bins with >2000 counts | High rate bins dominated by noise | Noise dominated (total time) | Noise dominated (detector-on time) | Marked lightcurve |
|---|---|---|---|---|---|---|---|
| A | 7576 | 6692 | 2 | 2 | 0.03% | 0.03% | 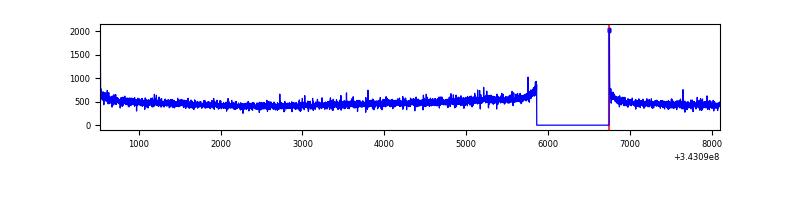 |
| B | 7576 | 6692 | 0 | 0 | 0.00% | 0.00% | 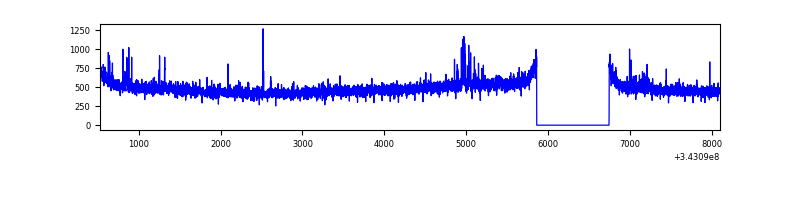 |
| C | 7576 | 6691 | 3 | 3 | 0.04% | 0.04% | 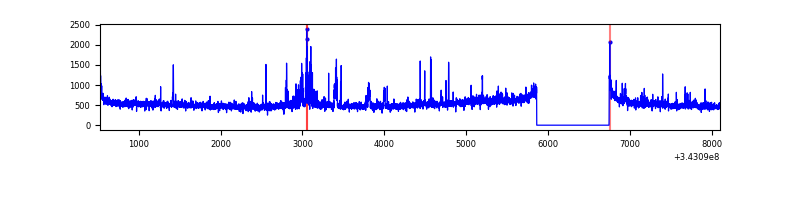 |
| D | 7576 | 6692 | 35 | 35 | 0.46% | 0.52% | 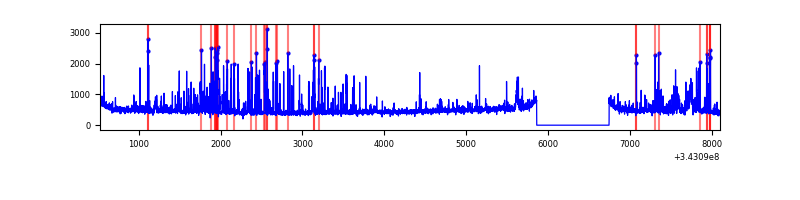 |
Top three noisy pixels from each quadrant. If the there are fewer than three noisy pixels in the level2.evt file, extra rows are filled as -1
| Pixel properties | Quadrant properties | ||||||
|---|---|---|---|---|---|---|---|
| Quadrant | DetID | PixID | Counts | Sigma | Mean | Median | Sigma |
| A | 0 | 13 | 16010 | 93.88 | 812 | 796 | 162.1 |
| A | 8 | 192 | 15434 | 90.32 | 812 | 796 | 162.1 |
| A | 13 | 254 | 11986 | 69.05 | 812 | 796 | 162.1 |
| B | 0 | 190 | 40957 | 262.22 | 810 | 789 | 153.2 |
| B | 12 | 111 | 18841 | 117.84 | 810 | 789 | 153.2 |
| B | 4 | 52 | 16872 | 104.99 | 810 | 789 | 153.2 |
| C | 3 | 233 | 471280 | 2544.78 | 789 | 794 | 184.9 |
| C | 14 | 238 | 125221 | 673.01 | 789 | 794 | 184.9 |
| C | 13 | 61 | 5273 | 24.23 | 789 | 794 | 184.9 |
| D | 1 | 52 | 607521 | 3203.49 | 789 | 768 | 189.4 |
| D | 2 | 250 | 69822 | 364.59 | 789 | 768 | 189.4 |
| D | 2 | 234 | 27076 | 138.9 | 789 | 768 | 189.4 |
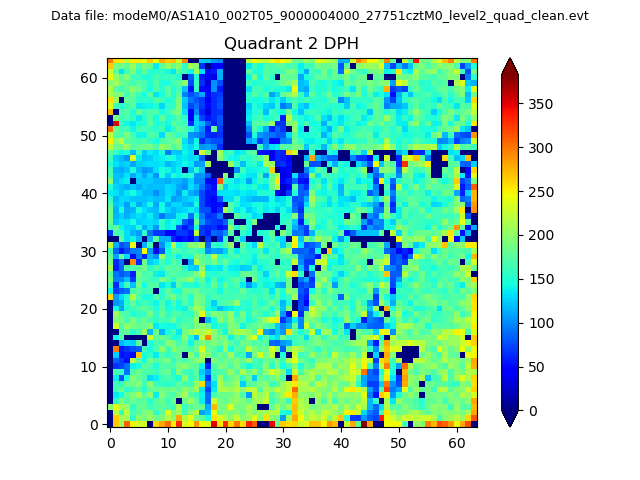
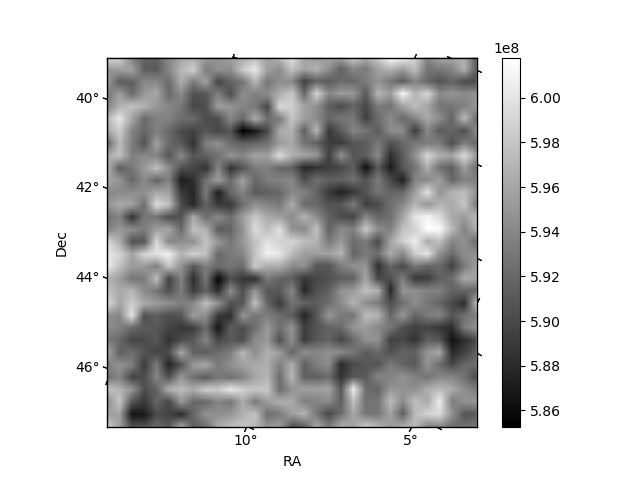
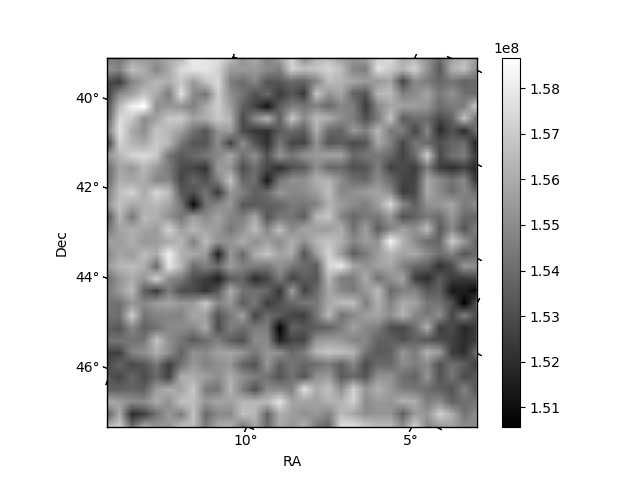
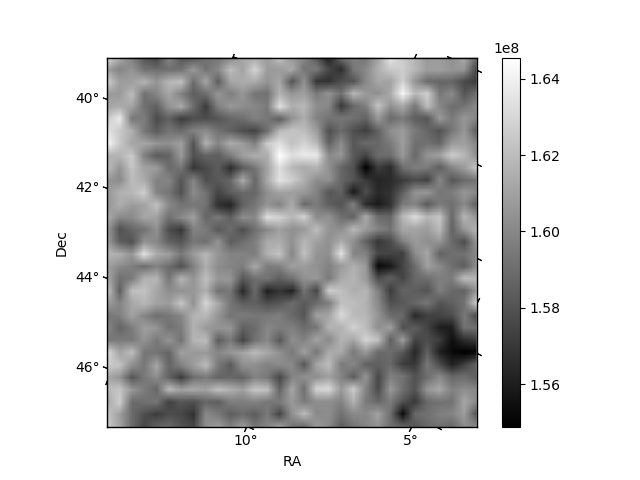
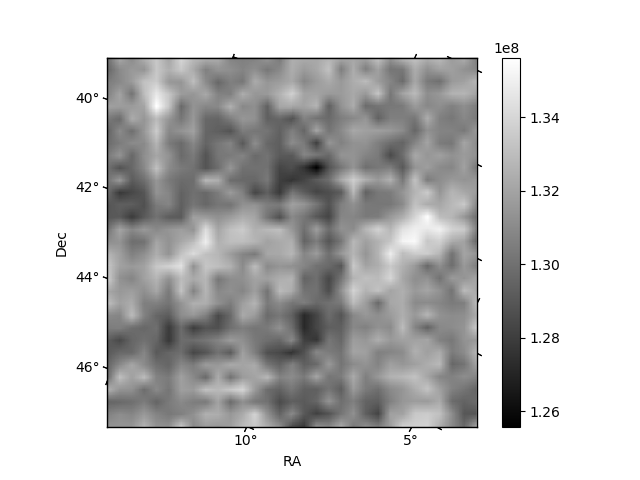
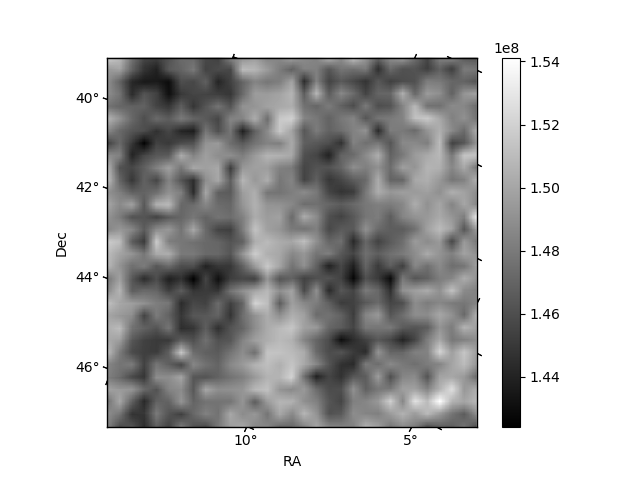
Histogram calculated using DETX and DETY for each event in the final _common_clean file
| Quadrant A | 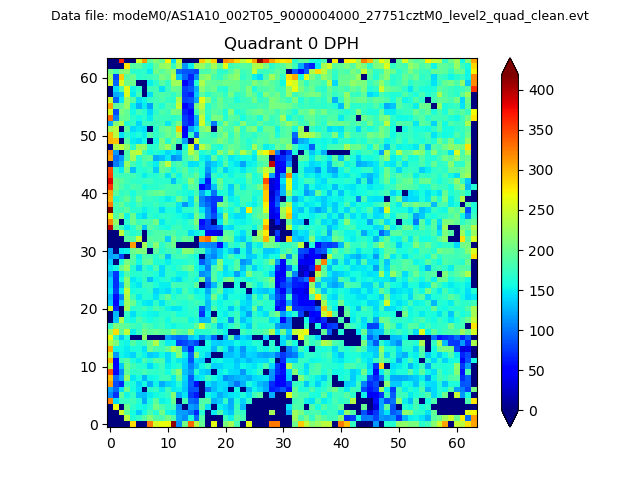 |
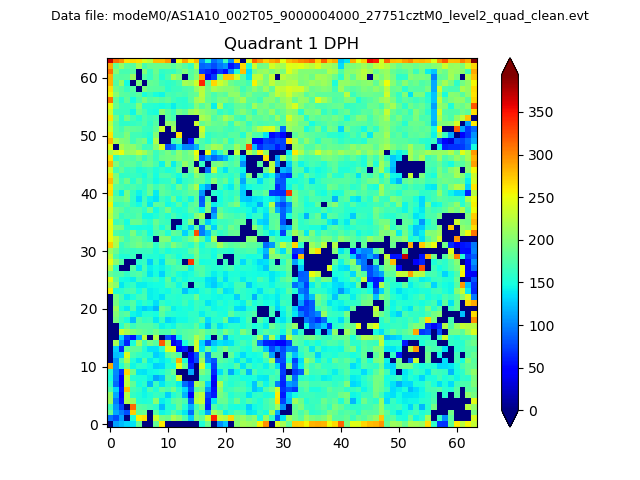 |
Quadrant B |
|---|---|---|---|
| Quadrant D | 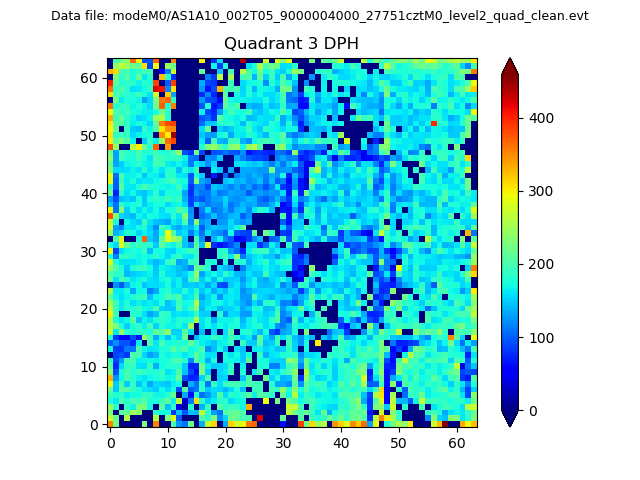 |
 |
Quadrant C |
| Plot type | Count rate plots | Images |
|---|---|---|
| Comparison with Poisson distribution Blue bars denote a histogram of data divided into 1 sec bins. Red curve is a Poisson curve with rate = median count rate of data. |
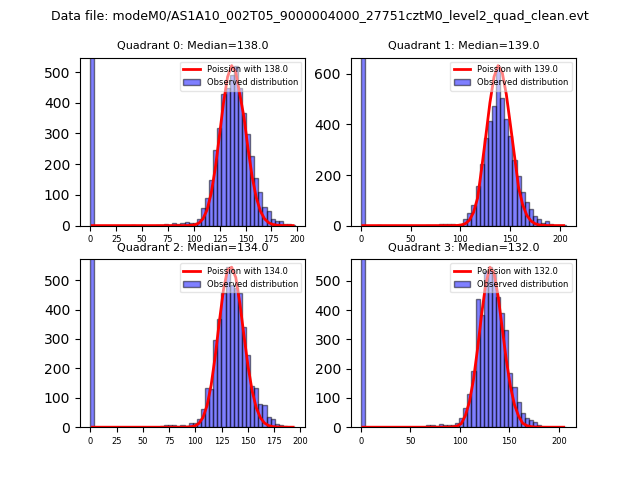 |
 |
| Quadrant-wise count rates Data is divided into 100 sec bins |
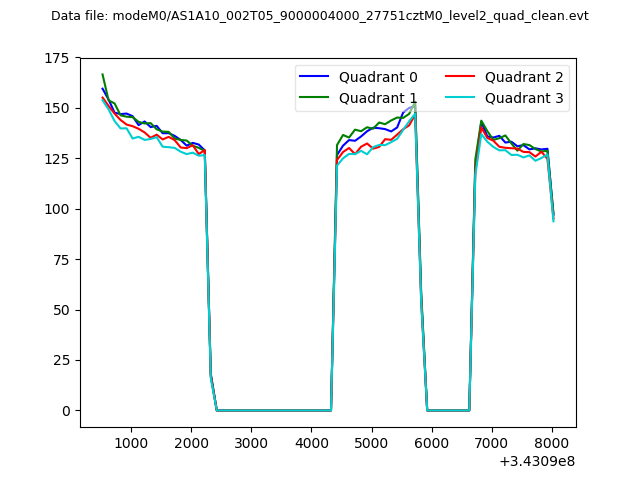 |
|
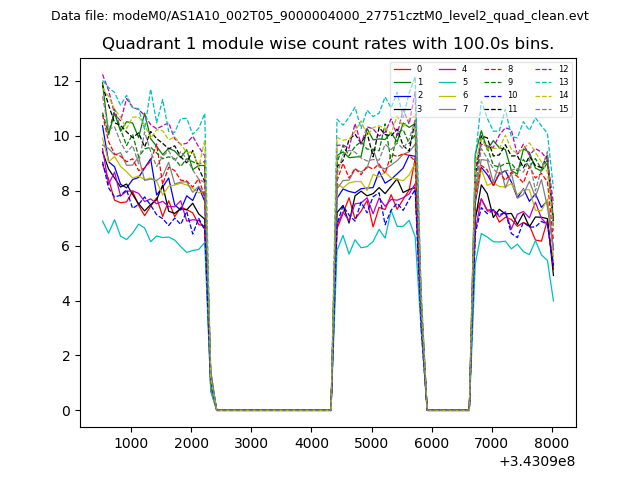
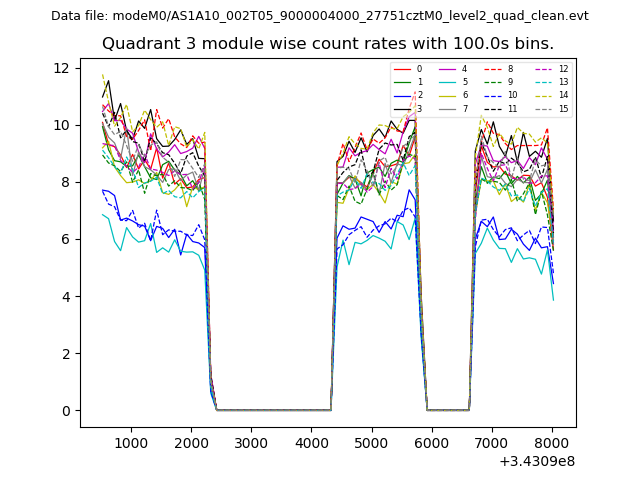
| Module-wise count rates for Quadrant A Data is divided into 100 sec bins |
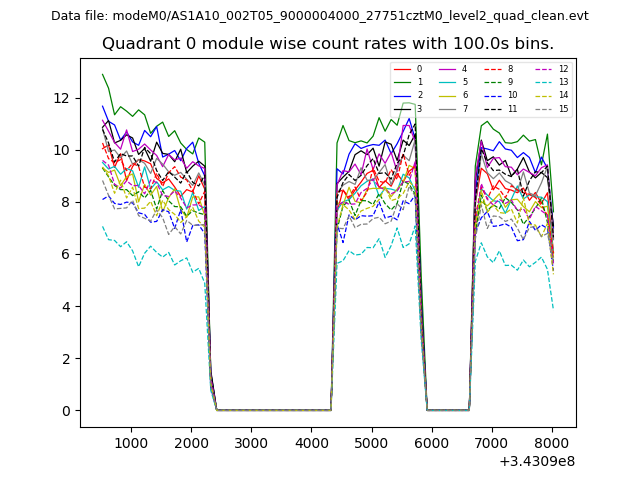 |
 |
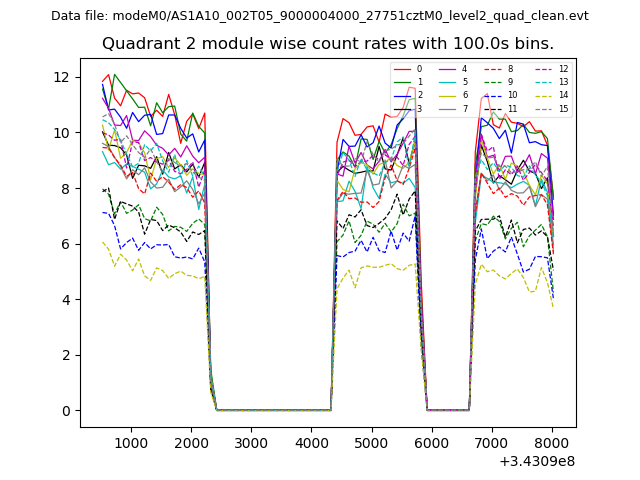
| Module-wise count rates for Quadrant B Data is divided into 100 sec bins |
 |
 |
| Module-wise count rates for Quadrant C Data is divided into 100 sec bins |
 |
 |
| Module-wise count rates for Quadrant D Data is divided into 100 sec bins |
 |
 |
| Parameter | Plot |
|---|---|
| CZT HV Monitor | 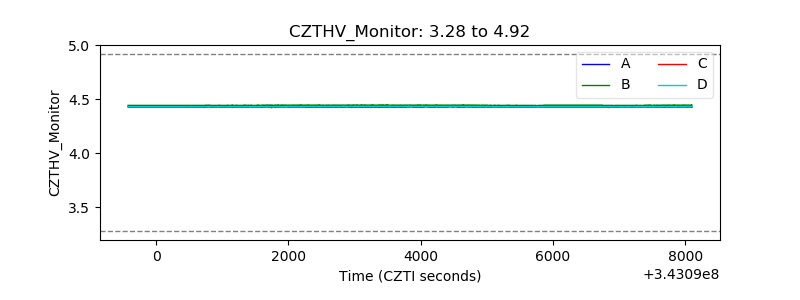 |
| D_VDD | 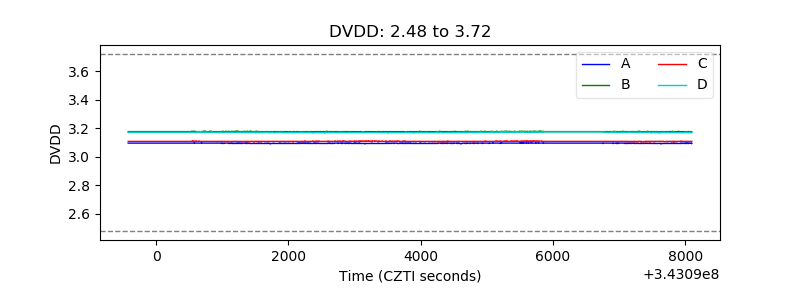 |
| Temperature 1 | 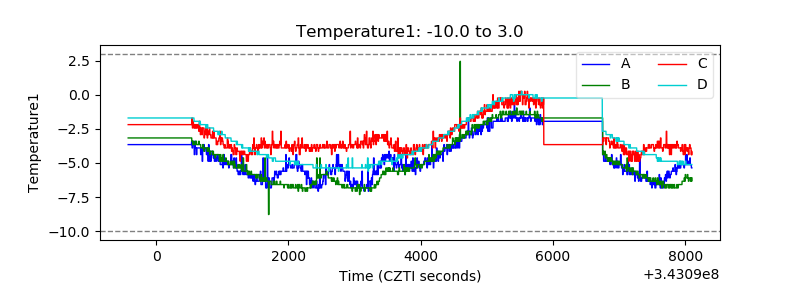 |
| Veto HV Monitor |  |
| Veto LLD | 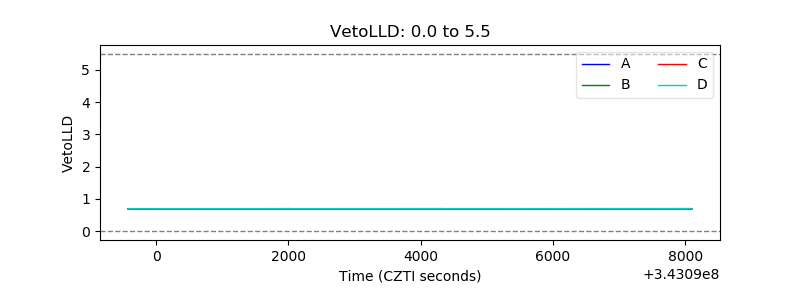 |
| Alpha Counter | 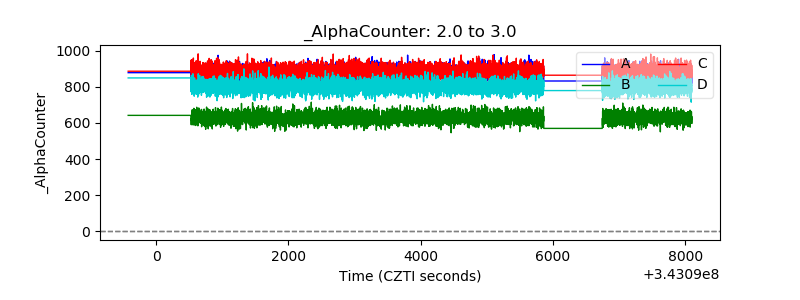 |
| _CPM_Rate | 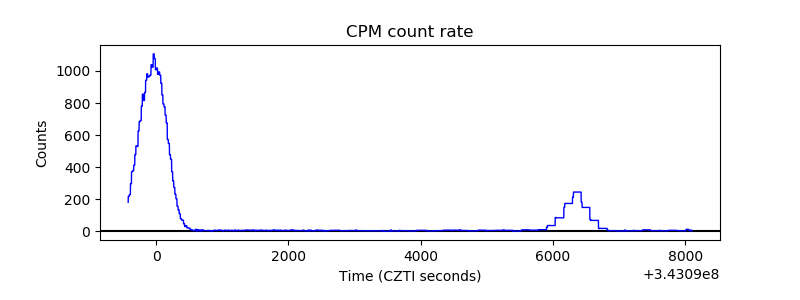 |
| CZT Counter | 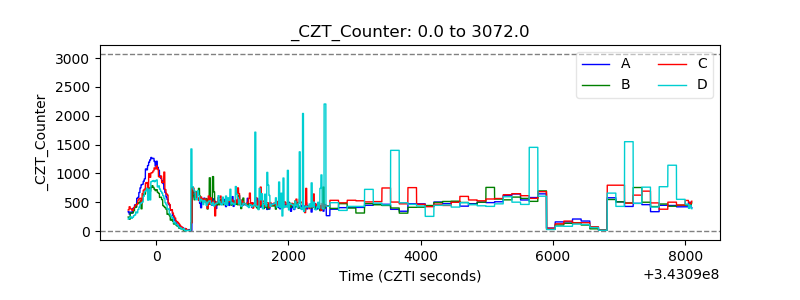 |
| +2.5 Volts monitor | 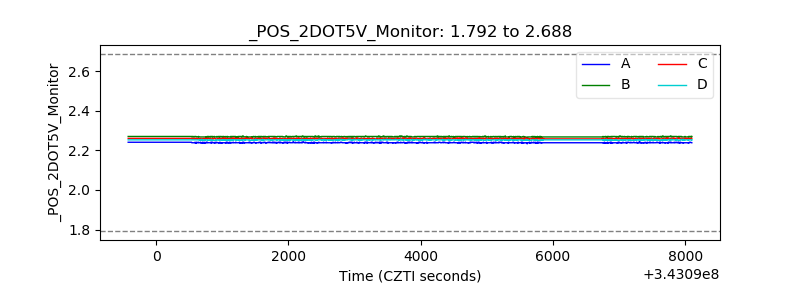 |
| +5 Volts monitor |  |
| _ROLL_ROT | 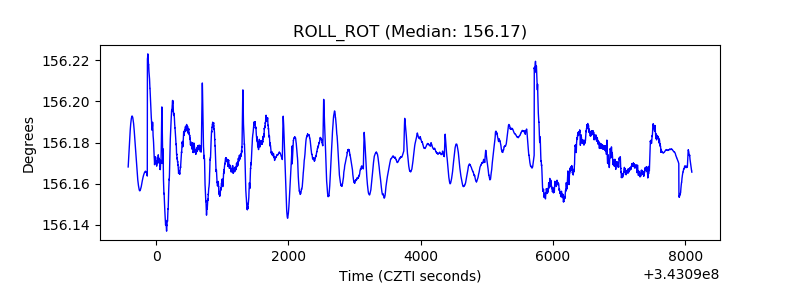 |
| _Roll_DEC | 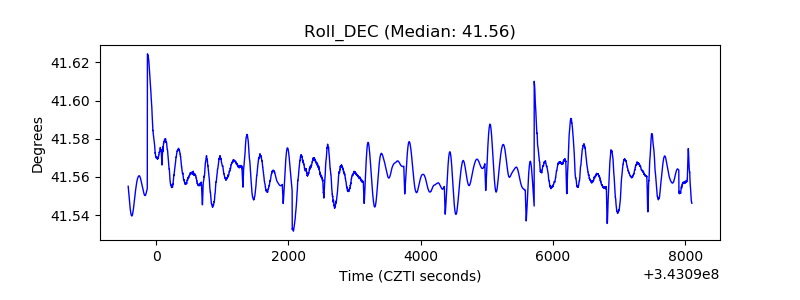 |
| _Roll_RA | 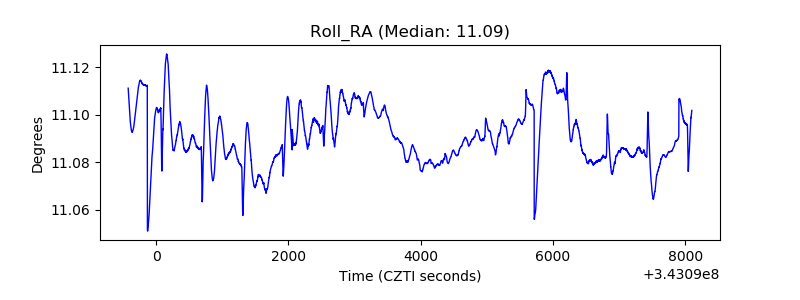 |
| Veto Counter | 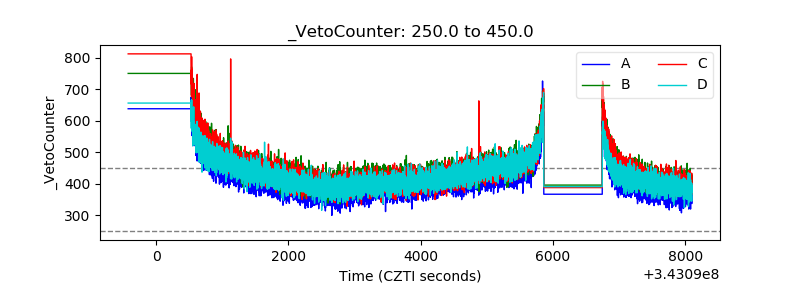 |