| Param | Original file | Final file |
|---|---|---|
| Filename | modeM0/AS1A10_002T05_9000004000_27752cztM0_level2.evt | modeM0/AS1A10_002T05_9000004000_27752cztM0_level2_quad_clean.evt |
| Size (bytes) | 544,311,360 | 108,247,680 |
| Size | 519.1 MB | 103.2 MB |
| Events in quadrant A | 3,717,301 | 699,051 |
| Events in quadrant B | 3,719,265 | 699,811 |
| Events in quadrant C | 4,291,115 | 675,866 |
| Events in quadrant D | 4,233,332 | 667,039 |
| Mode M9 | |||
|---|---|---|---|
| Quadrant | BADHDUFLAG | Total packets | Discarded packets |
| A | 0 | 14 | 0 |
| B | 0 | 14 | 0 |
| C | 0 | 14 | 0 |
| D | 0 | 14 | 0 |
| Mode M0 | |||
|---|---|---|---|
| Quadrant | BADHDUFLAG | Total packets | Discarded packets |
| A | 0 | 16073 | 0 |
| B | 0 | 16041 | 0 |
| C | 0 | 17639 | 0 |
| D | 0 | 17944 | 0 |
| Quadrant | Total seconds | Saturated seconds | Saturation percentage |
|---|---|---|---|
| A | 7710 | 30 | 0.389105% |
| B | 7709 | 49 | 0.635621% |
| C | 7709 | 131 | 1.699312% |
| D | 7709 | 50 | 0.648593% |
Noise dominated data is calculated using 1-second bins in cleaned event files. If a bin has >2000 counts, and if more than 50% of those come from <1% of pixels, then it is considered to be noise-dominated and hence unusable.
| Quadrant | # 1 sec bins | Bins with >0 counts | Bins with >2000 counts | High rate bins dominated by noise | Noise dominated (total time) | Noise dominated (detector-on time) | Marked lightcurve |
|---|---|---|---|---|---|---|---|
| A | 9120 | 7712 | 3 | 3 | 0.03% | 0.04% | 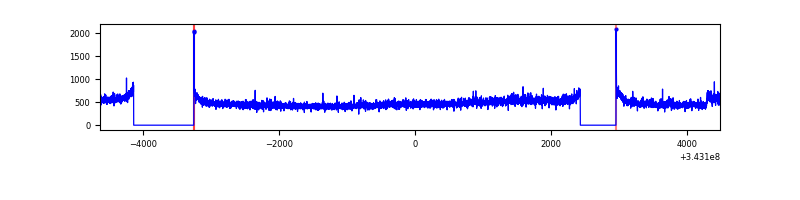 |
| B | 9119 | 7711 | 1 | 1 | 0.01% | 0.01% | 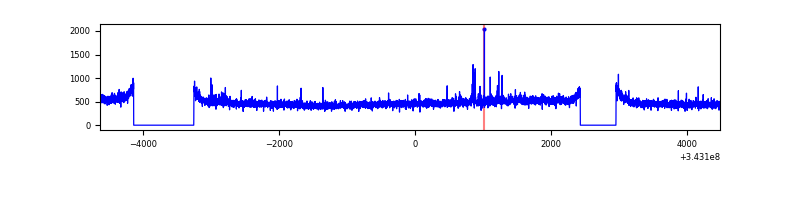 |
| C | 9119 | 7710 | 3 | 3 | 0.03% | 0.04% | 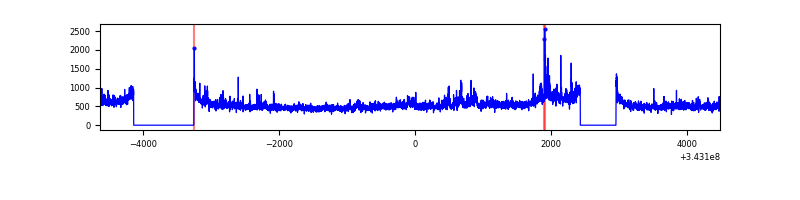 |
| D | 9119 | 7711 | 41 | 41 | 0.45% | 0.53% | 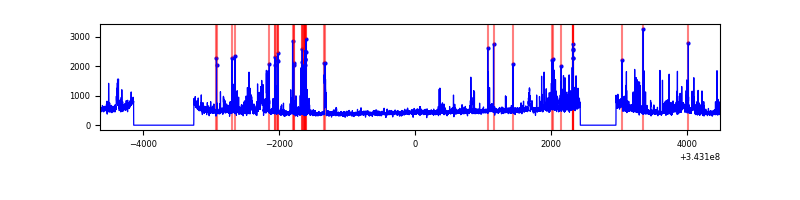 |
Top three noisy pixels from each quadrant. If the there are fewer than three noisy pixels in the level2.evt file, extra rows are filled as -1
| Pixel properties | Quadrant properties | ||||||
|---|---|---|---|---|---|---|---|
| Quadrant | DetID | PixID | Counts | Sigma | Mean | Median | Sigma |
| A | 6 | 16 | 57315 | 298.78 | 937 | 916 | 188.8 |
| A | 0 | 13 | 26403 | 135.02 | 937 | 916 | 188.8 |
| A | 8 | 192 | 15091 | 75.09 | 937 | 916 | 188.8 |
| B | 0 | 190 | 23485 | 126.42 | 933 | 908 | 178.6 |
| B | 12 | 111 | 22082 | 118.56 | 933 | 908 | 178.6 |
| B | 4 | 52 | 21182 | 113.52 | 933 | 908 | 178.6 |
| C | 3 | 233 | 600203 | 2814.98 | 909 | 915 | 212.9 |
| C | 14 | 238 | 142976 | 667.29 | 909 | 915 | 212.9 |
| C | 13 | 61 | 6333 | 25.45 | 909 | 915 | 212.9 |
| D | 1 | 52 | 540610 | 2457.54 | 914 | 890 | 219.6 |
| D | 2 | 250 | 162184 | 734.43 | 914 | 890 | 219.6 |
| D | 2 | 234 | 32029 | 141.79 | 914 | 890 | 219.6 |
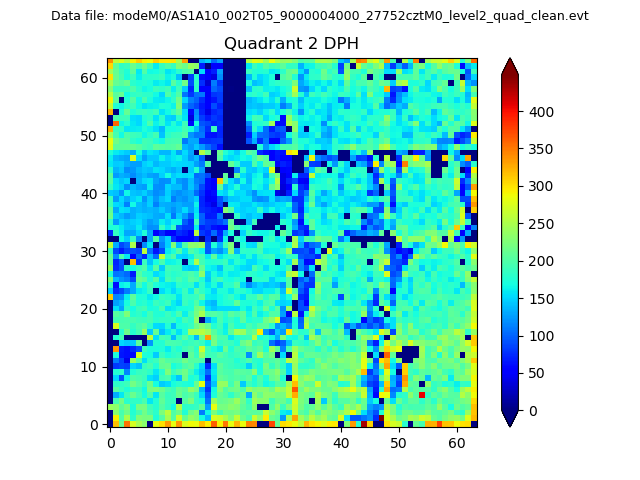
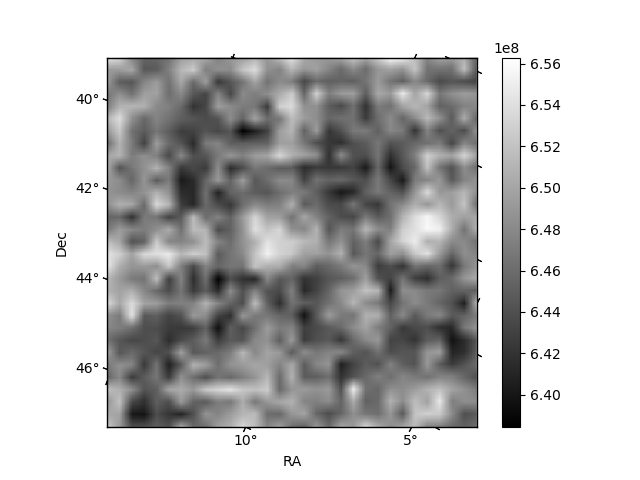
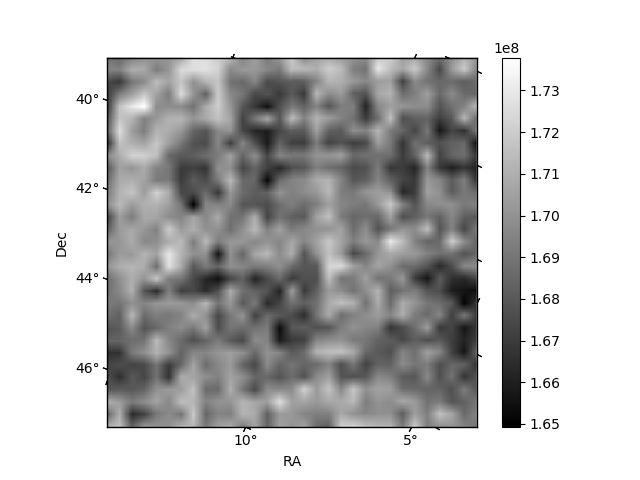
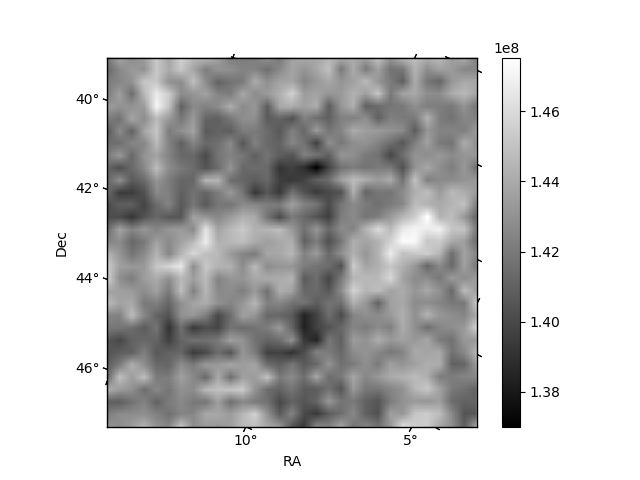
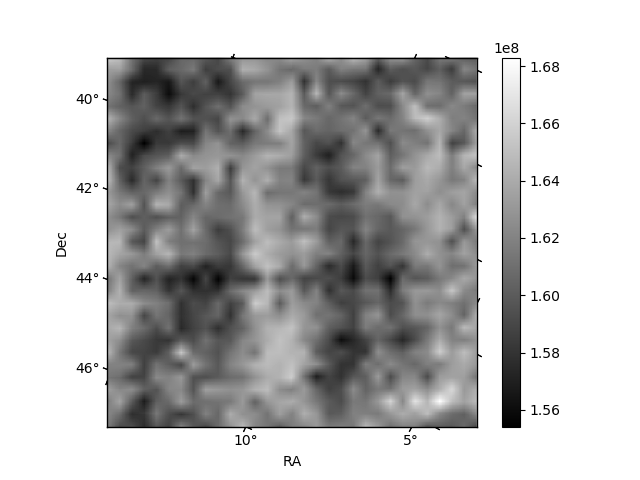
Histogram calculated using DETX and DETY for each event in the final _common_clean file
| Quadrant A | 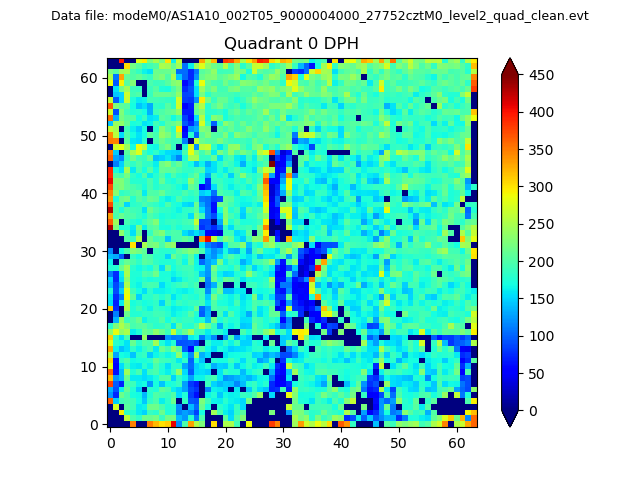 |
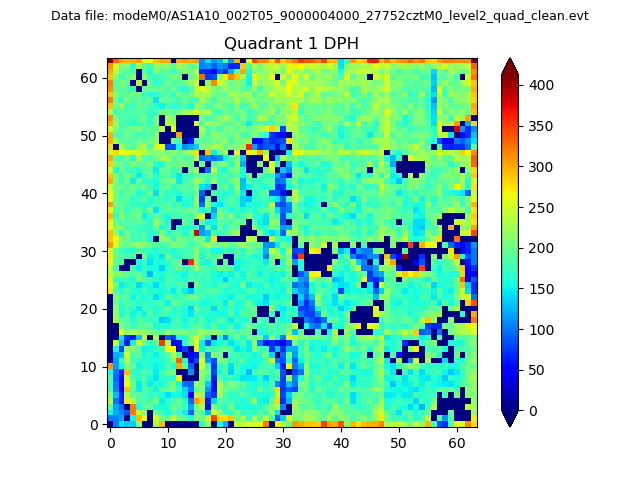 |
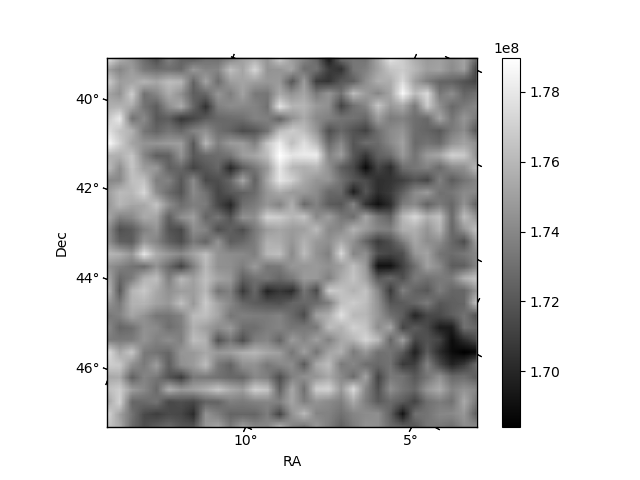
Quadrant B |
|---|---|---|---|
| Quadrant D | 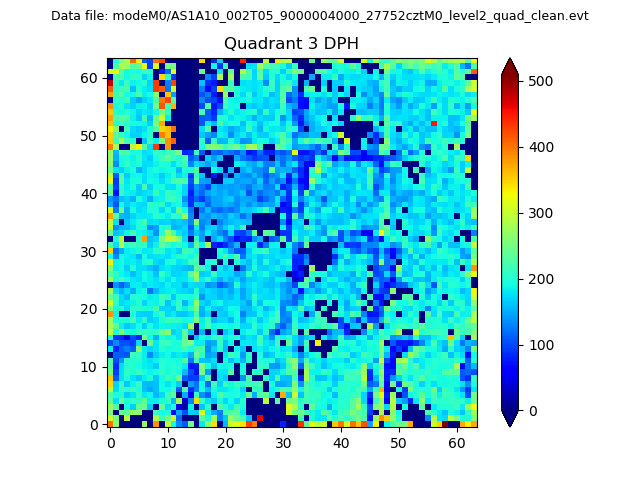 |
 |
Quadrant C |
| Plot type | Count rate plots | Images |
|---|---|---|
| Comparison with Poisson distribution Blue bars denote a histogram of data divided into 1 sec bins. Red curve is a Poisson curve with rate = median count rate of data. |
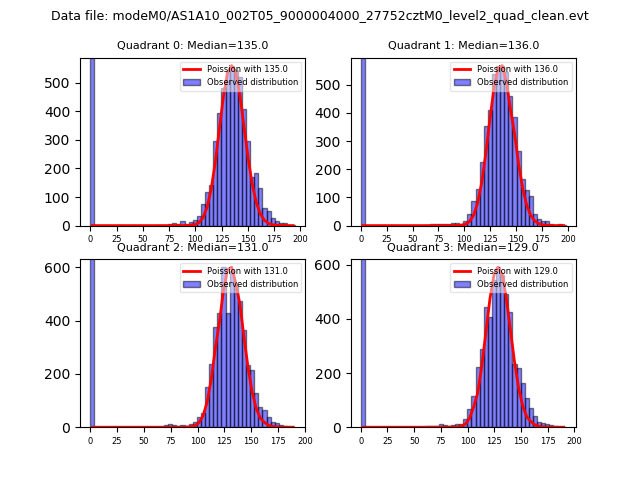 |
 |
| Quadrant-wise count rates Data is divided into 100 sec bins |
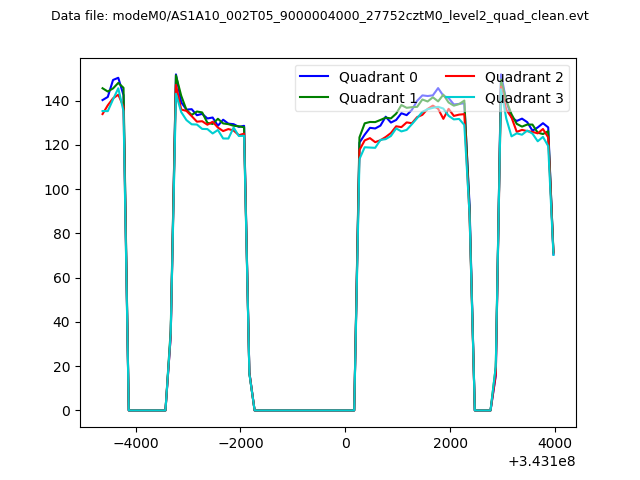 |
|
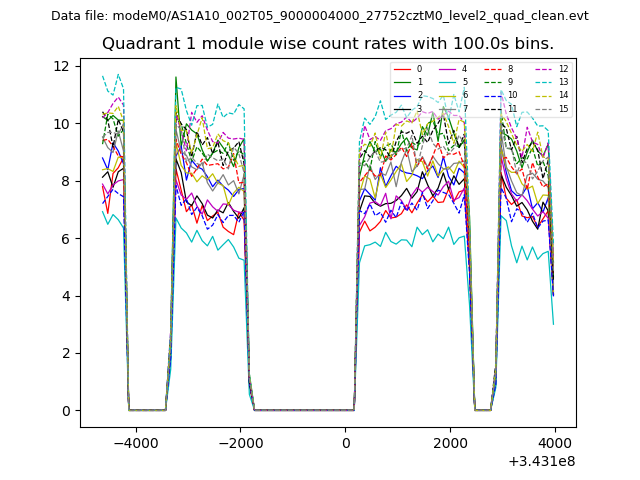
| Module-wise count rates for Quadrant A Data is divided into 100 sec bins |
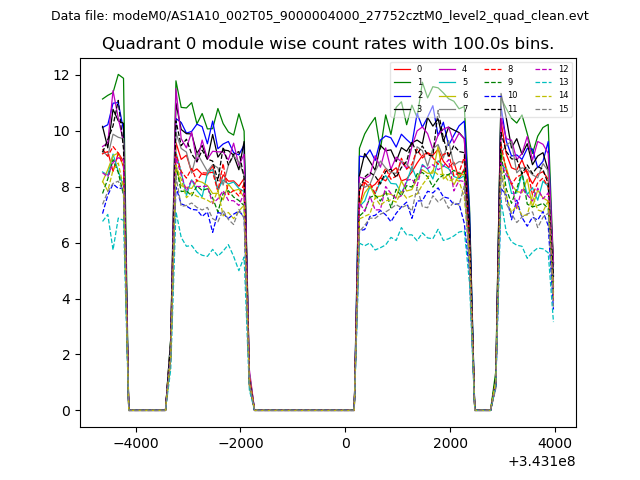 |
 |
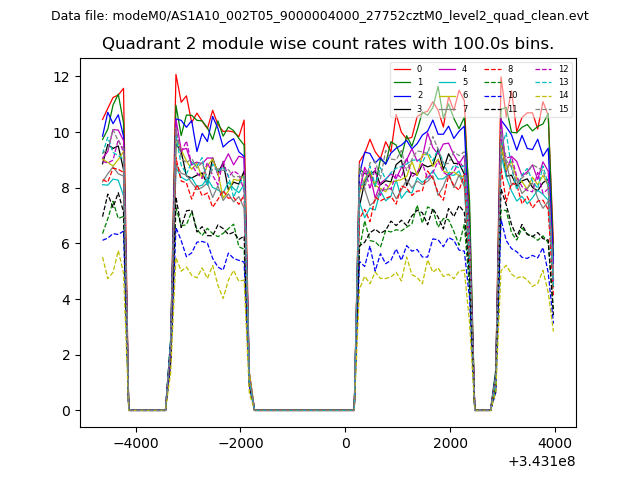
| Module-wise count rates for Quadrant B Data is divided into 100 sec bins |
 |
 |
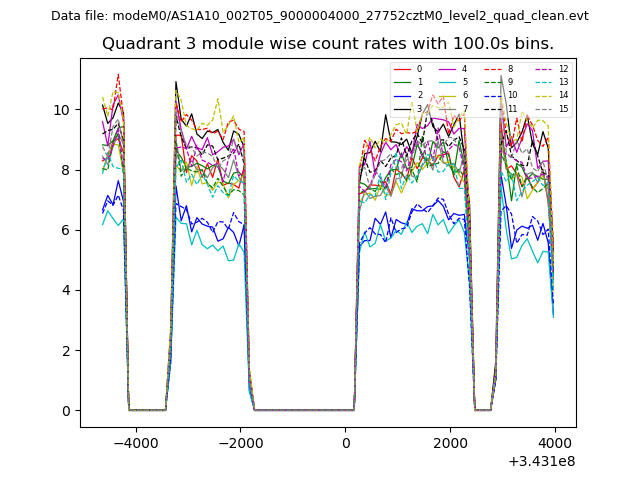
| Module-wise count rates for Quadrant C Data is divided into 100 sec bins |
 |
 |
| Module-wise count rates for Quadrant D Data is divided into 100 sec bins |
 |
 |
| Parameter | Plot |
|---|---|
| CZT HV Monitor | 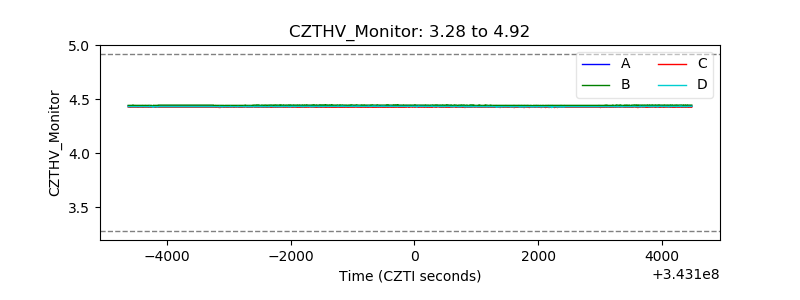 |
| D_VDD | 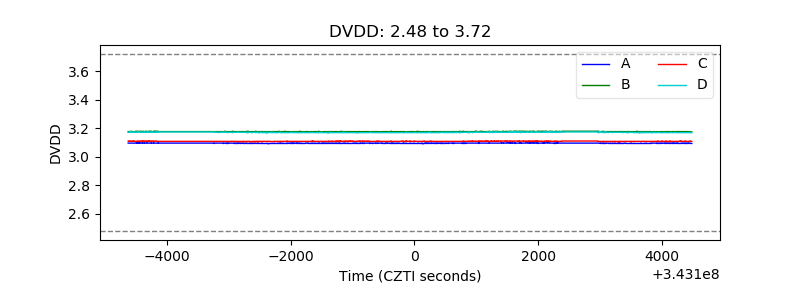 |
| Temperature 1 | 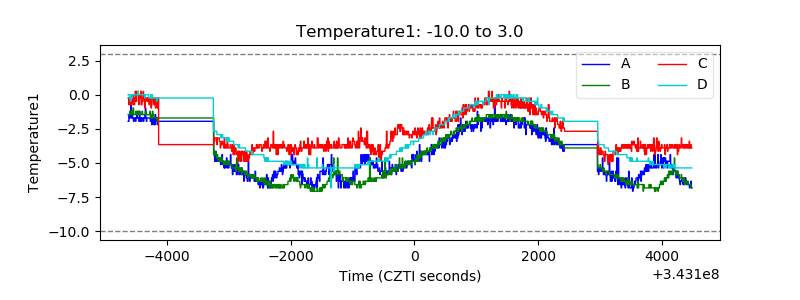 |
| Veto HV Monitor | 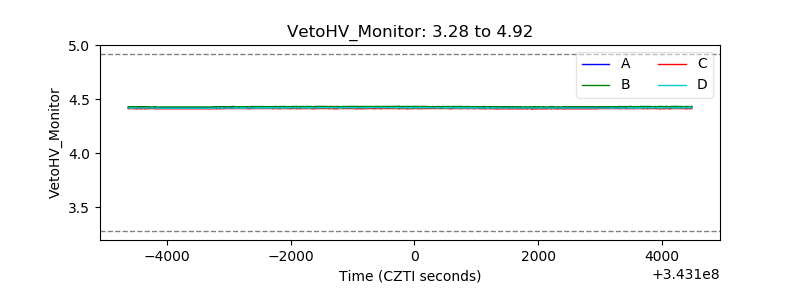 |
| Veto LLD | 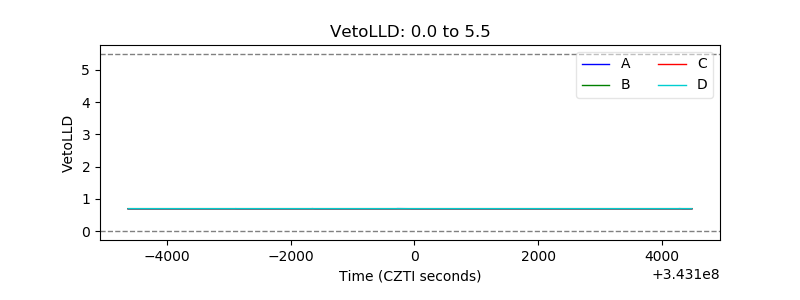 |
| Alpha Counter | 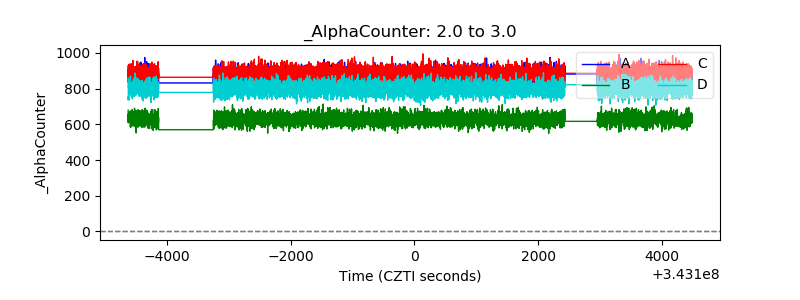 |
| _CPM_Rate | 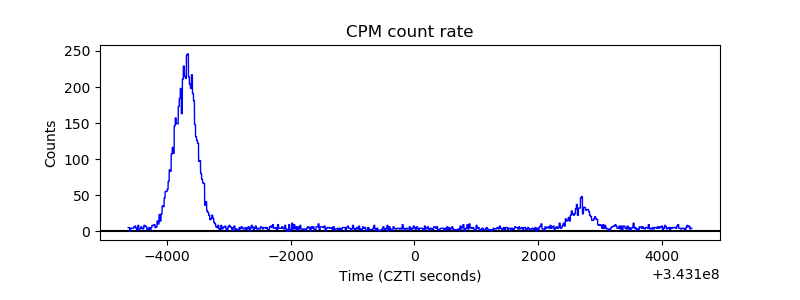 |
| CZT Counter | 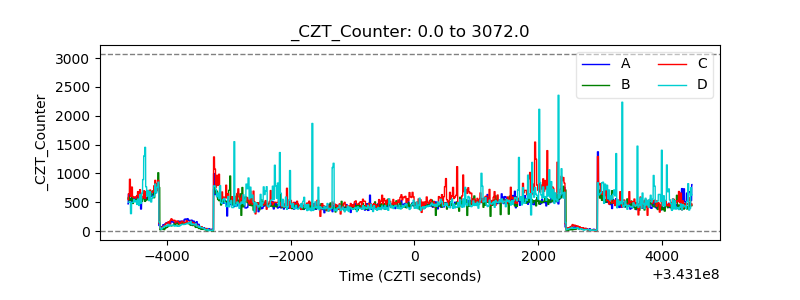 |
| +2.5 Volts monitor |  |
| +5 Volts monitor | 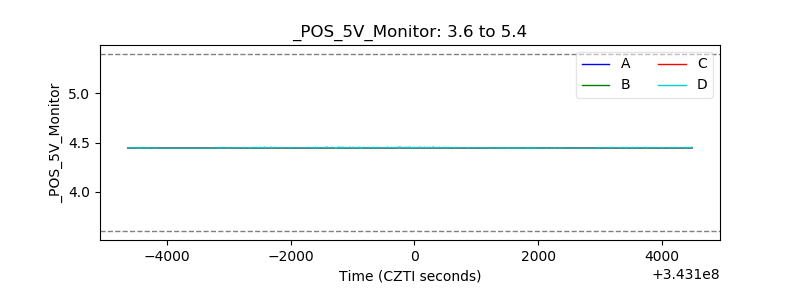 |
| _ROLL_ROT | 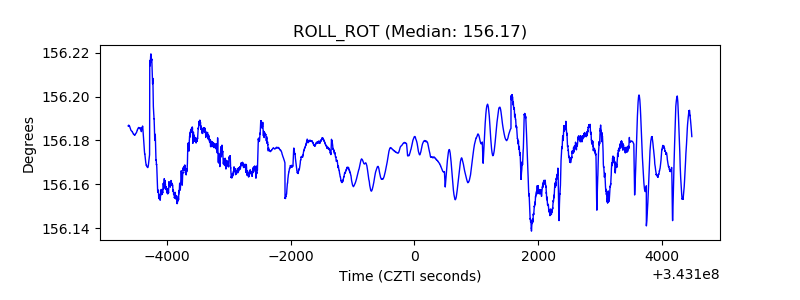 |
| _Roll_DEC | 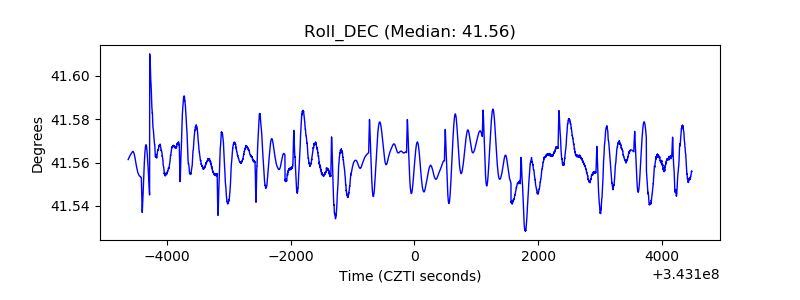 |
| _Roll_RA | 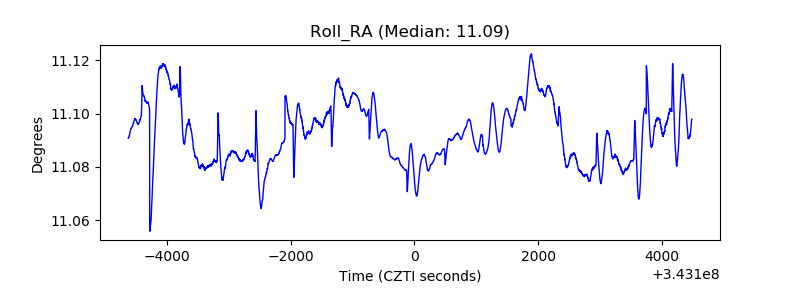 |
| Veto Counter | 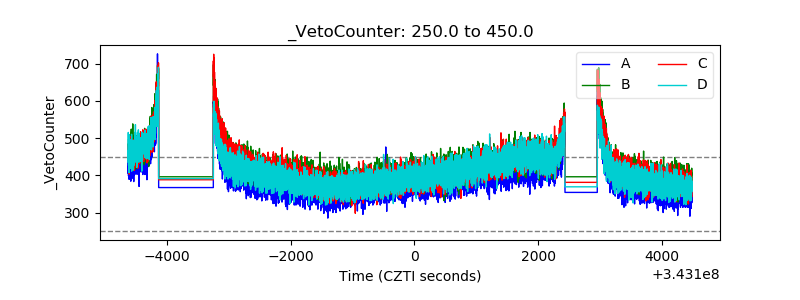 |