| Param | Original file | Final file |
|---|---|---|
| Filename | modeM0/AS1A10_002T05_9000004000_27754cztM0_level2.evt | modeM0/AS1A10_002T05_9000004000_27754cztM0_level2_quad_clean.evt |
| Size (bytes) | 521,092,800 | 89,775,360 |
| Size | 497.0 MB | 85.6 MB |
| Events in quadrant A | 3,634,187 | 556,989 |
| Events in quadrant B | 3,707,927 | 555,782 |
| Events in quadrant C | 3,879,629 | 539,736 |
| Events in quadrant D | 4,037,693 | 531,491 |
| Mode M9 | |||
|---|---|---|---|
| Quadrant | BADHDUFLAG | Total packets | Discarded packets |
| A | 0 | 7 | 0 |
| B | 0 | 7 | 0 |
| C | 0 | 7 | 0 |
| D | 0 | 7 | 0 |
| Mode M0 | |||
|---|---|---|---|
| Quadrant | BADHDUFLAG | Total packets | Discarded packets |
| A | 0 | 15880 | 0 |
| B | 0 | 16002 | 0 |
| C | 0 | 16344 | 0 |
| D | 0 | 17448 | 0 |
| Quadrant | Total seconds | Saturated seconds | Saturation percentage |
|---|---|---|---|
| A | 7688 | 109 | 1.417794% |
| B | 7688 | 166 | 2.159209% |
| C | 7688 | 164 | 2.133195% |
| D | 7689 | 73 | 0.949408% |
Noise dominated data is calculated using 1-second bins in cleaned event files. If a bin has >2000 counts, and if more than 50% of those come from <1% of pixels, then it is considered to be noise-dominated and hence unusable.
| Quadrant | # 1 sec bins | Bins with >0 counts | Bins with >2000 counts | High rate bins dominated by noise | Noise dominated (total time) | Noise dominated (detector-on time) | Marked lightcurve |
|---|---|---|---|---|---|---|---|
| A | 8288 | 7689 | 0 | 0 | 0.00% | 0.00% | 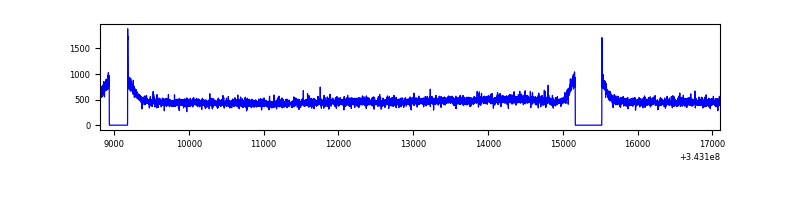 |
| B | 8288 | 7689 | 0 | 0 | 0.00% | 0.00% | 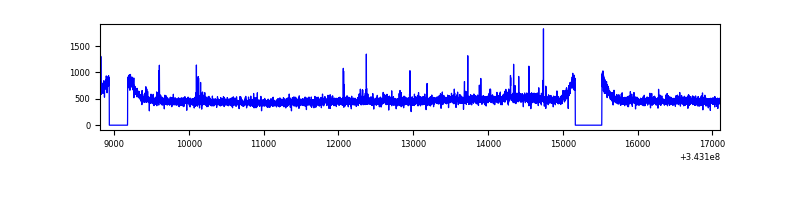 |
| C | 8288 | 7689 | 7 | 7 | 0.08% | 0.09% | 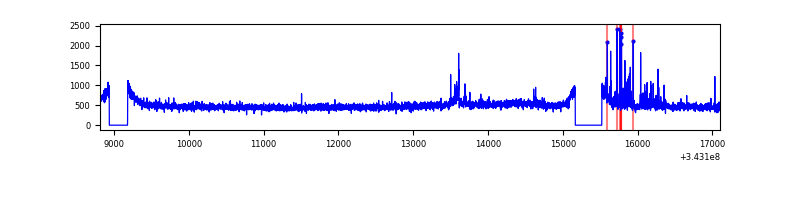 |
| D | 8289 | 7691 | 19 | 19 | 0.23% | 0.25% | 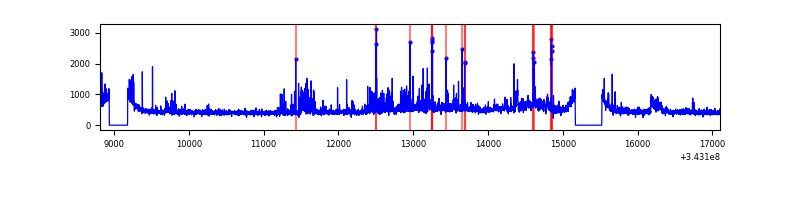 |
Top three noisy pixels from each quadrant. If the there are fewer than three noisy pixels in the level2.evt file, extra rows are filled as -1
| Pixel properties | Quadrant properties | ||||||
|---|---|---|---|---|---|---|---|
| Quadrant | DetID | PixID | Counts | Sigma | Mean | Median | Sigma |
| A | 13 | 254 | 13768 | 67.93 | 937 | 917 | 189.2 |
| A | 8 | 192 | 11782 | 57.44 | 937 | 917 | 189.2 |
| A | 3 | 137 | 9186 | 43.71 | 937 | 917 | 189.2 |
| B | 12 | 111 | 22899 | 122.4 | 932 | 905 | 179.7 |
| B | 11 | 111 | 20594 | 109.57 | 932 | 905 | 179.7 |
| B | 14 | 111 | 18516 | 98.01 | 932 | 905 | 179.7 |
| C | 14 | 238 | 143264 | 660.58 | 906 | 908 | 215.5 |
| C | 3 | 233 | 109488 | 503.85 | 906 | 908 | 215.5 |
| C | 15 | 208 | 89295 | 410.14 | 906 | 908 | 215.5 |
| D | 1 | 52 | 472082 | 2168.26 | 910 | 883 | 217.3 |
| D | 2 | 250 | 93556 | 426.44 | 910 | 883 | 217.3 |
| D | 2 | 234 | 32083 | 143.57 | 910 | 883 | 217.3 |
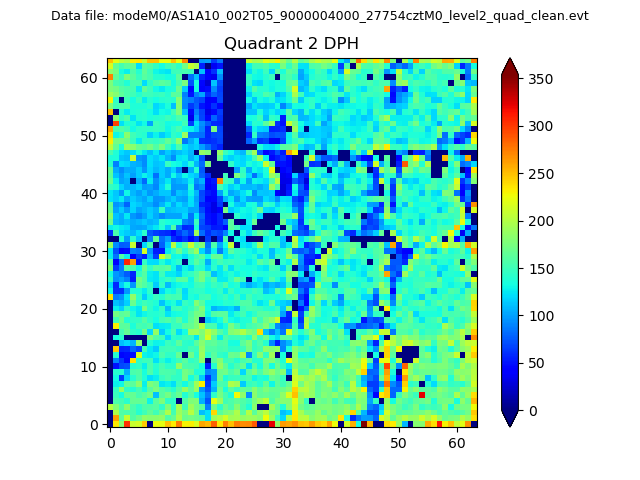
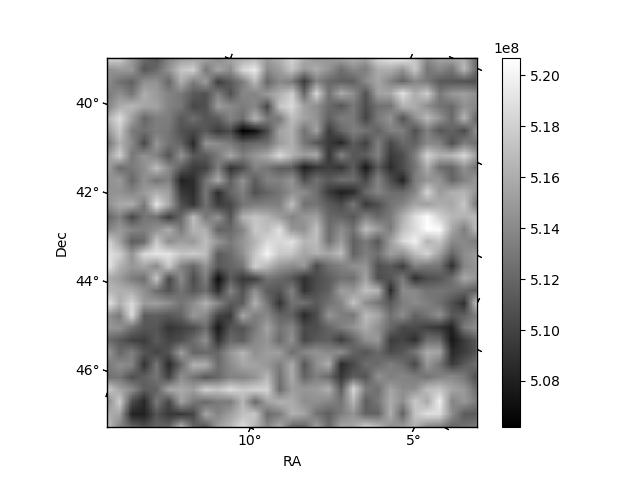
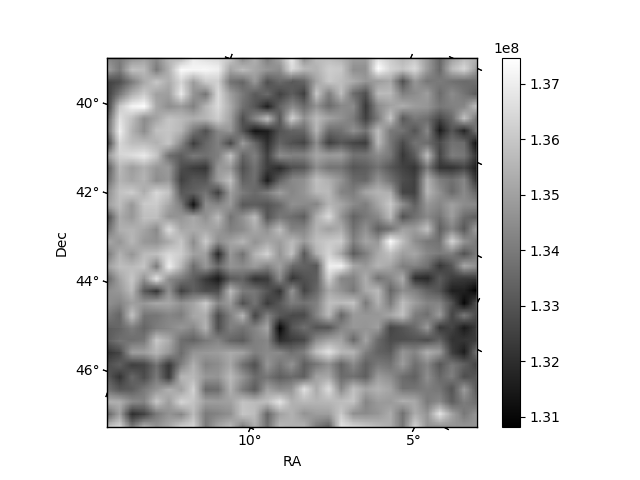
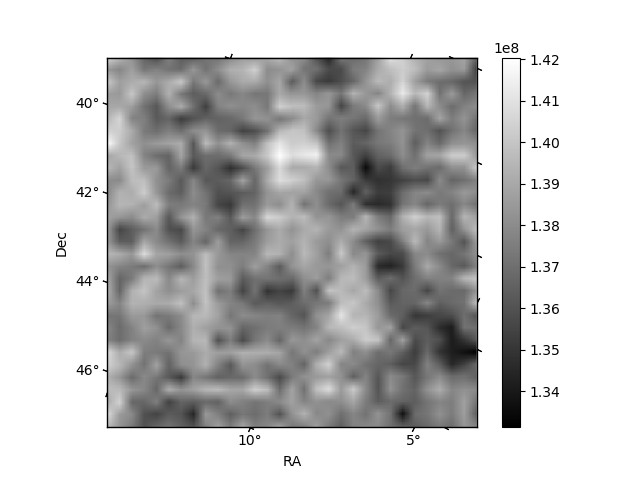
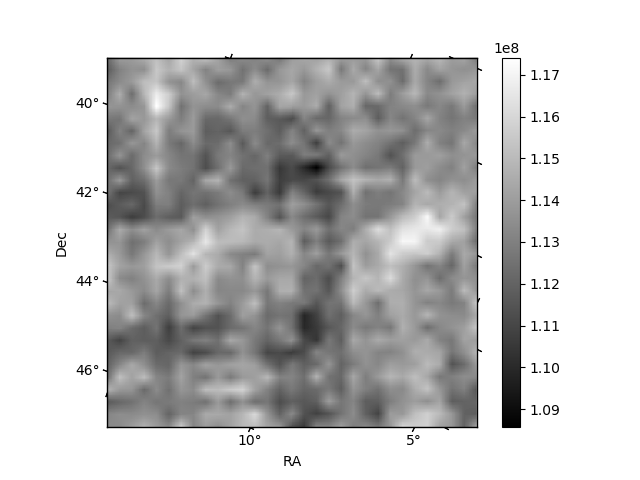
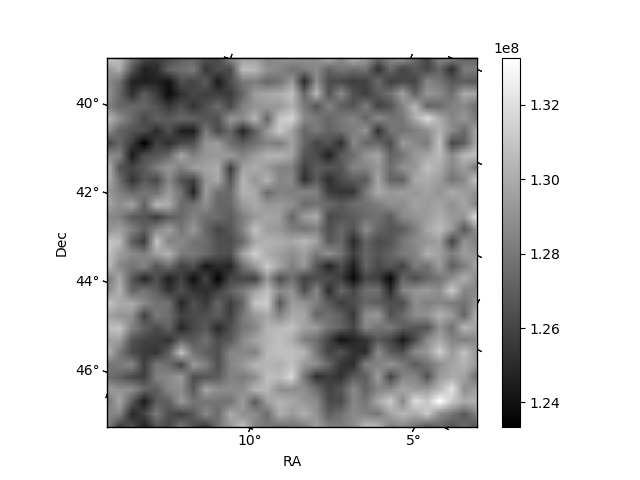
Histogram calculated using DETX and DETY for each event in the final _common_clean file
| Quadrant A | 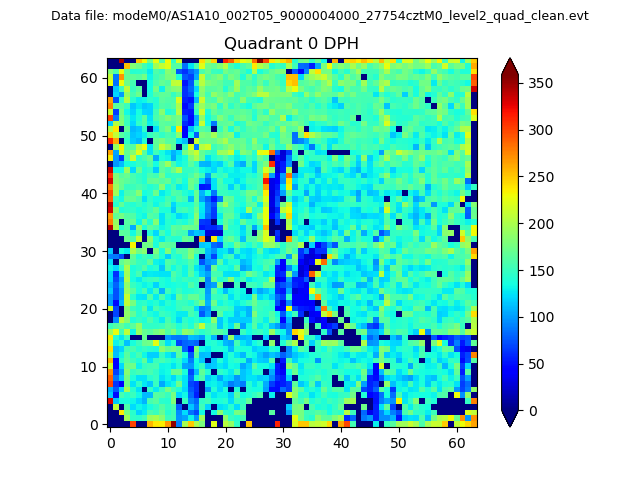 |
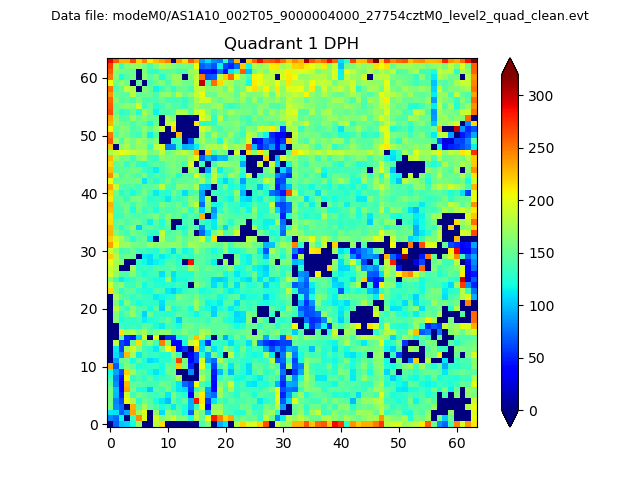 |
Quadrant B |
|---|---|---|---|
| Quadrant D | 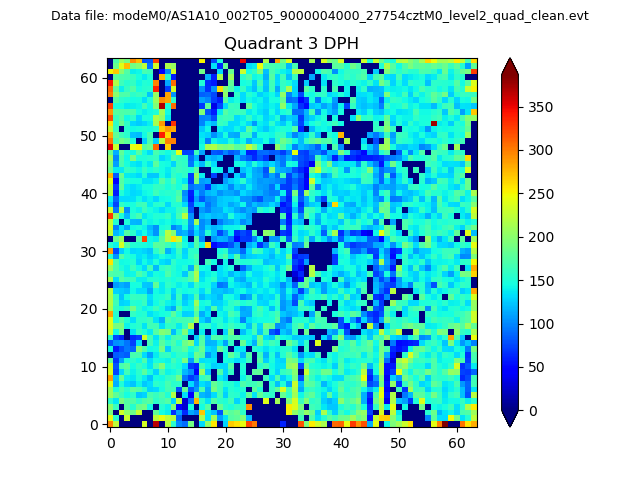 |
 |
Quadrant C |
| Plot type | Count rate plots | Images |
|---|---|---|
| Comparison with Poisson distribution Blue bars denote a histogram of data divided into 1 sec bins. Red curve is a Poisson curve with rate = median count rate of data. |
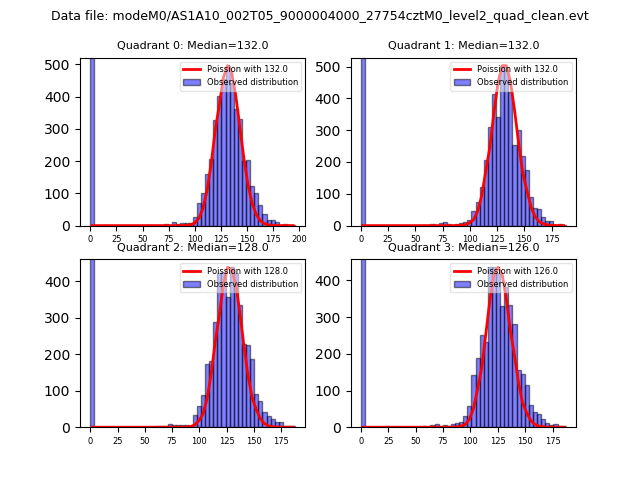 |
 |
| Quadrant-wise count rates Data is divided into 100 sec bins |
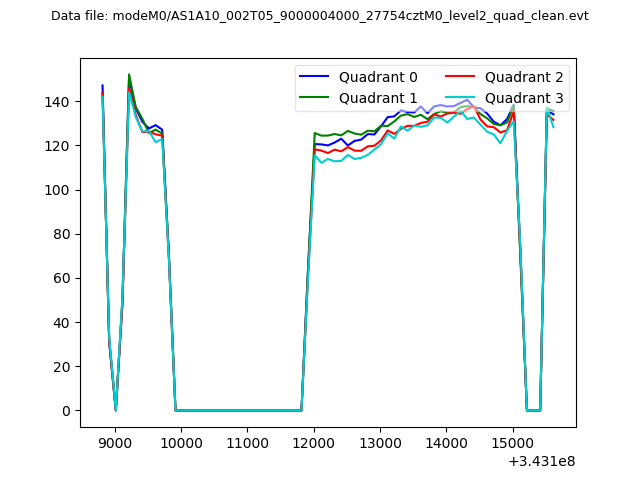 |
|
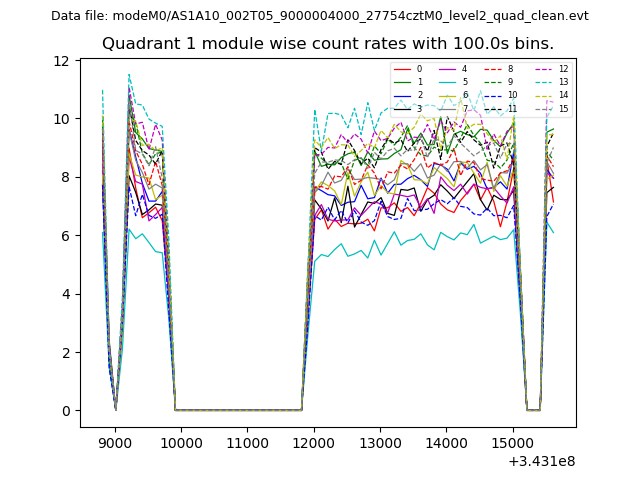
| Module-wise count rates for Quadrant A Data is divided into 100 sec bins |
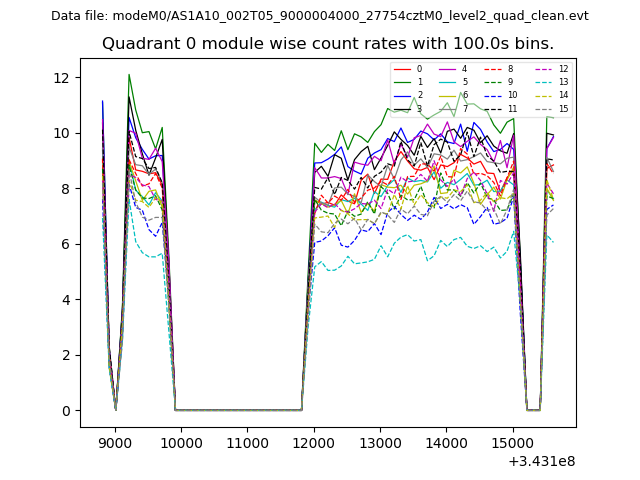 |
 |
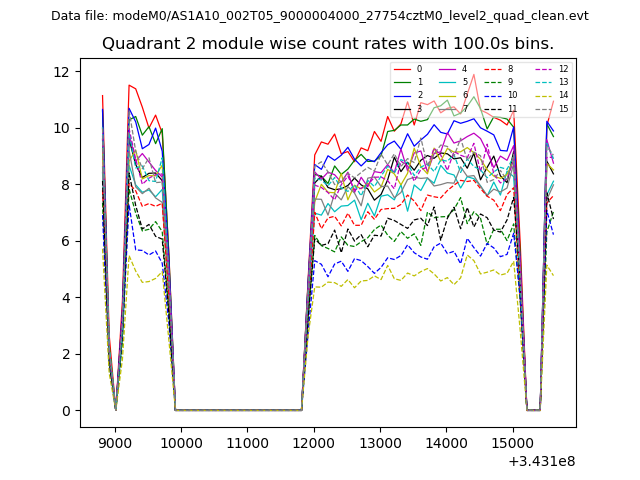
| Module-wise count rates for Quadrant B Data is divided into 100 sec bins |
 |
 |
| Module-wise count rates for Quadrant C Data is divided into 100 sec bins |
 |
 |
| Module-wise count rates for Quadrant D Data is divided into 100 sec bins |
 |
 |
| Parameter | Plot |
|---|---|
| CZT HV Monitor | 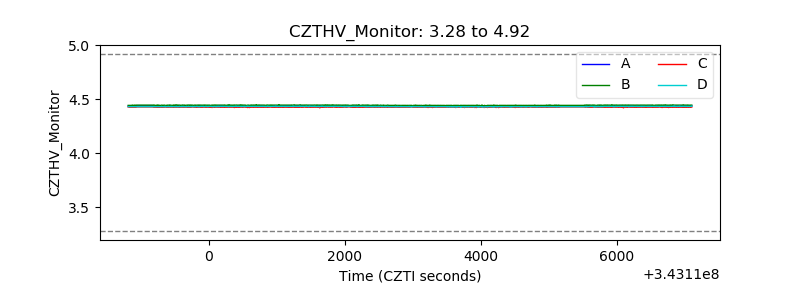 |
| D_VDD | 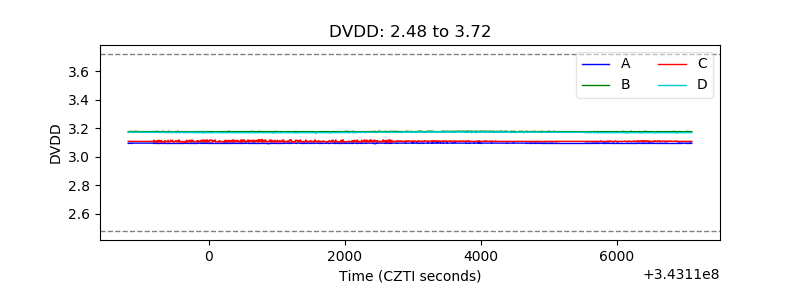 |
| Temperature 1 | 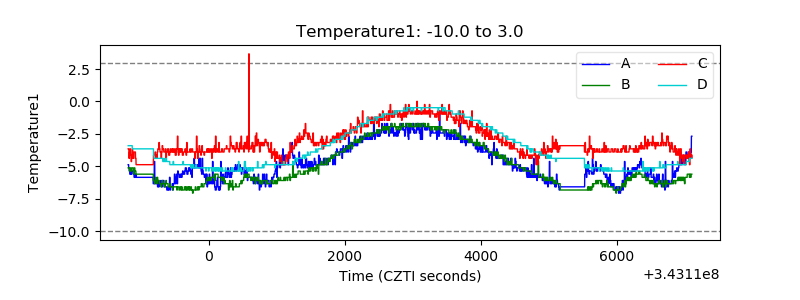 |
| Veto HV Monitor | 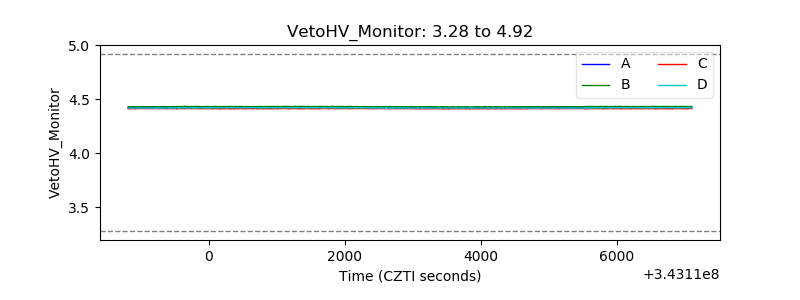 |
| Veto LLD | 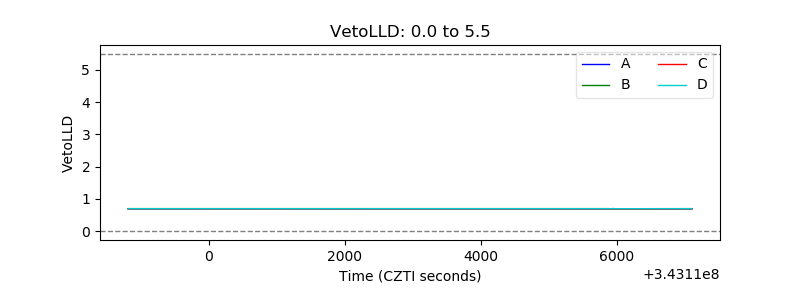 |
| Alpha Counter | 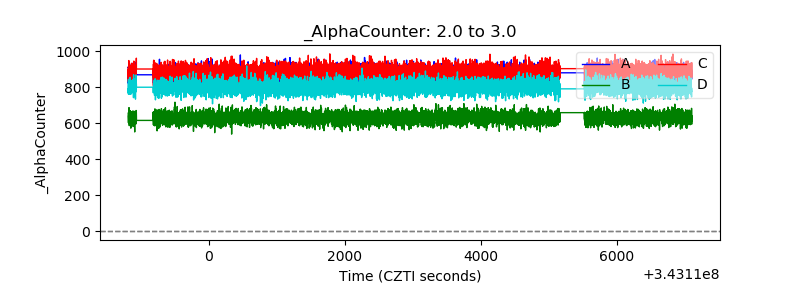 |
| _CPM_Rate | 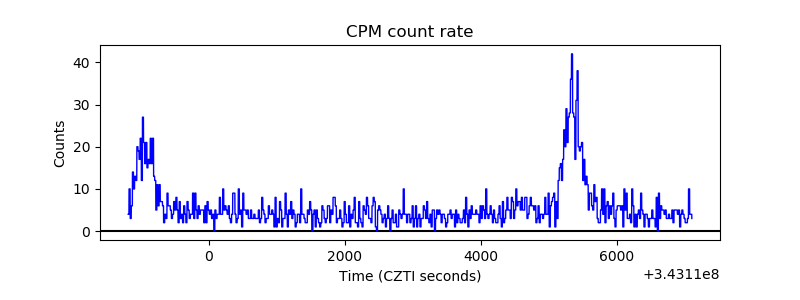 |
| CZT Counter | 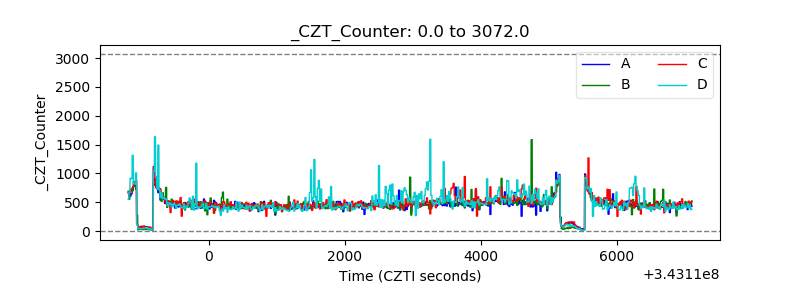 |
| +2.5 Volts monitor | 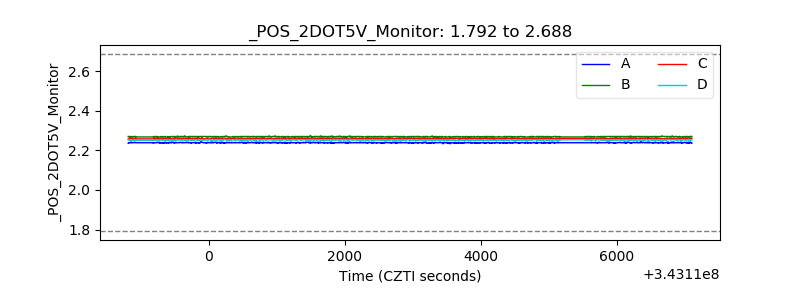 |
| +5 Volts monitor | 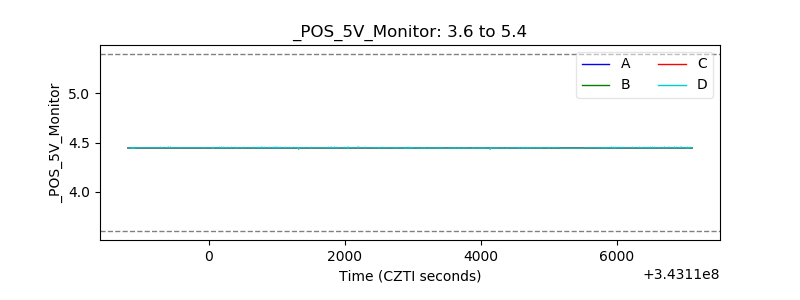 |
| _ROLL_ROT | 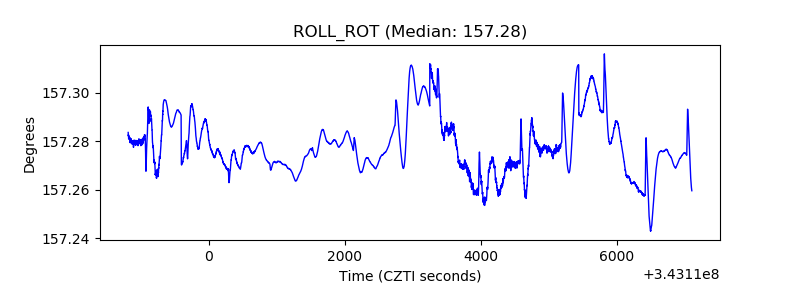 |
| _Roll_DEC |  |
| _Roll_RA | 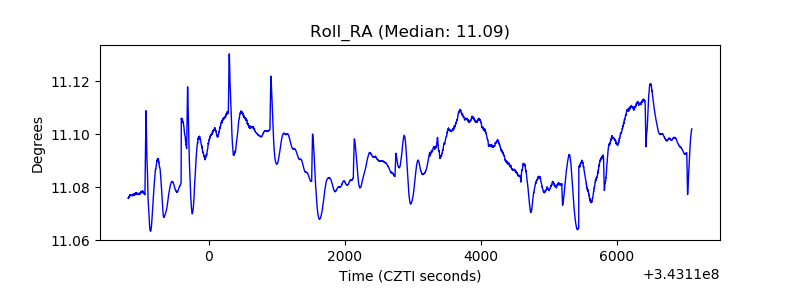 |
| Veto Counter | 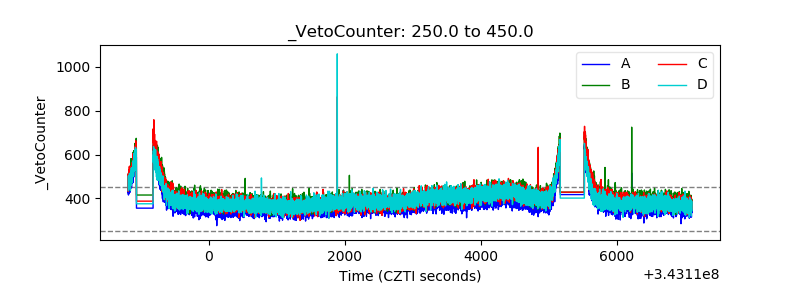 |