| Param | Original file | Final file |
|---|---|---|
| Filename | modeM0/AS1A10_002T05_9000004000_27756cztM0_level2.evt | modeM0/AS1A10_002T05_9000004000_27756cztM0_level2_quad_clean.evt |
| Size (bytes) | 389,292,480 | 73,782,720 |
| Size | 371.3 MB | 70.4 MB |
| Events in quadrant A | 2,652,077 | 469,206 |
| Events in quadrant B | 2,701,006 | 467,737 |
| Events in quadrant C | 2,880,462 | 452,247 |
| Events in quadrant D | 3,167,260 | 445,524 |
| Mode M9 | |||
|---|---|---|---|
| Quadrant | BADHDUFLAG | Total packets | Discarded packets |
| A | 0 | 4 | 0 |
| B | 0 | 4 | 0 |
| C | 0 | 4 | 0 |
| D | 0 | 4 | 0 |
| Mode M0 | |||
|---|---|---|---|
| Quadrant | BADHDUFLAG | Total packets | Discarded packets |
| A | 0 | 11602 | 0 |
| B | 0 | 11696 | 0 |
| C | 0 | 12103 | 0 |
| D | 0 | 13550 | 0 |
| Quadrant | Total seconds | Saturated seconds | Saturation percentage |
|---|---|---|---|
| A | 5714 | 47 | 0.822541% |
| B | 5714 | 63 | 1.102555% |
| C | 5714 | 77 | 1.347567% |
| D | 5715 | 40 | 0.699913% |
Noise dominated data is calculated using 1-second bins in cleaned event files. If a bin has >2000 counts, and if more than 50% of those come from <1% of pixels, then it is considered to be noise-dominated and hence unusable.
| Quadrant | # 1 sec bins | Bins with >0 counts | Bins with >2000 counts | High rate bins dominated by noise | Noise dominated (total time) | Noise dominated (detector-on time) | Marked lightcurve |
|---|---|---|---|---|---|---|---|
| A | 6069 | 5714 | 2 | 2 | 0.03% | 0.04% | 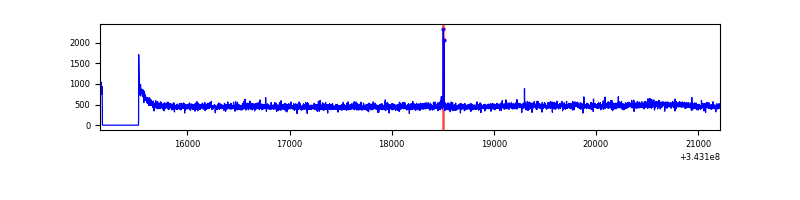 |
| B | 6069 | 5714 | 0 | 0 | 0.00% | 0.00% | 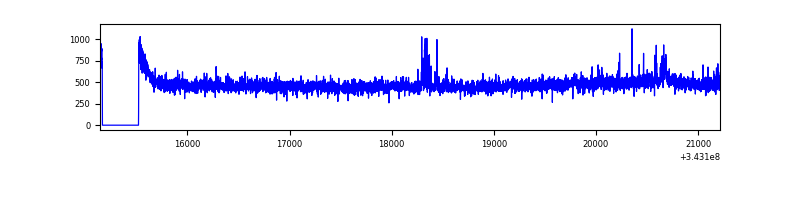 |
| C | 6069 | 5714 | 8 | 8 | 0.13% | 0.14% | 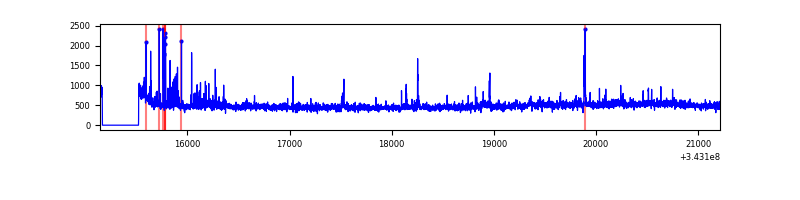 |
| D | 6070 | 5716 | 15 | 15 | 0.25% | 0.26% | 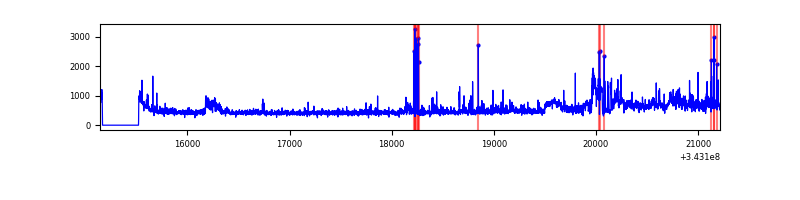 |
Top three noisy pixels from each quadrant. If the there are fewer than three noisy pixels in the level2.evt file, extra rows are filled as -1
| Pixel properties | Quadrant properties | ||||||
|---|---|---|---|---|---|---|---|
| Quadrant | DetID | PixID | Counts | Sigma | Mean | Median | Sigma |
| A | 0 | 13 | 12119 | 82.58 | 682 | 667 | 138.7 |
| A | 13 | 254 | 8892 | 59.31 | 682 | 667 | 138.7 |
| A | 3 | 137 | 6711 | 43.59 | 682 | 667 | 138.7 |
| B | 4 | 52 | 20206 | 149.0 | 676 | 657 | 131.2 |
| B | 12 | 111 | 16680 | 122.12 | 676 | 657 | 131.2 |
| B | 0 | 190 | 15762 | 115.13 | 676 | 657 | 131.2 |
| C | 3 | 233 | 114908 | 733.48 | 656 | 659 | 155.8 |
| C | 14 | 238 | 104187 | 664.66 | 656 | 659 | 155.8 |
| C | 15 | 208 | 90319 | 575.62 | 656 | 659 | 155.8 |
| D | 1 | 52 | 595468 | 3726.45 | 662 | 645 | 159.6 |
| D | 2 | 250 | 47809 | 295.47 | 662 | 645 | 159.6 |
| D | 2 | 234 | 23941 | 145.94 | 662 | 645 | 159.6 |
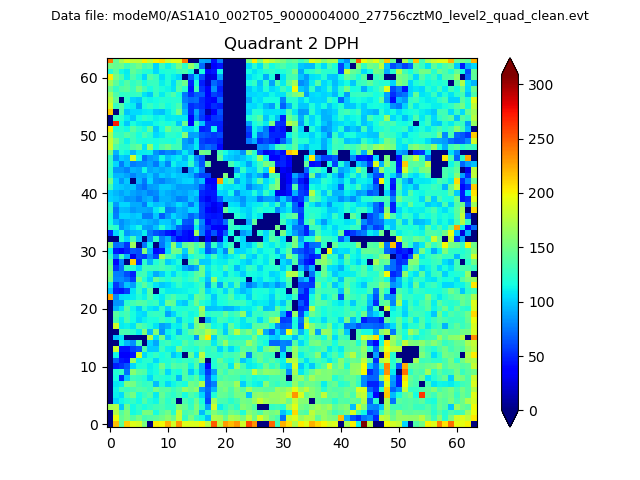
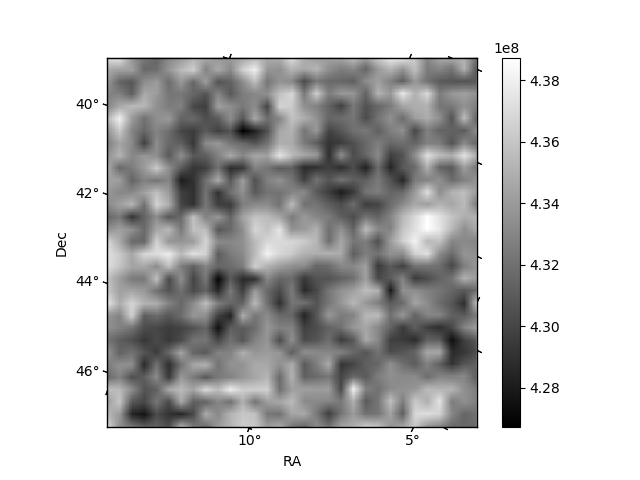
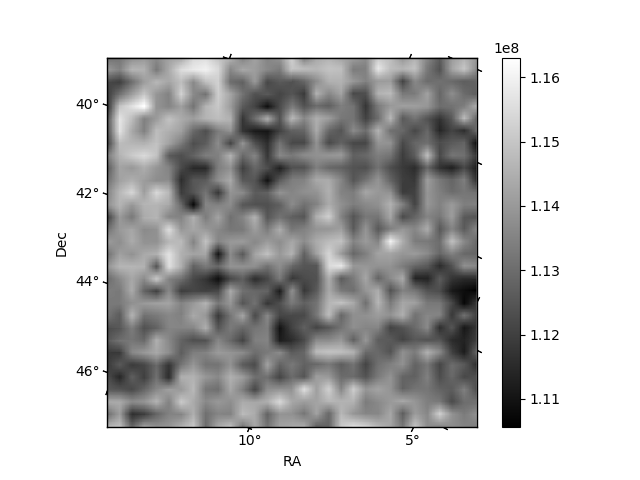
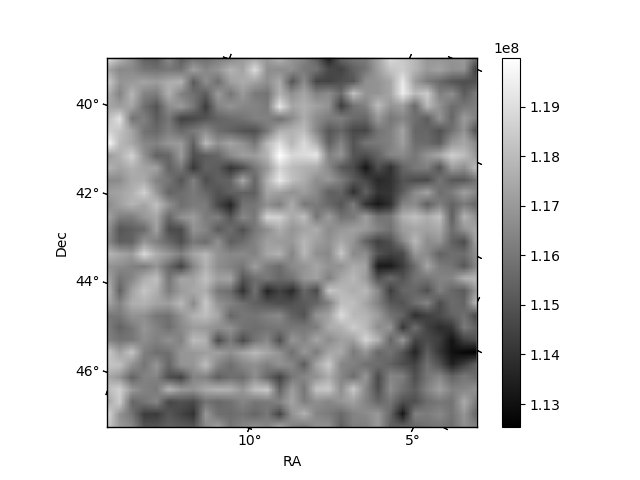
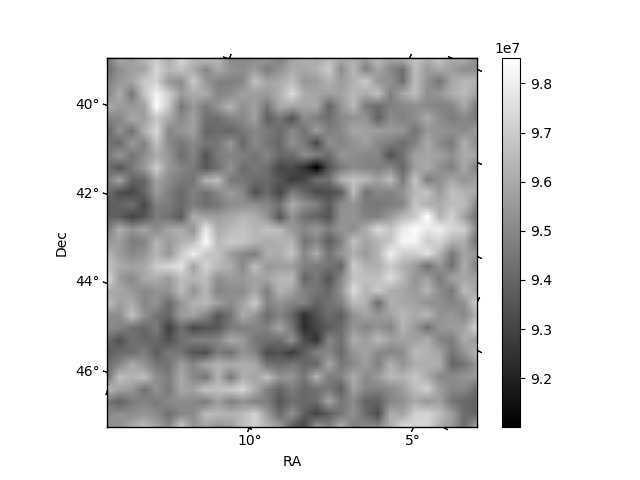
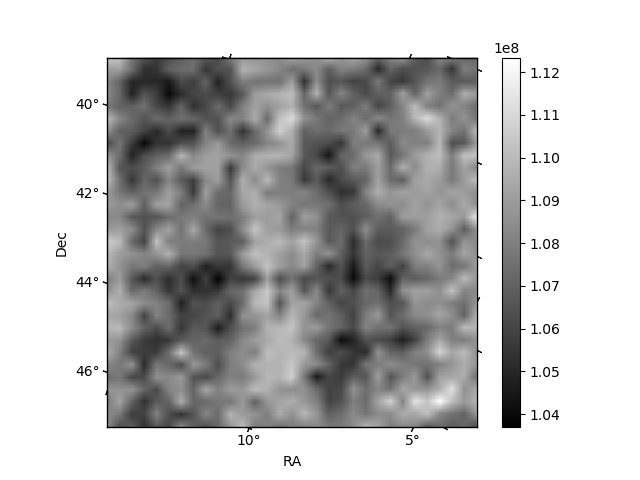
Histogram calculated using DETX and DETY for each event in the final _common_clean file
| Quadrant A | 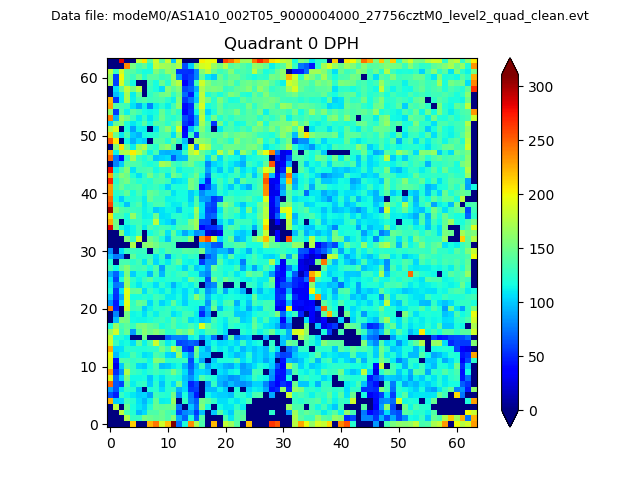 |
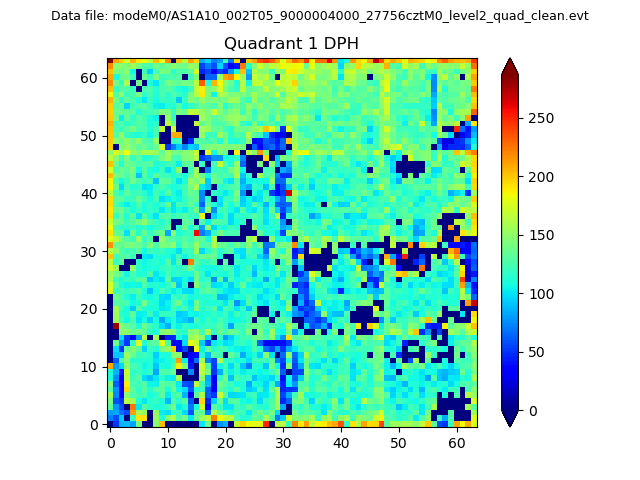 |
Quadrant B |
|---|---|---|---|
| Quadrant D | 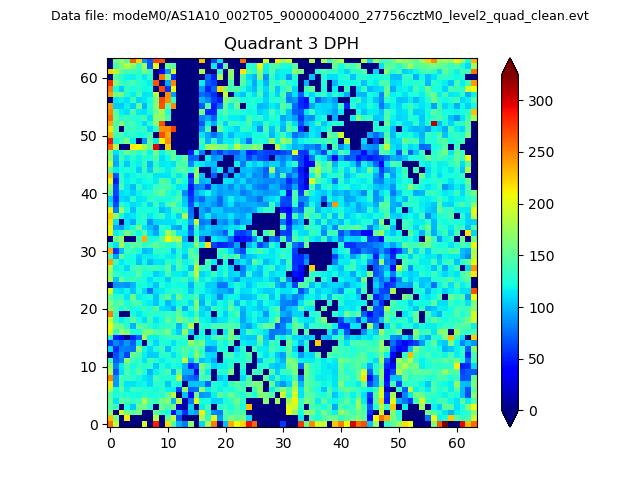 |
 |
Quadrant C |
| Plot type | Count rate plots | Images |
|---|---|---|
| Comparison with Poisson distribution Blue bars denote a histogram of data divided into 1 sec bins. Red curve is a Poisson curve with rate = median count rate of data. |
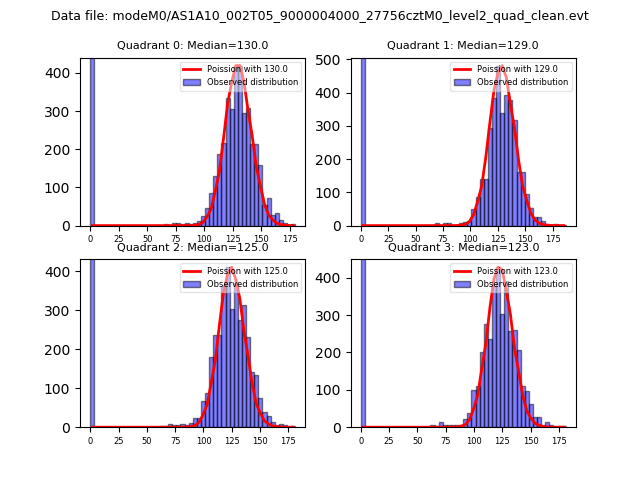 |
 |
| Quadrant-wise count rates Data is divided into 100 sec bins |
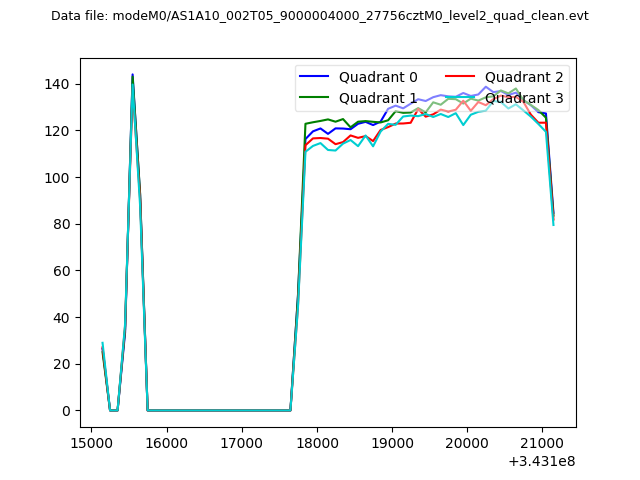 |
|
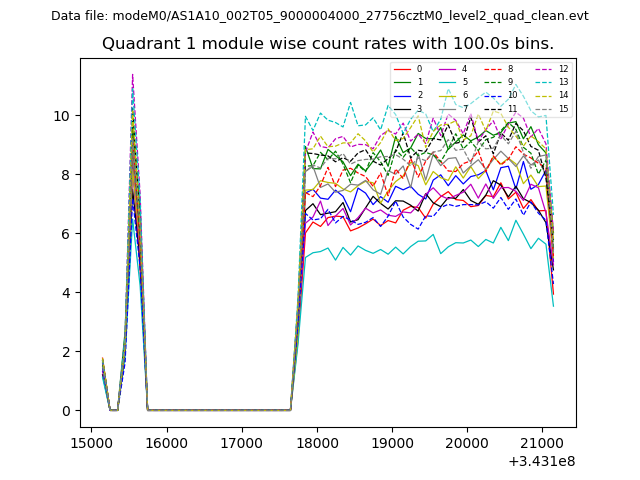
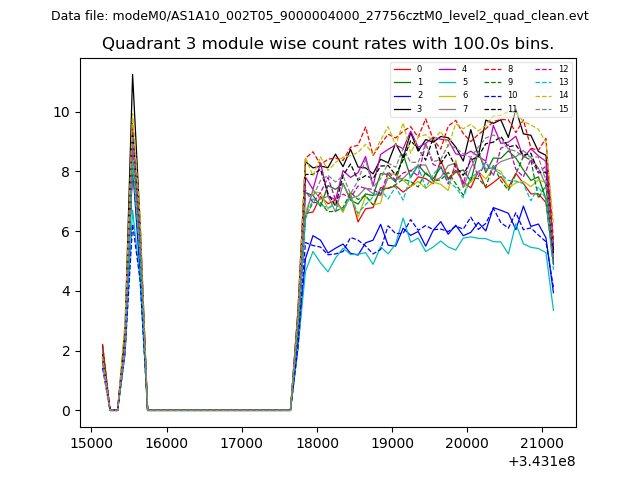
| Module-wise count rates for Quadrant A Data is divided into 100 sec bins |
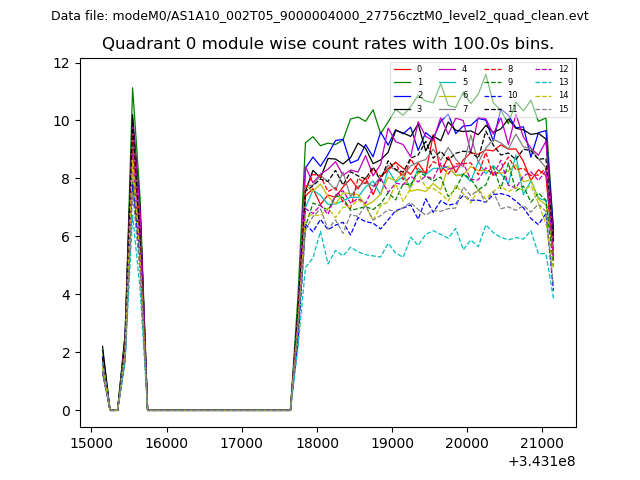 |
 |
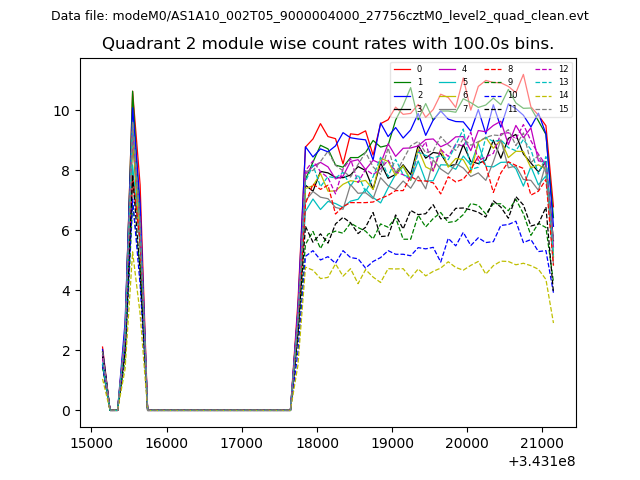
| Module-wise count rates for Quadrant B Data is divided into 100 sec bins |
 |
 |
| Module-wise count rates for Quadrant C Data is divided into 100 sec bins |
 |
 |
| Module-wise count rates for Quadrant D Data is divided into 100 sec bins |
 |
 |
| Parameter | Plot |
|---|---|
| CZT HV Monitor | 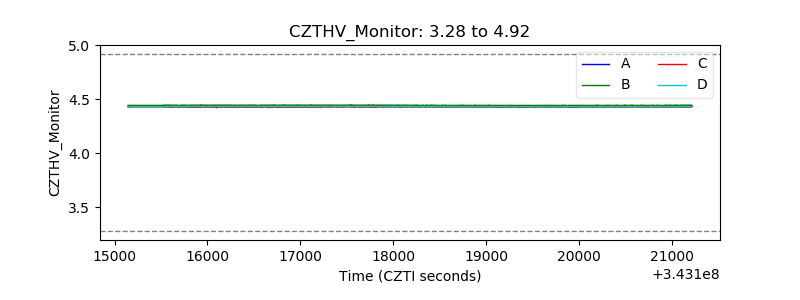 |
| D_VDD | 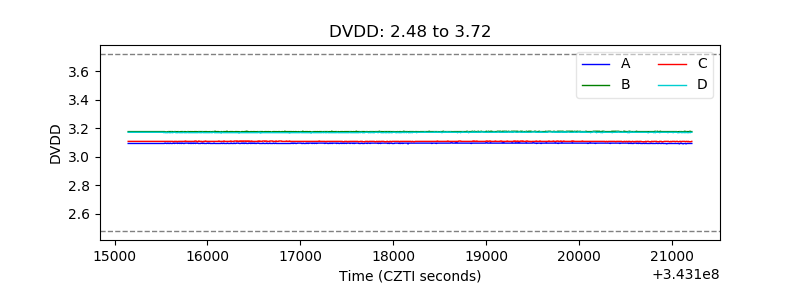 |
| Temperature 1 | 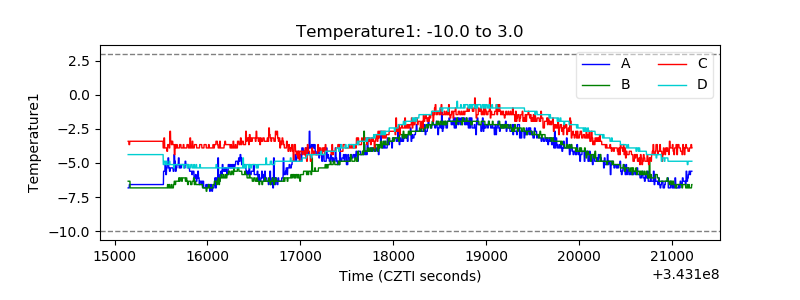 |
| Veto HV Monitor | 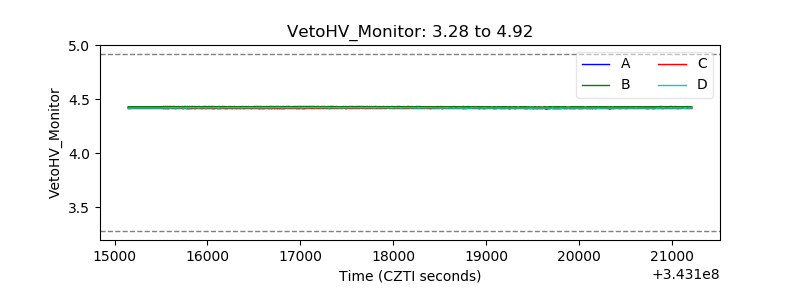 |
| Veto LLD |  |
| Alpha Counter | 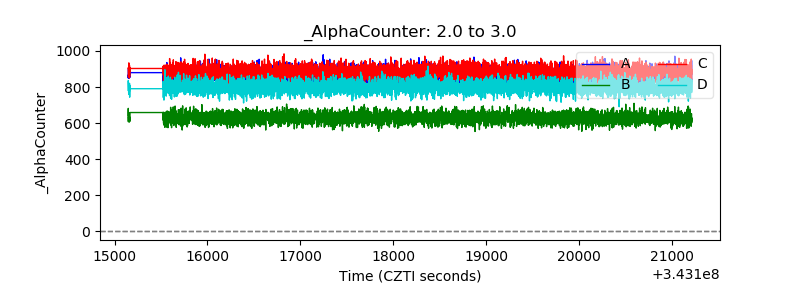 |
| _CPM_Rate | 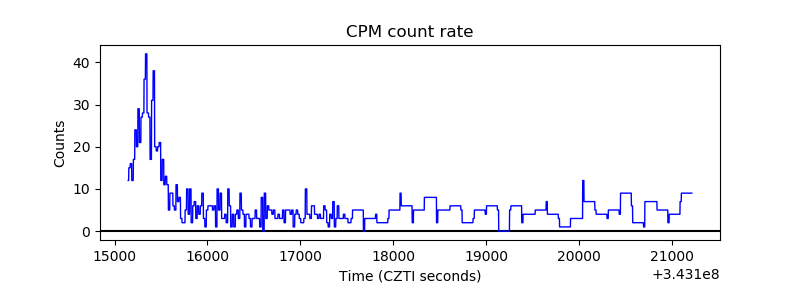 |
| CZT Counter | 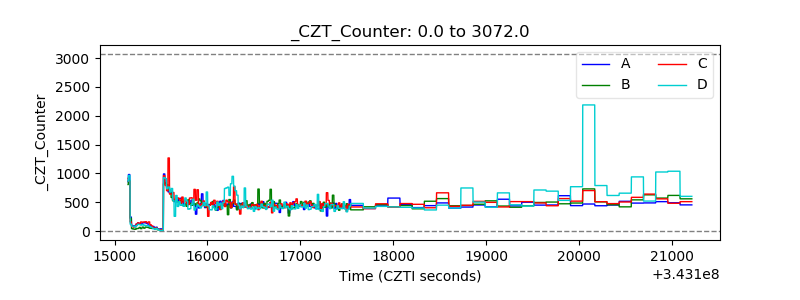 |
| +2.5 Volts monitor |  |
| +5 Volts monitor |  |
| _ROLL_ROT | 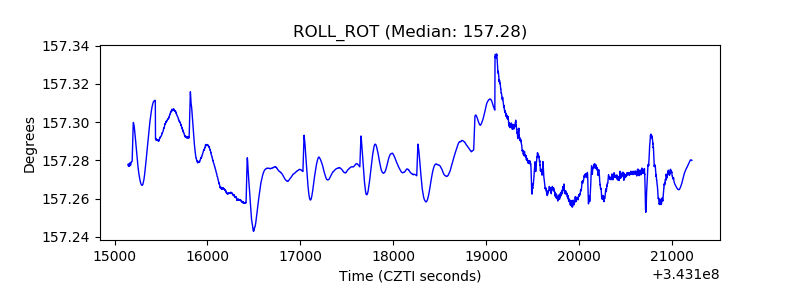 |
| _Roll_DEC | 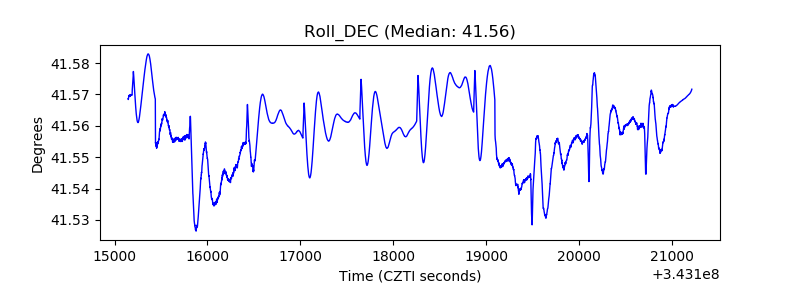 |
| _Roll_RA | 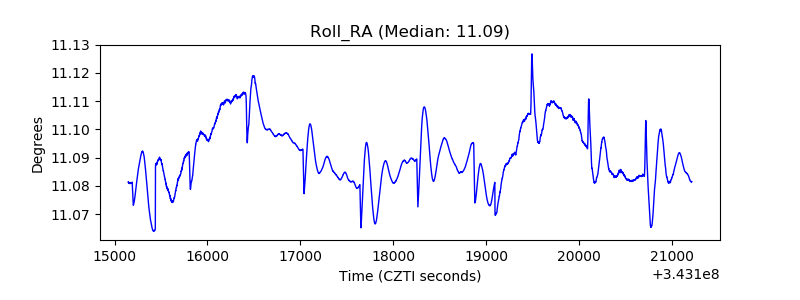 |
| Veto Counter |  |