| Param | Original file | Final file |
|---|---|---|
| Filename | modeM0/AS1A10_002T05_9000004000_27757cztM0_level2.evt | modeM0/AS1A10_002T05_9000004000_27757cztM0_level2_quad_clean.evt |
| Size (bytes) | 1,193,886,720 | 190,779,840 |
| Size | 1.1 GB | 181.9 MB |
| Events in quadrant A | 6,780,767 | 1,249,258 |
| Events in quadrant B | 11,326,899 | 1,158,449 |
| Events in quadrant C | 8,485,020 | 1,203,096 |
| Events in quadrant D | 8,599,255 | 1,180,713 |
| Mode M9 | |||
|---|---|---|---|
| Quadrant | BADHDUFLAG | Total packets | Discarded packets |
| A | 0 | 19 | 0 |
| B | 0 | 19 | 0 |
| C | 0 | 19 | 0 |
| D | 0 | 19 | 0 |
| Mode M0 | |||
|---|---|---|---|
| Quadrant | BADHDUFLAG | Total packets | Discarded packets |
| A | 0 | 29262 | 0 |
| B | 0 | 42732 | 0 |
| C | 0 | 33825 | 0 |
| D | 0 | 35290 | 0 |
| Quadrant | Total seconds | Saturated seconds | Saturation percentage |
|---|---|---|---|
| A | 14281 | 241 | 1.687557% |
| B | 14282 | 1824 | 12.771321% |
| C | 14282 | 703 | 4.922280% |
| D | 14281 | 401 | 2.807927% |
Noise dominated data is calculated using 1-second bins in cleaned event files. If a bin has >2000 counts, and if more than 50% of those come from <1% of pixels, then it is considered to be noise-dominated and hence unusable.
| Quadrant | # 1 sec bins | Bins with >0 counts | Bins with >2000 counts | High rate bins dominated by noise | Noise dominated (total time) | Noise dominated (detector-on time) | Marked lightcurve |
|---|---|---|---|---|---|---|---|
| A | 16231 | 14281 | 5 | 5 | 0.03% | 0.04% | 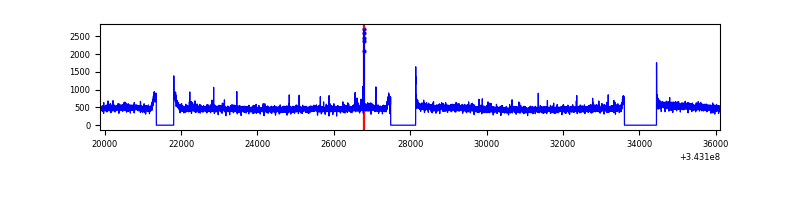 |
| B | 16232 | 14282 | 1219 | 1219 | 7.51% | 8.54% | 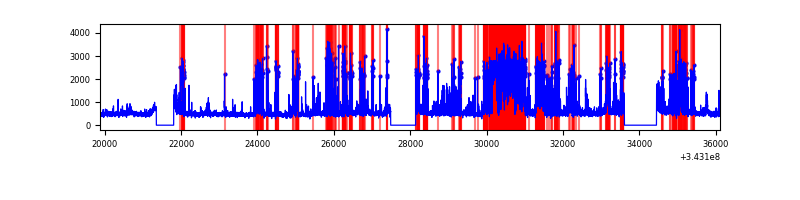 |
| C | 16232 | 14282 | 324 | 324 | 2.00% | 2.27% | 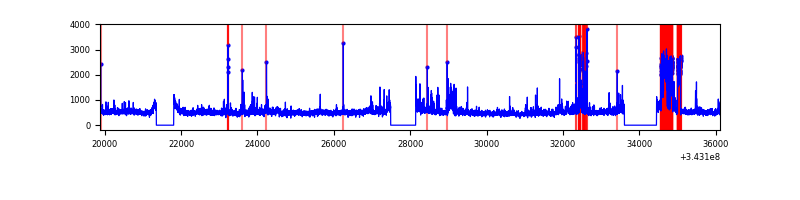 |
| D | 16231 | 14281 | 205 | 205 | 1.26% | 1.44% | 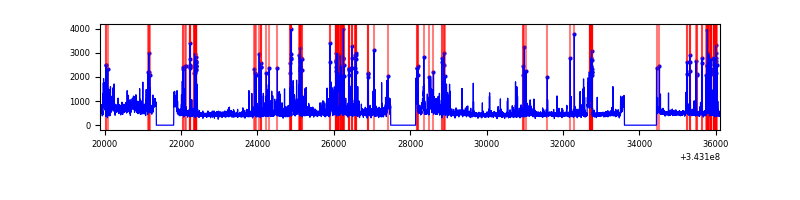 |
Top three noisy pixels from each quadrant. If the there are fewer than three noisy pixels in the level2.evt file, extra rows are filled as -1
| Pixel properties | Quadrant properties | ||||||
|---|---|---|---|---|---|---|---|
| Quadrant | DetID | PixID | Counts | Sigma | Mean | Median | Sigma |
| A | 14 | 235 | 26208 | 70.3 | 1748 | 1710 | 348.5 |
| A | 13 | 254 | 23373 | 62.16 | 1748 | 1710 | 348.5 |
| A | 3 | 137 | 17198 | 44.44 | 1748 | 1710 | 348.5 |
| B | 10 | 245 | 3005744 | 9484.05 | 1652 | 1607 | 316.8 |
| B | 3 | 64 | 1713375 | 5404.05 | 1652 | 1607 | 316.8 |
| B | 0 | 190 | 48373 | 147.64 | 1652 | 1607 | 316.8 |
| C | 3 | 233 | 1749398 | 4517.46 | 1655 | 1662 | 386.9 |
| C | 14 | 238 | 260700 | 669.55 | 1655 | 1662 | 386.9 |
| C | 10 | 22 | 27431 | 66.61 | 1655 | 1662 | 386.9 |
| D | 1 | 52 | 1901557 | 4726.06 | 1689 | 1643 | 402.0 |
| D | 2 | 250 | 172758 | 425.65 | 1689 | 1643 | 402.0 |
| D | 13 | 104 | 68007 | 165.08 | 1689 | 1643 | 402.0 |
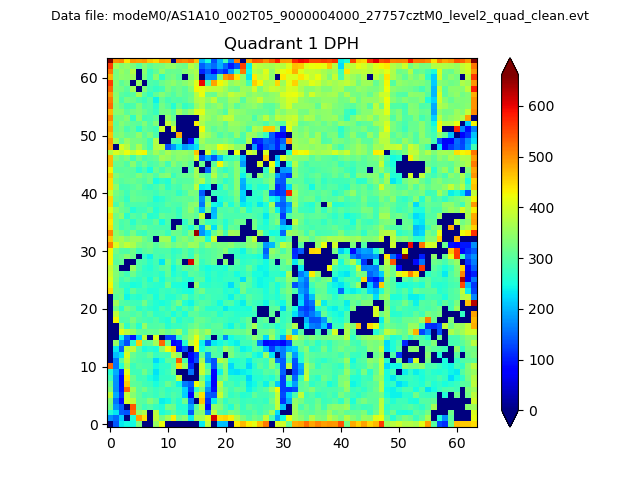
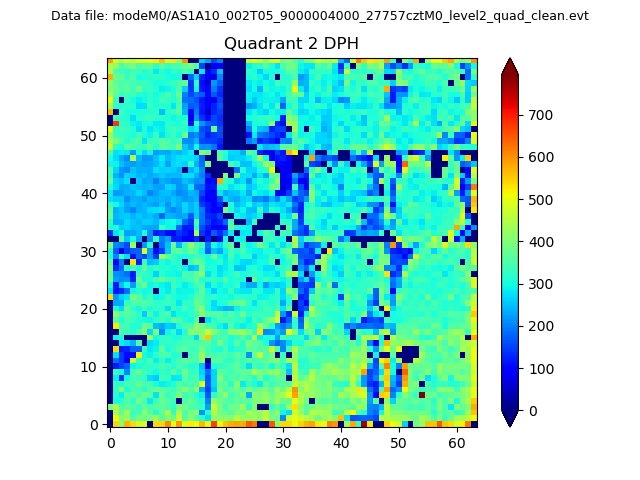
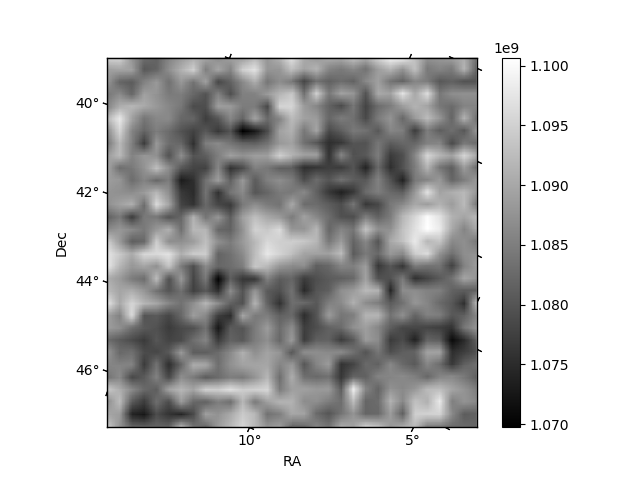
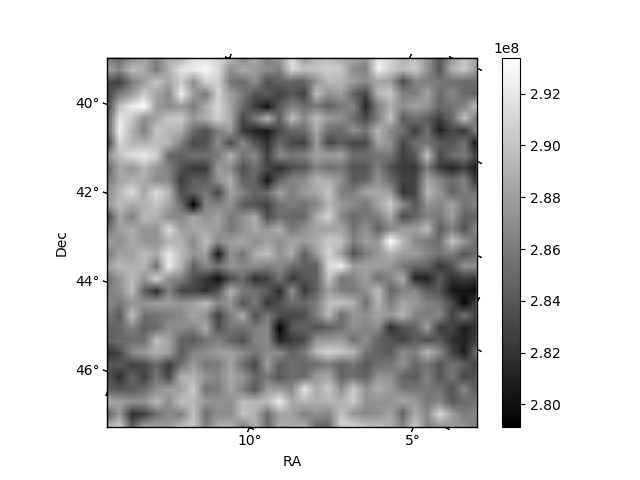
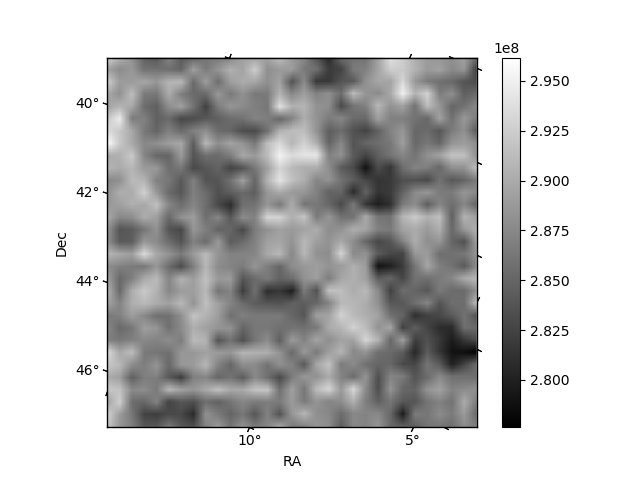
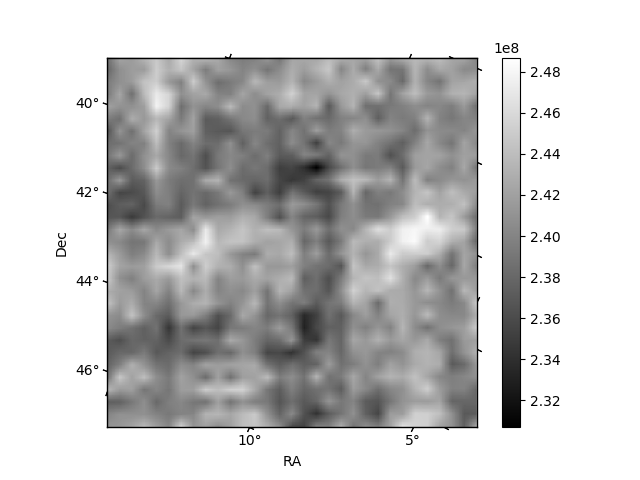
Histogram calculated using DETX and DETY for each event in the final _common_clean file
| Quadrant A |  |
 |
Quadrant B |
|---|---|---|---|
| Quadrant D | 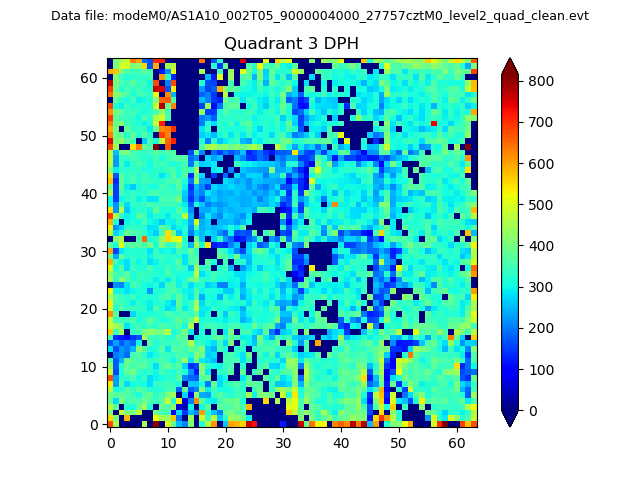 |
 |
Quadrant C |
| Plot type | Count rate plots | Images |
|---|---|---|
| Comparison with Poisson distribution Blue bars denote a histogram of data divided into 1 sec bins. Red curve is a Poisson curve with rate = median count rate of data. |
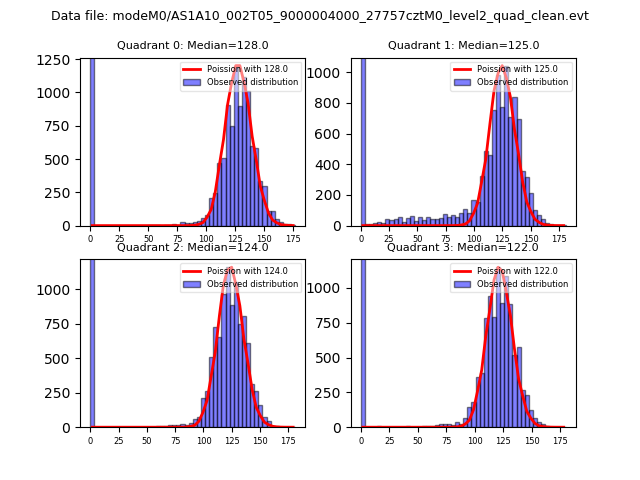 |
 |
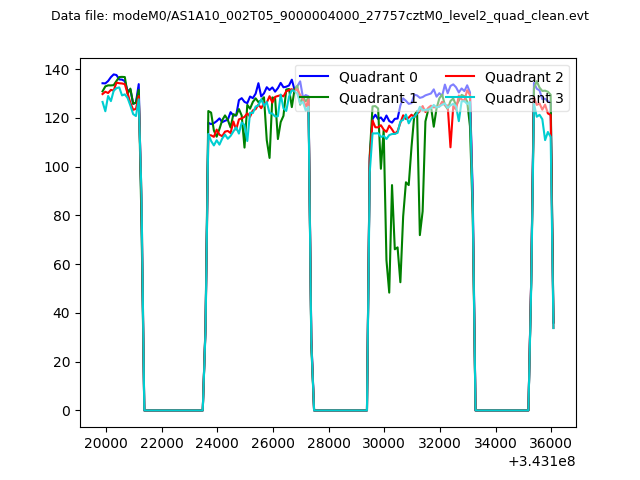
| Quadrant-wise count rates Data is divided into 100 sec bins |
 |
|
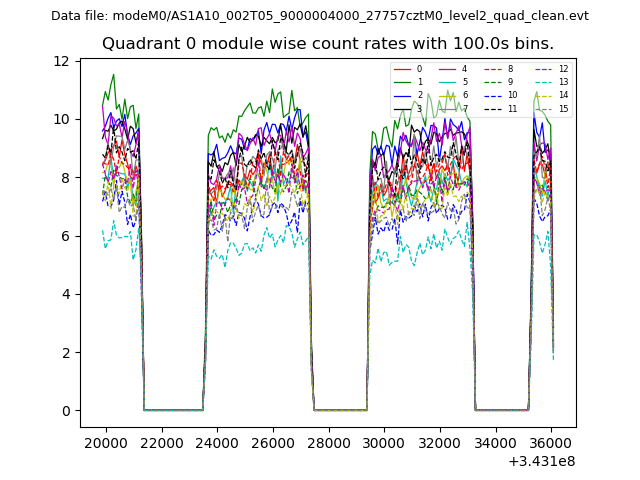
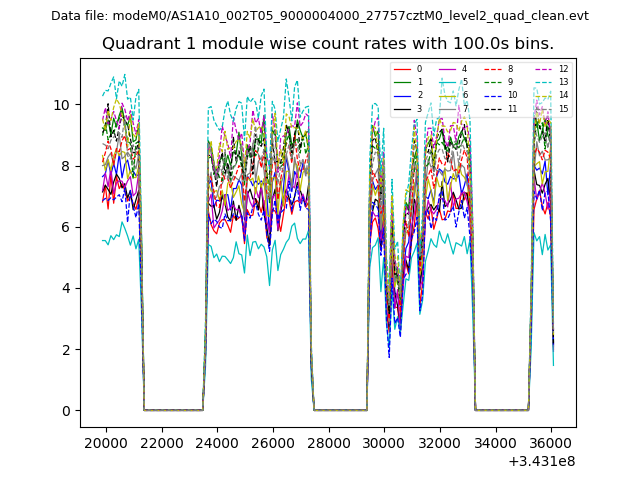
| Module-wise count rates for Quadrant A Data is divided into 100 sec bins |
 |
 |
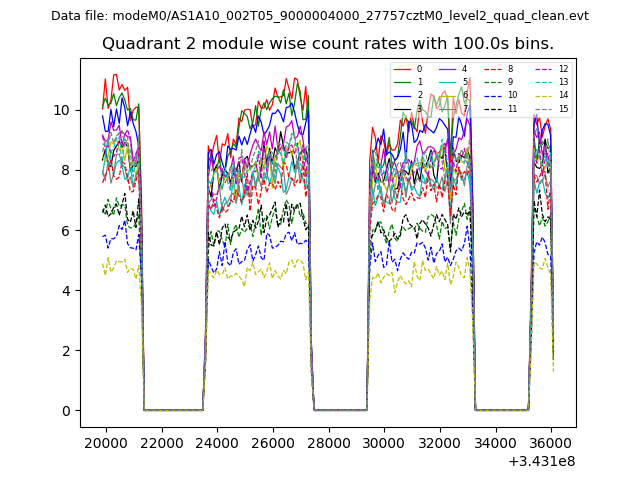
| Module-wise count rates for Quadrant B Data is divided into 100 sec bins |
 |
 |
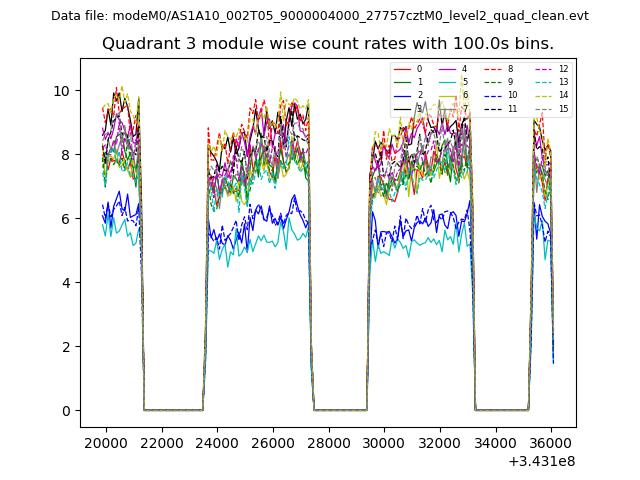
| Module-wise count rates for Quadrant C Data is divided into 100 sec bins |
 |
 |
| Module-wise count rates for Quadrant D Data is divided into 100 sec bins |
 |
 |
| Parameter | Plot |
|---|---|
| CZT HV Monitor | 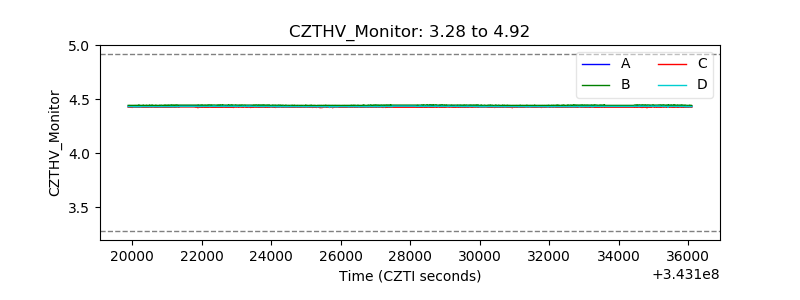 |
| D_VDD | 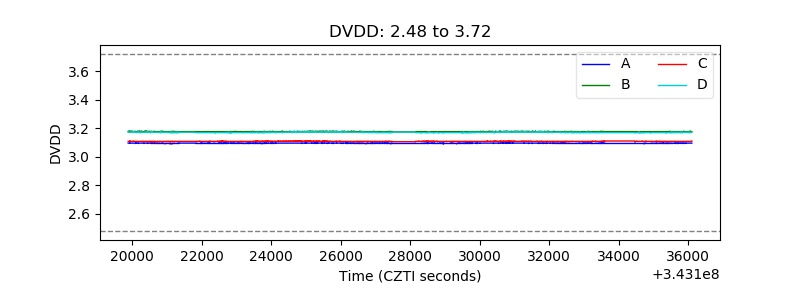 |
| Temperature 1 | 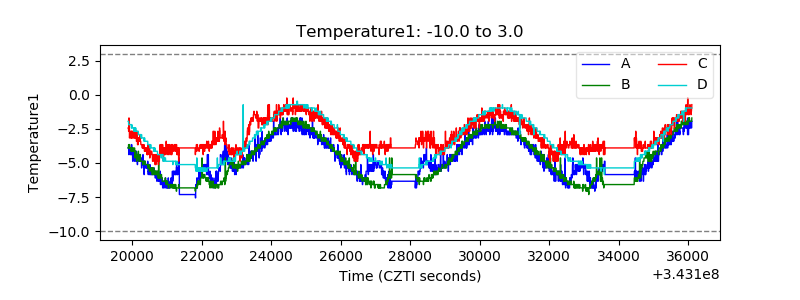 |
| Veto HV Monitor | 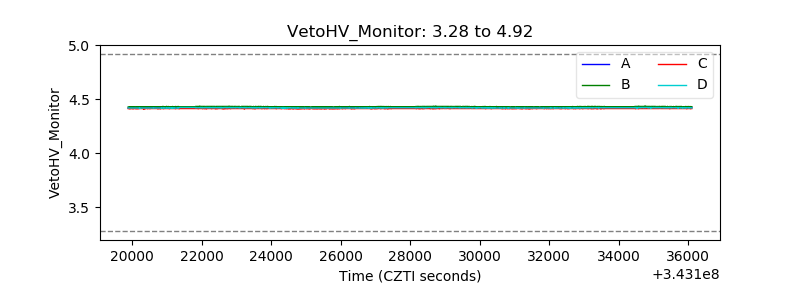 |
| Veto LLD | 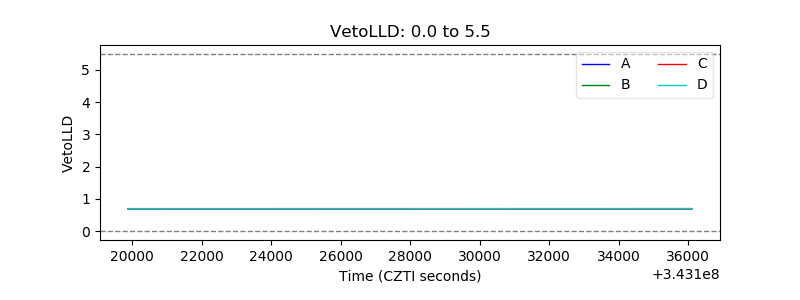 |
| Alpha Counter | 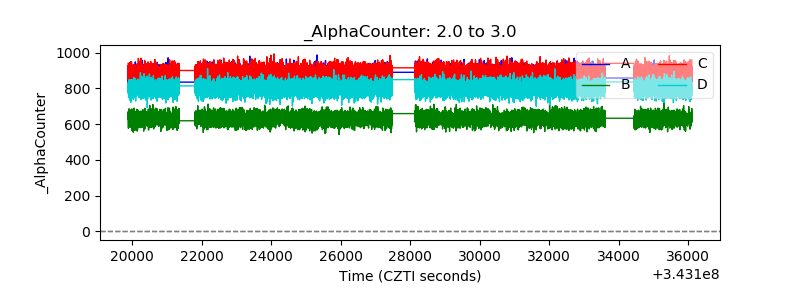 |
| _CPM_Rate | 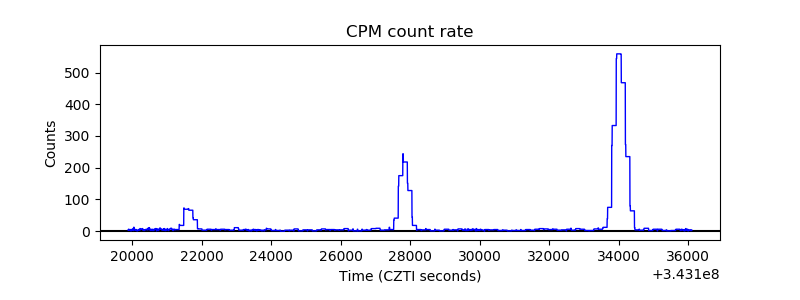 |
| CZT Counter |  |
| +2.5 Volts monitor |  |
| +5 Volts monitor |  |
| _ROLL_ROT | 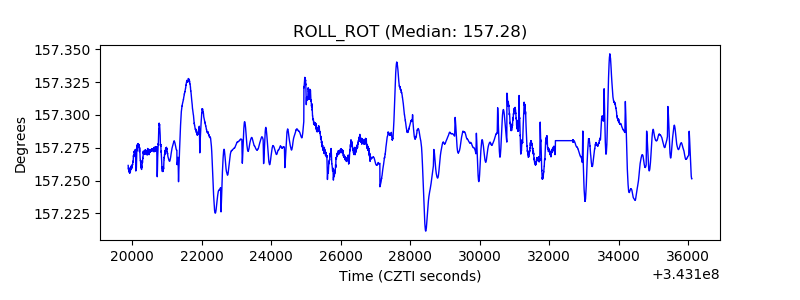 |
| _Roll_DEC | 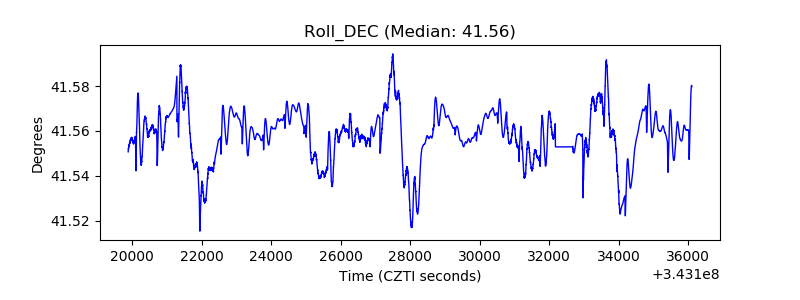 |
| _Roll_RA |  |
| Veto Counter |  |