| Param | Original file | Final file |
|---|---|---|
| Filename | modeM0/AS1A10_002T05_9000004000_27758cztM0_level2.evt | modeM0/AS1A10_002T05_9000004000_27758cztM0_level2_quad_clean.evt |
| Size (bytes) | 458,121,600 | 97,865,280 |
| Size | 436.9 MB | 93.3 MB |
| Events in quadrant A | 2,974,955 | 654,992 |
| Events in quadrant B | 3,776,157 | 642,343 |
| Events in quadrant C | 3,341,956 | 620,606 |
| Events in quadrant D | 3,362,600 | 615,725 |
| Mode M9 | |||
|---|---|---|---|
| Quadrant | BADHDUFLAG | Total packets | Discarded packets |
| A | 0 | 10 | 0 |
| B | 0 | 10 | 0 |
| C | 0 | 10 | 0 |
| D | 0 | 10 | 0 |
| Mode M0 | |||
|---|---|---|---|
| Quadrant | BADHDUFLAG | Total packets | Discarded packets |
| A | 0 | 12857 | 0 |
| B | 0 | 15109 | 0 |
| C | 0 | 13690 | 0 |
| D | 0 | 13995 | 0 |
| Quadrant | Total seconds | Saturated seconds | Saturation percentage |
|---|---|---|---|
| A | 6165 | 55 | 0.892133% |
| B | 6166 | 245 | 3.973403% |
| C | 6166 | 122 | 1.978592% |
| D | 6165 | 107 | 1.735604% |
Noise dominated data is calculated using 1-second bins in cleaned event files. If a bin has >2000 counts, and if more than 50% of those come from <1% of pixels, then it is considered to be noise-dominated and hence unusable.
| Quadrant | # 1 sec bins | Bins with >0 counts | Bins with >2000 counts | High rate bins dominated by noise | Noise dominated (total time) | Noise dominated (detector-on time) | Marked lightcurve |
|---|---|---|---|---|---|---|---|
| A | 7150 | 6165 | 0 | 0 | 0.00% | 0.00% |  |
| B | 7151 | 6166 | 115 | 115 | 1.61% | 1.87% |  |
| C | 7151 | 6166 | 19 | 19 | 0.27% | 0.31% |  |
| D | 7150 | 6165 | 69 | 69 | 0.97% | 1.12% |  |
Top three noisy pixels from each quadrant. If the there are fewer than three noisy pixels in the level2.evt file, extra rows are filled as -1
| Pixel properties | Quadrant properties | ||||||
|---|---|---|---|---|---|---|---|
| Quadrant | DetID | PixID | Counts | Sigma | Mean | Median | Sigma |
| A | 13 | 254 | 10841 | 65.58 | 770 | 753 | 153.8 |
| A | 3 | 137 | 7270 | 42.37 | 770 | 753 | 153.8 |
| A | 0 | 226 | 6693 | 38.61 | 770 | 753 | 153.8 |
| B | 3 | 64 | 783909 | 5545.07 | 746 | 728 | 141.2 |
| B | 0 | 190 | 21905 | 149.94 | 746 | 728 | 141.2 |
| B | 12 | 111 | 17397 | 118.02 | 746 | 728 | 141.2 |
| C | 3 | 233 | 383775 | 2258.91 | 729 | 734 | 169.6 |
| C | 14 | 238 | 116551 | 683.01 | 729 | 734 | 169.6 |
| C | 13 | 61 | 4872 | 24.4 | 729 | 734 | 169.6 |
| D | 1 | 52 | 352477 | 1997.27 | 743 | 725 | 176.1 |
| D | 2 | 250 | 102012 | 575.11 | 743 | 725 | 176.1 |
| D | 13 | 104 | 87840 | 494.65 | 743 | 725 | 176.1 |
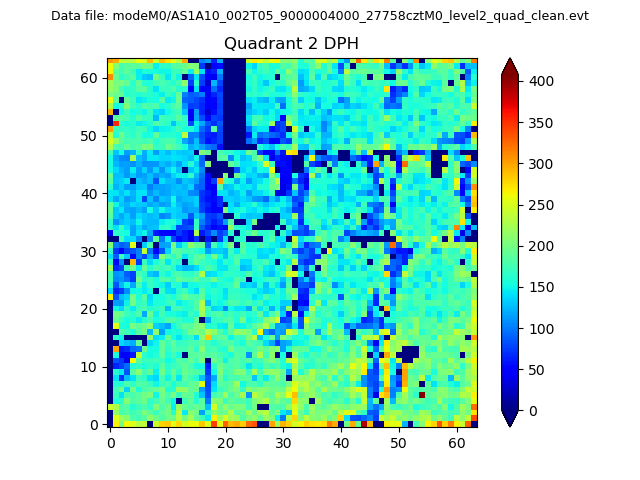
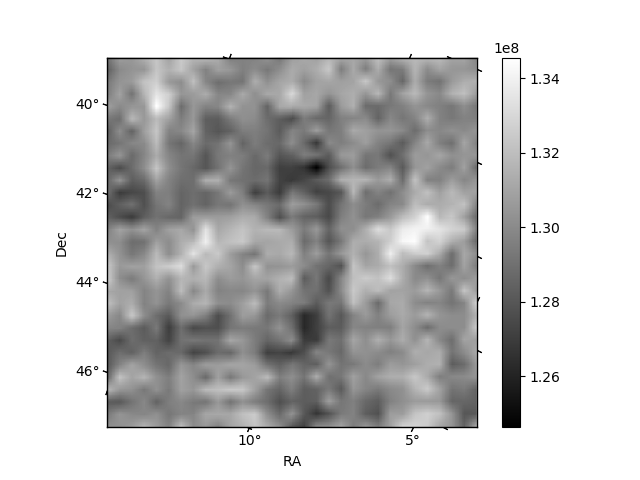
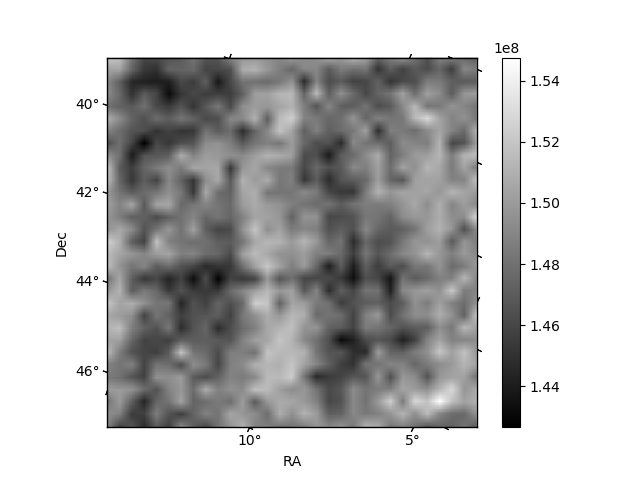
Histogram calculated using DETX and DETY for each event in the final _common_clean file
| Quadrant A | 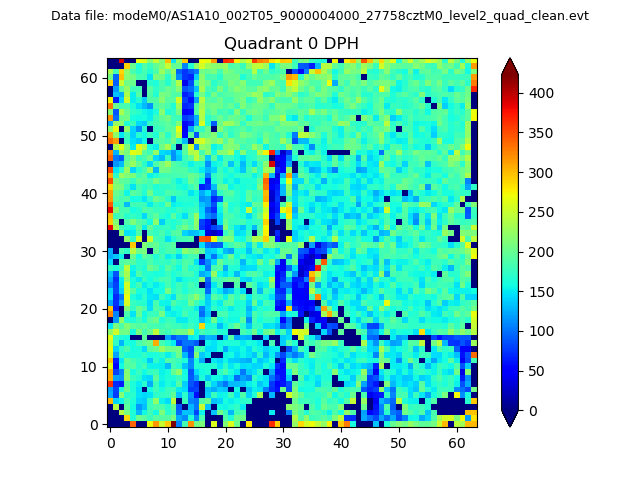 |
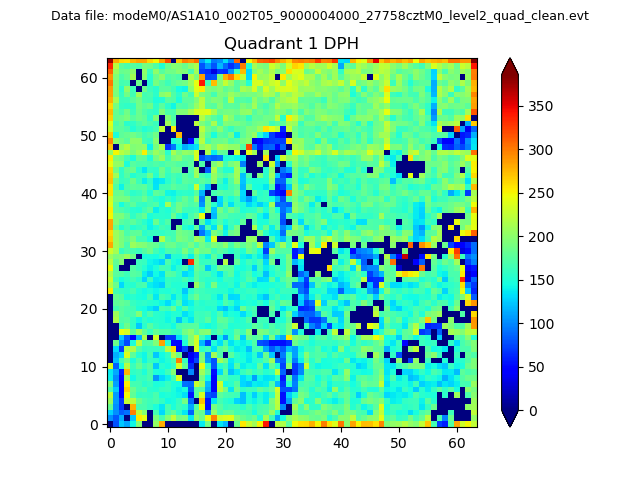 |
Quadrant B |
|---|---|---|---|
| Quadrant D | 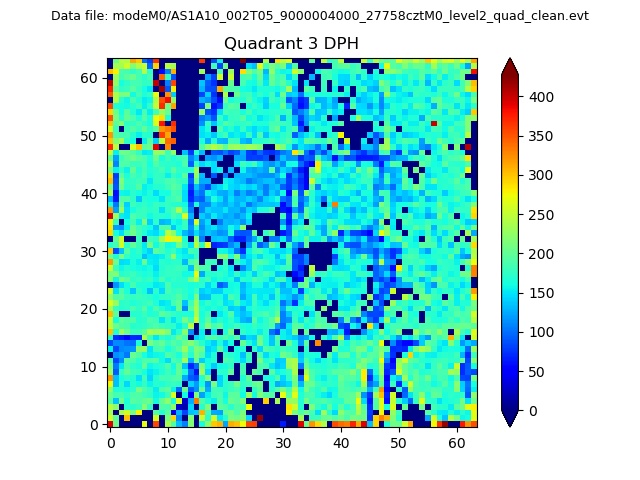 |
 |
Quadrant C |
| Plot type | Count rate plots | Images |
|---|---|---|
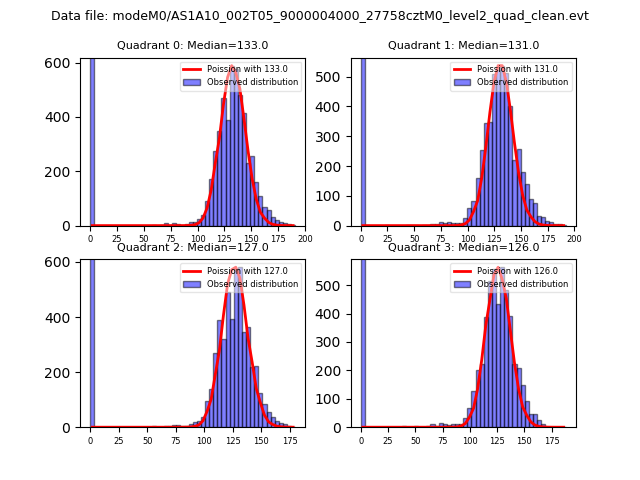
| Comparison with Poisson distribution Blue bars denote a histogram of data divided into 1 sec bins. Red curve is a Poisson curve with rate = median count rate of data. |
 |
 |
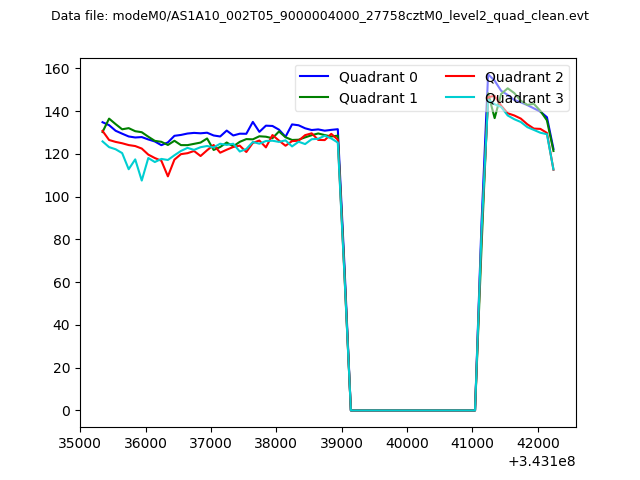
| Quadrant-wise count rates Data is divided into 100 sec bins |
 |
|
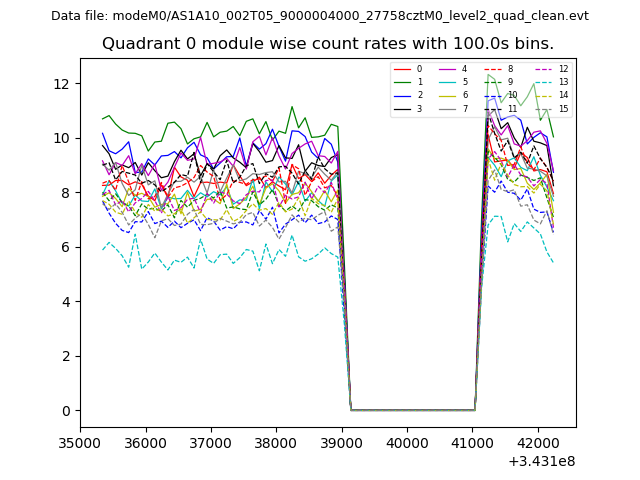
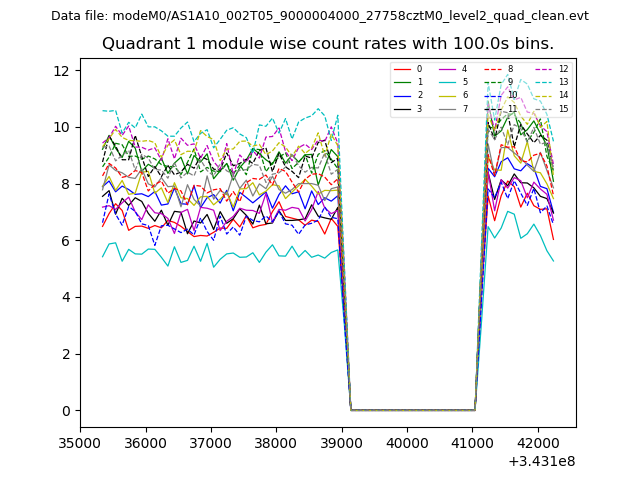
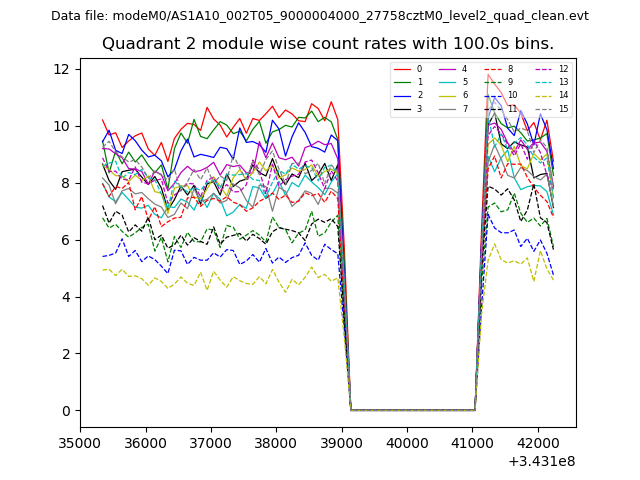
| Module-wise count rates for Quadrant A Data is divided into 100 sec bins |
 |
 |
| Module-wise count rates for Quadrant B Data is divided into 100 sec bins |
 |
 |
| Module-wise count rates for Quadrant C Data is divided into 100 sec bins |
 |
 |
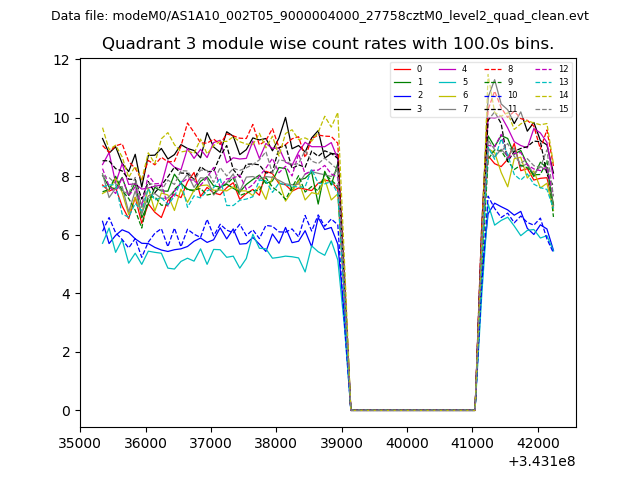
| Module-wise count rates for Quadrant D Data is divided into 100 sec bins |
 |
 |
| Parameter | Plot |
|---|---|
| CZT HV Monitor | 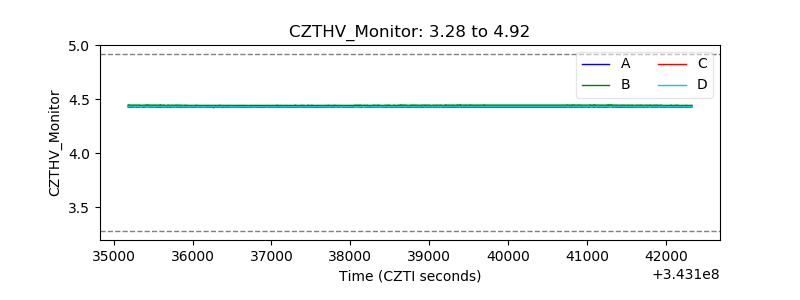 |
| D_VDD | 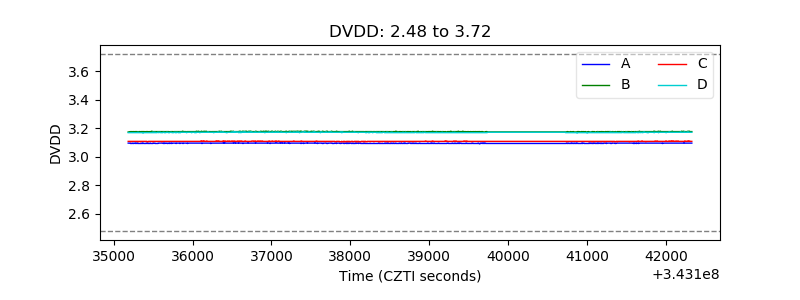 |
| Temperature 1 | 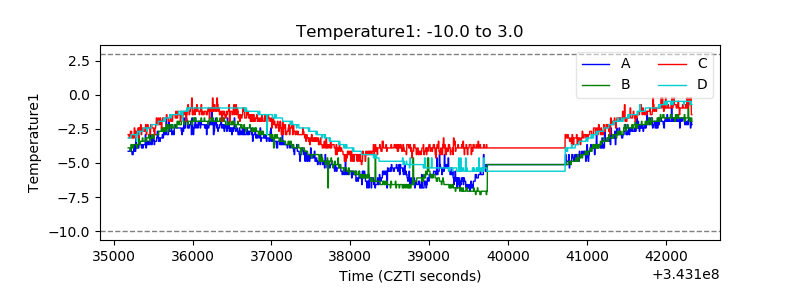 |
| Veto HV Monitor | 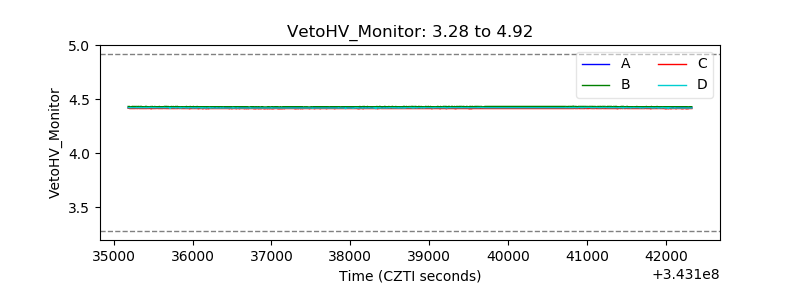 |
| Veto LLD | 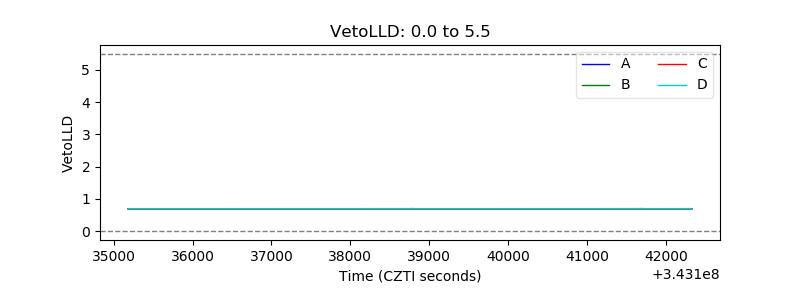 |
| Alpha Counter | 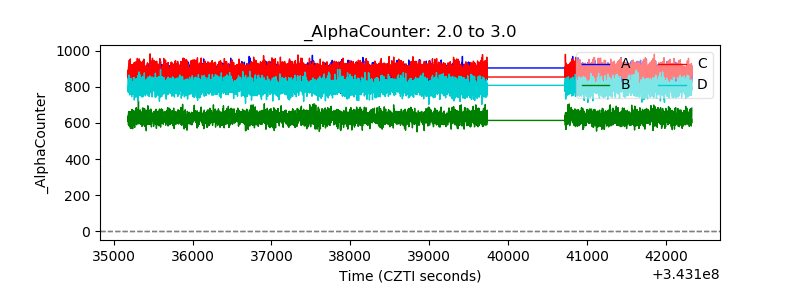 |
| _CPM_Rate | 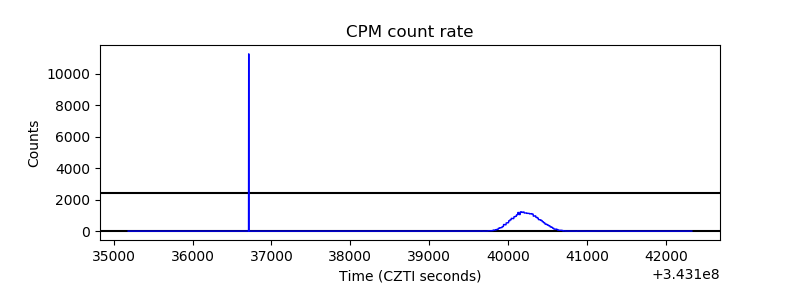 |
| CZT Counter |  |
| +2.5 Volts monitor |  |
| +5 Volts monitor |  |
| _ROLL_ROT |  |
| _Roll_DEC |  |
| _Roll_RA |  |
| Veto Counter | 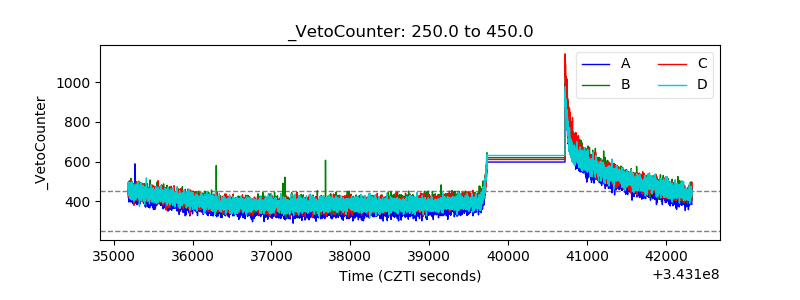 |