| Param | Original file | Final file |
|---|---|---|
| Filename | modeM0/AS1A10_002T05_9000004000_27760cztM0_level2.evt | modeM0/AS1A10_002T05_9000004000_27760cztM0_level2_quad_clean.evt |
| Size (bytes) | 450,529,920 | 108,794,880 |
| Size | 429.7 MB | 103.8 MB |
| Events in quadrant A | 3,017,803 | 744,788 |
| Events in quadrant B | 3,288,594 | 731,316 |
| Events in quadrant C | 3,401,019 | 700,669 |
| Events in quadrant D | 3,526,156 | 695,772 |
| Mode M9 | |||
|---|---|---|---|
| Quadrant | BADHDUFLAG | Total packets | Discarded packets |
| A | 0 | 11 | 0 |
| B | 0 | 11 | 0 |
| C | 0 | 11 | 0 |
| D | 0 | 11 | 0 |
| Mode M0 | |||
|---|---|---|---|
| Quadrant | BADHDUFLAG | Total packets | Discarded packets |
| A | 0 | 12883 | 0 |
| B | 0 | 13722 | 0 |
| C | 0 | 13842 | 0 |
| D | 0 | 14442 | 0 |
| Quadrant | Total seconds | Saturated seconds | Saturation percentage |
|---|---|---|---|
| A | 6052 | 69 | 1.140119% |
| B | 6053 | 119 | 1.965967% |
| C | 6053 | 101 | 1.668594% |
| D | 6053 | 99 | 1.635553% |
Noise dominated data is calculated using 1-second bins in cleaned event files. If a bin has >2000 counts, and if more than 50% of those come from <1% of pixels, then it is considered to be noise-dominated and hence unusable.
| Quadrant | # 1 sec bins | Bins with >0 counts | Bins with >2000 counts | High rate bins dominated by noise | Noise dominated (total time) | Noise dominated (detector-on time) | Marked lightcurve |
|---|---|---|---|---|---|---|---|
| A | 7162 | 6052 | 2 | 2 | 0.03% | 0.03% | 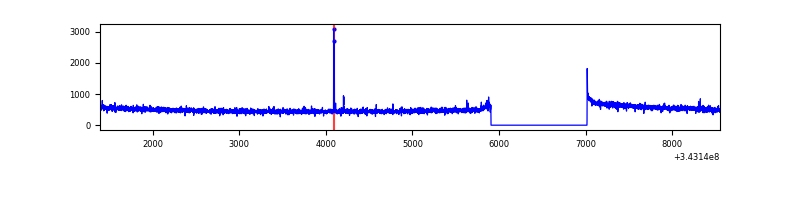 |
| B | 7163 | 6053 | 42 | 42 | 0.59% | 0.69% | 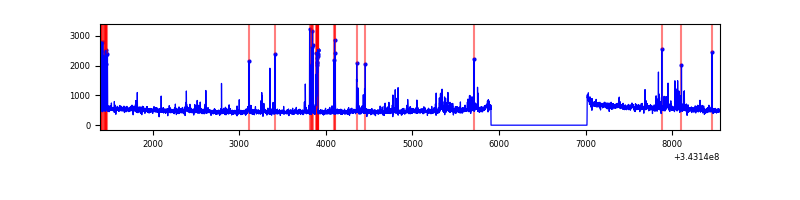 |
| C | 7163 | 6053 | 2 | 2 | 0.03% | 0.03% | 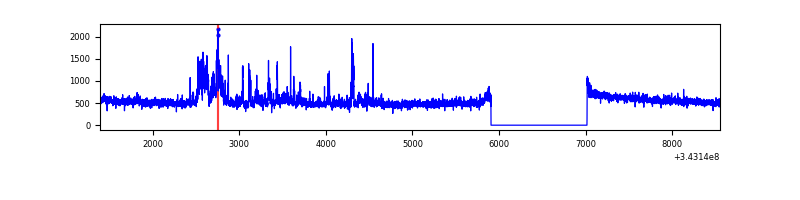 |
| D | 7163 | 6053 | 54 | 54 | 0.75% | 0.89% | 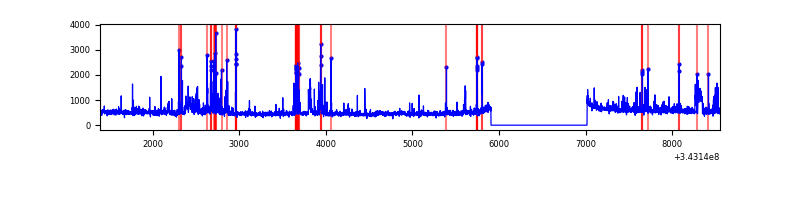 |
Top three noisy pixels from each quadrant. If the there are fewer than three noisy pixels in the level2.evt file, extra rows are filled as -1
| Pixel properties | Quadrant properties | ||||||
|---|---|---|---|---|---|---|---|
| Quadrant | DetID | PixID | Counts | Sigma | Mean | Median | Sigma |
| A | 6 | 16 | 10217 | 61.02 | 777 | 764 | 154.9 |
| A | 13 | 254 | 10205 | 60.94 | 777 | 764 | 154.9 |
| A | 3 | 137 | 7005 | 40.29 | 777 | 764 | 154.9 |
| B | 3 | 64 | 201707 | 1405.76 | 757 | 740 | 143.0 |
| B | 10 | 245 | 77165 | 534.59 | 757 | 740 | 143.0 |
| B | 4 | 200 | 22124 | 149.58 | 757 | 740 | 143.0 |
| C | 3 | 233 | 396455 | 2299.35 | 738 | 744 | 172.1 |
| C | 14 | 238 | 119483 | 689.95 | 738 | 744 | 172.1 |
| C | 13 | 61 | 5091 | 25.26 | 738 | 744 | 172.1 |
| D | 1 | 52 | 341904 | 1928.77 | 752 | 734 | 176.9 |
| D | 13 | 104 | 149924 | 843.43 | 752 | 734 | 176.9 |
| D | 2 | 250 | 78536 | 439.85 | 752 | 734 | 176.9 |
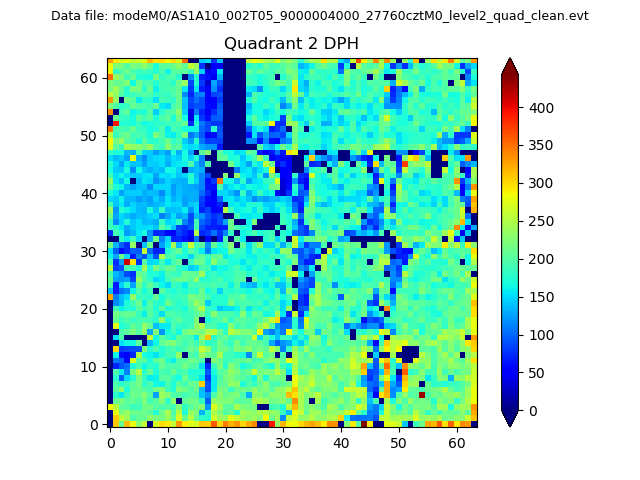
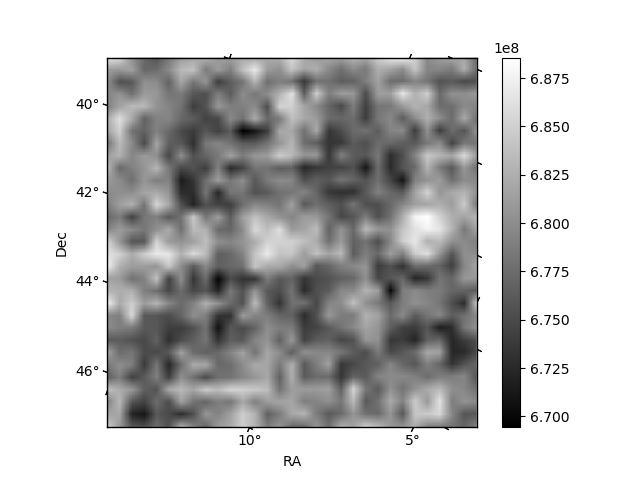
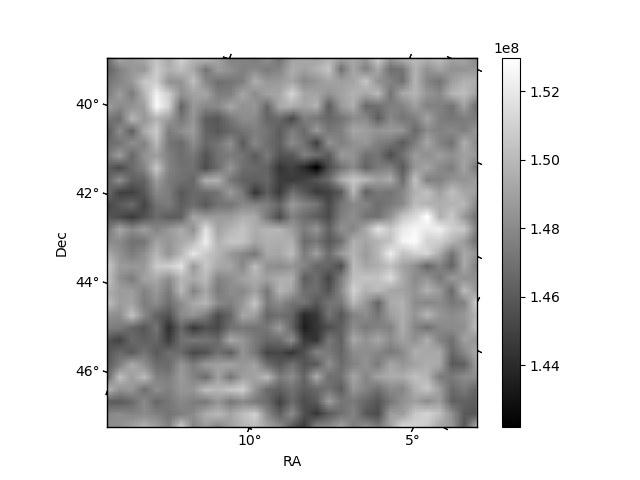
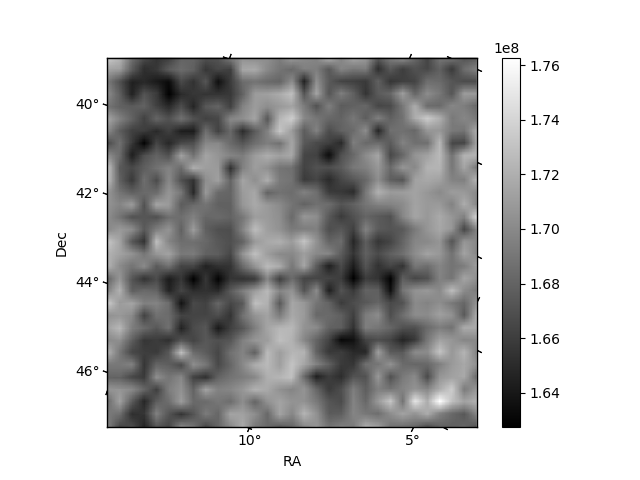
Histogram calculated using DETX and DETY for each event in the final _common_clean file
| Quadrant A | 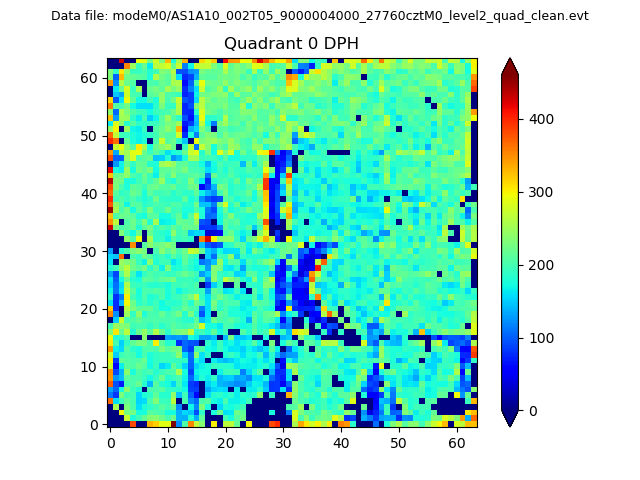 |
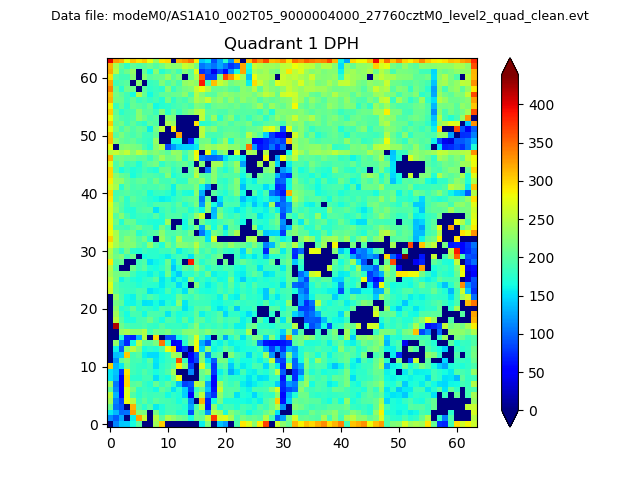 |
Quadrant B |
|---|---|---|---|
| Quadrant D | 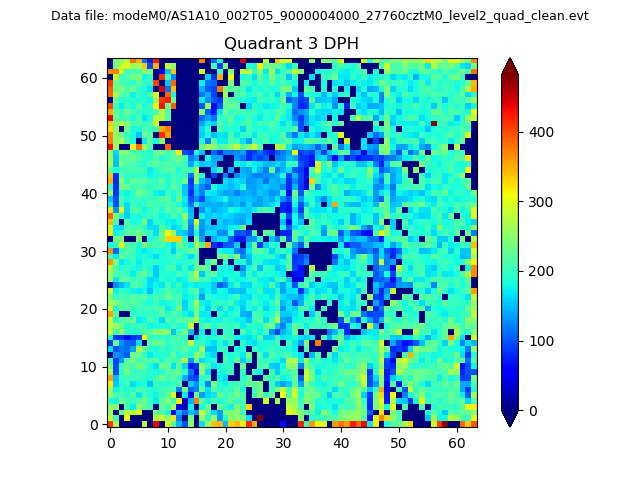 |
 |
Quadrant C |
| Plot type | Count rate plots | Images |
|---|---|---|
| Comparison with Poisson distribution Blue bars denote a histogram of data divided into 1 sec bins. Red curve is a Poisson curve with rate = median count rate of data. |
 |
 |
| Quadrant-wise count rates Data is divided into 100 sec bins |
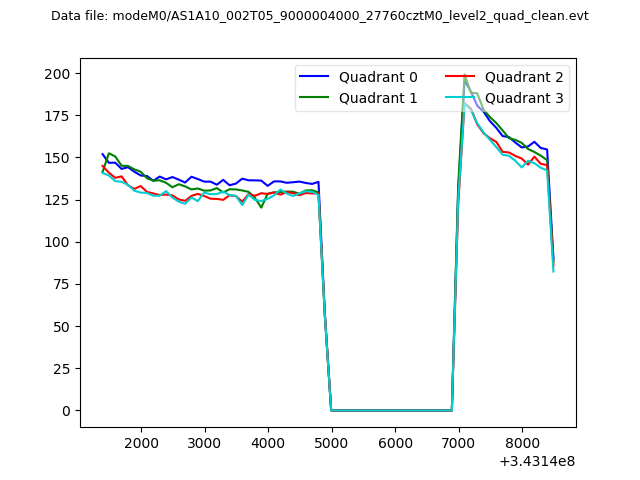 |
|
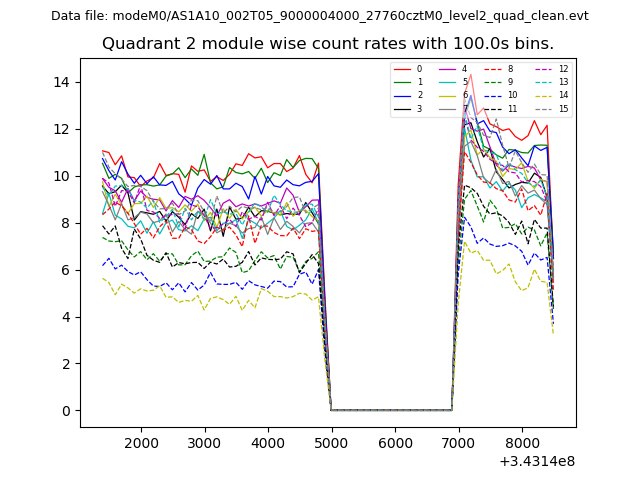
| Module-wise count rates for Quadrant A Data is divided into 100 sec bins |
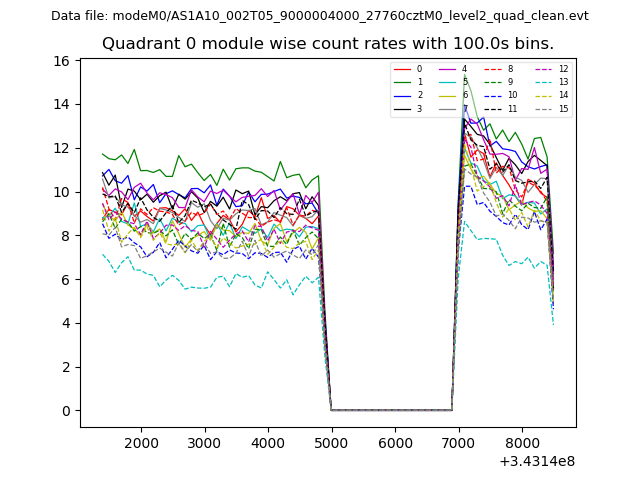 |
 |
| Module-wise count rates for Quadrant B Data is divided into 100 sec bins |
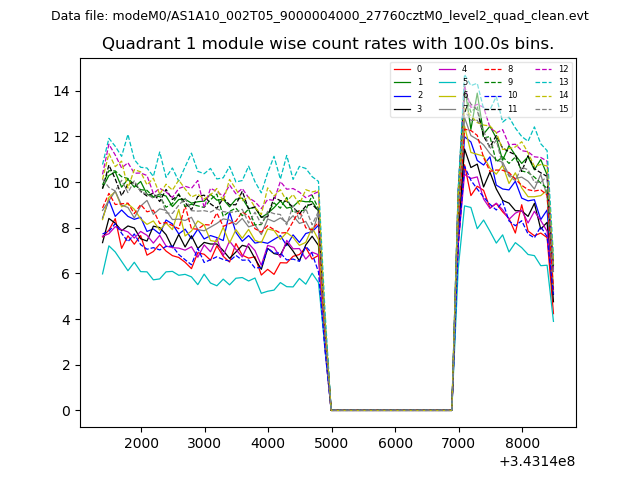 |
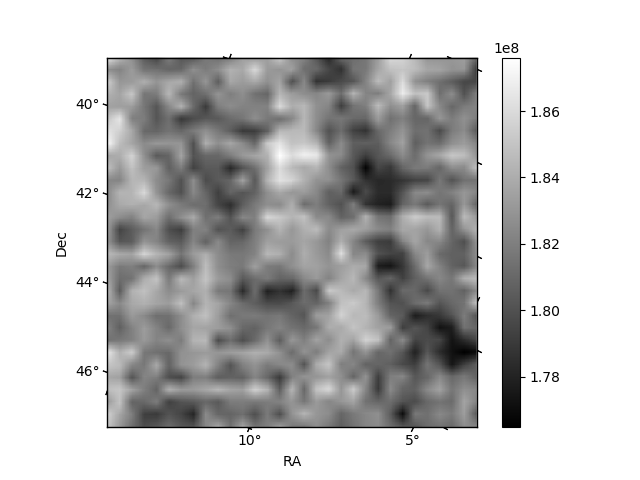 |
| Module-wise count rates for Quadrant C Data is divided into 100 sec bins |
 |
 |
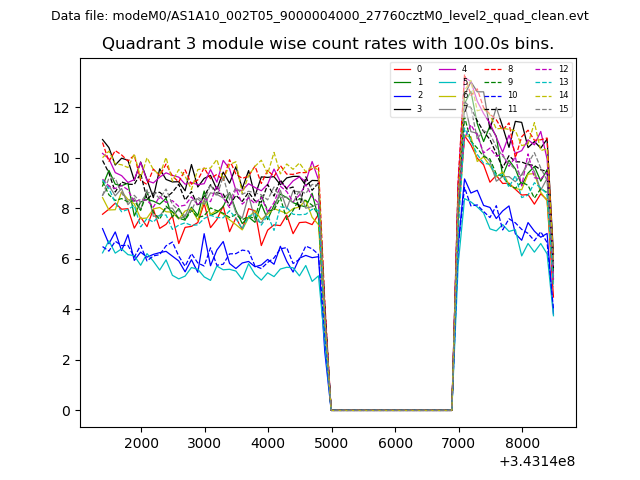
| Module-wise count rates for Quadrant D Data is divided into 100 sec bins |
 |
 |
| Parameter | Plot |
|---|---|
| CZT HV Monitor | 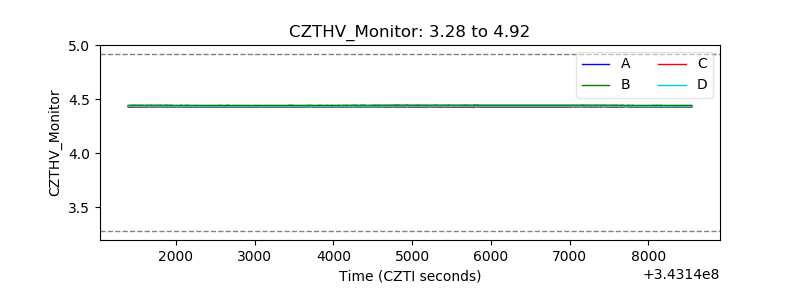 |
| D_VDD | 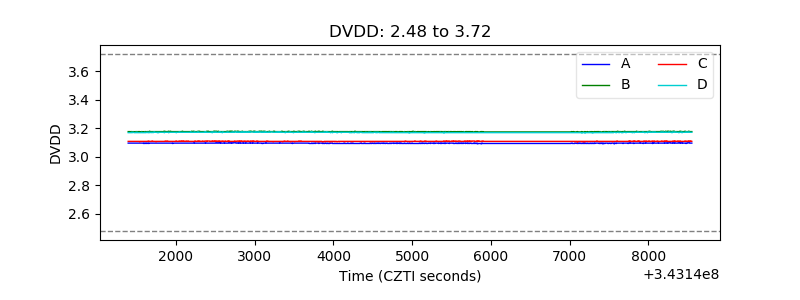 |
| Temperature 1 | 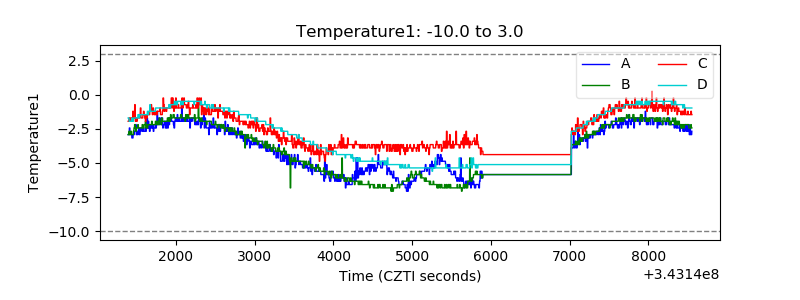 |
| Veto HV Monitor | 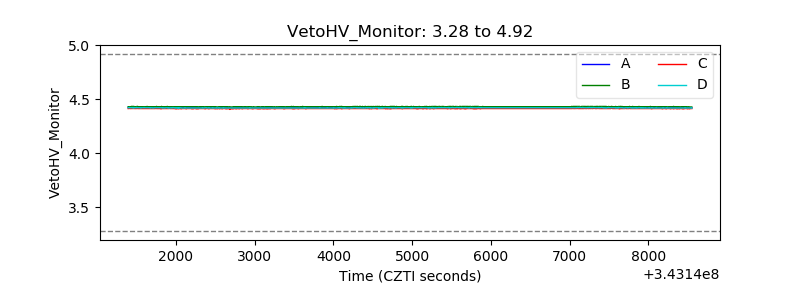 |
| Veto LLD | 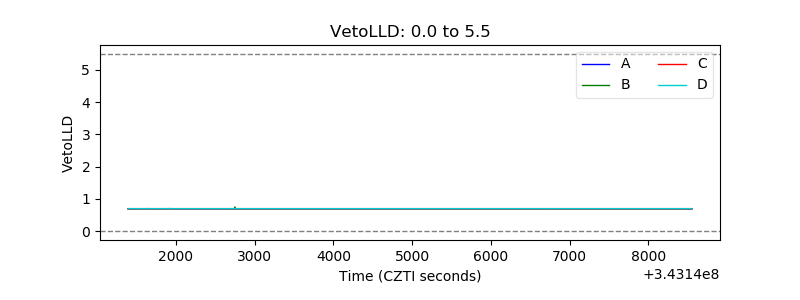 |
| Alpha Counter | 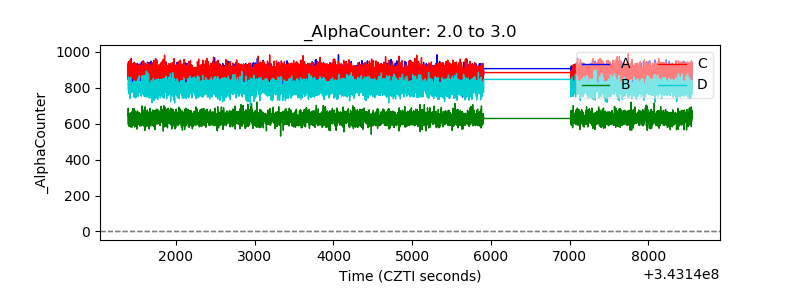 |
| _CPM_Rate |  |
| CZT Counter | 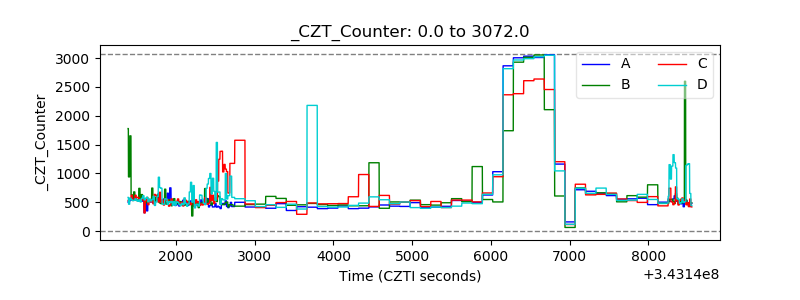 |
| +2.5 Volts monitor |  |
| +5 Volts monitor |  |
| _ROLL_ROT | 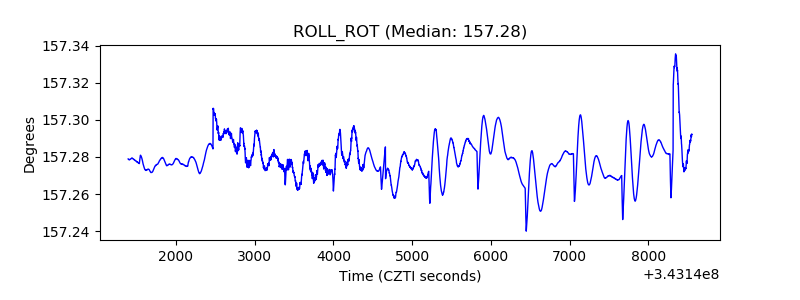 |
| _Roll_DEC | 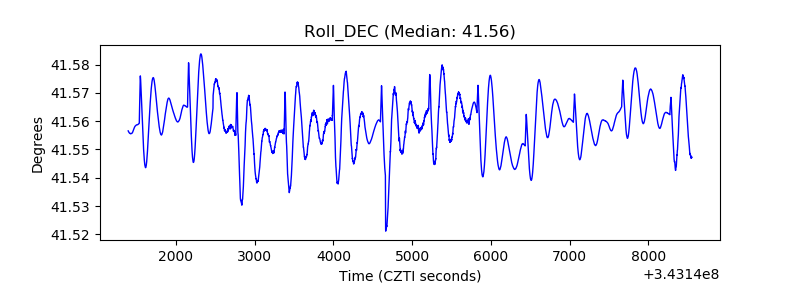 |
| _Roll_RA | 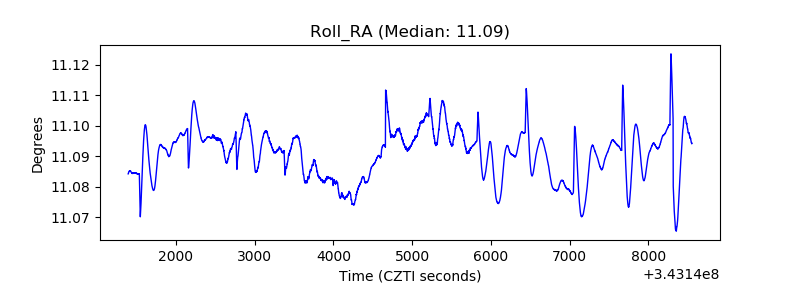 |
| Veto Counter | 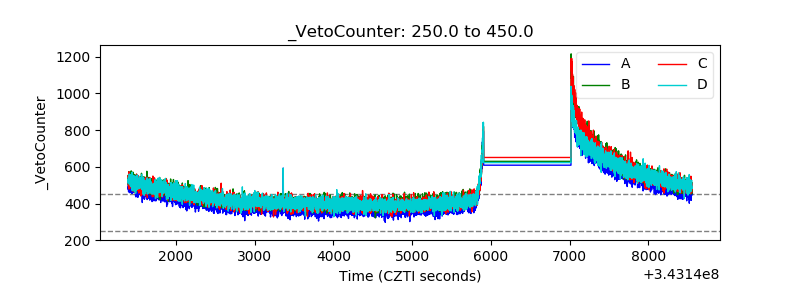 |