| Param | Original file | Final file |
|---|---|---|
| Filename | modeM0/AS1A10_002T05_9000004000_27761cztM0_level2.evt | modeM0/AS1A10_002T05_9000004000_27761cztM0_level2_quad_clean.evt |
| Size (bytes) | 532,722,240 | 120,337,920 |
| Size | 508.0 MB | 114.8 MB |
| Events in quadrant A | 3,403,930 | 833,670 |
| Events in quadrant B | 4,934,348 | 790,998 |
| Events in quadrant C | 3,498,625 | 787,320 |
| Events in quadrant D | 3,857,788 | 781,351 |
| Mode M9 | |||
|---|---|---|---|
| Quadrant | BADHDUFLAG | Total packets | Discarded packets |
| A | 0 | 16 | 0 |
| B | 0 | 17 | 0 |
| C | 0 | 17 | 0 |
| D | 0 | 17 | 0 |
| Mode M0 | |||
|---|---|---|---|
| Quadrant | BADHDUFLAG | Total packets | Discarded packets |
| A | 0 | 14345 | 0 |
| B | 0 | 18993 | 0 |
| C | 0 | 14654 | 0 |
| D | 0 | 15817 | 0 |
| Quadrant | Total seconds | Saturated seconds | Saturation percentage |
|---|---|---|---|
| A | 6476 | 60 | 0.926498% |
| B | 6476 | 587 | 9.064237% |
| C | 6476 | 120 | 1.852996% |
| D | 6475 | 78 | 1.204633% |
Noise dominated data is calculated using 1-second bins in cleaned event files. If a bin has >2000 counts, and if more than 50% of those come from <1% of pixels, then it is considered to be noise-dominated and hence unusable.
| Quadrant | # 1 sec bins | Bins with >0 counts | Bins with >2000 counts | High rate bins dominated by noise | Noise dominated (total time) | Noise dominated (detector-on time) | Marked lightcurve |
|---|---|---|---|---|---|---|---|
| A | 7701 | 6476 | 0 | 0 | 0.00% | 0.00% | 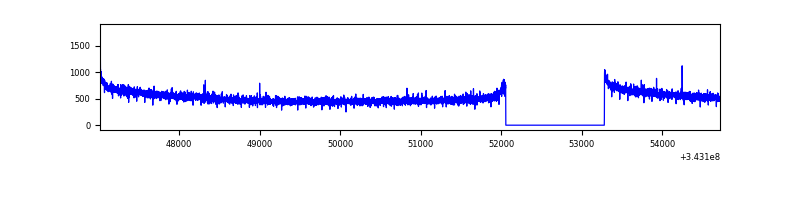 |
| B | 7701 | 6476 | 346 | 346 | 4.49% | 5.34% | 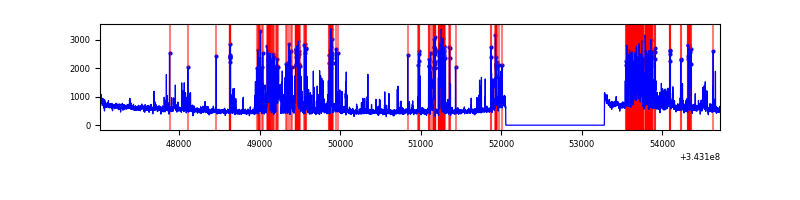 |
| C | 7701 | 6476 | 1 | 1 | 0.01% | 0.02% | 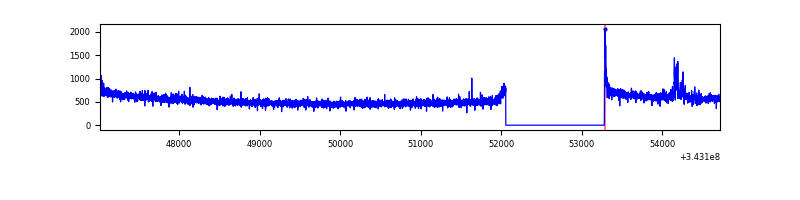 |
| D | 7700 | 6475 | 32 | 32 | 0.42% | 0.49% | 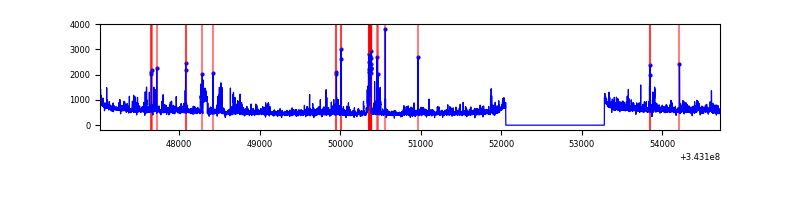 |
Top three noisy pixels from each quadrant. If the there are fewer than three noisy pixels in the level2.evt file, extra rows are filled as -1
| Pixel properties | Quadrant properties | ||||||
|---|---|---|---|---|---|---|---|
| Quadrant | DetID | PixID | Counts | Sigma | Mean | Median | Sigma |
| A | 13 | 254 | 10278 | 54.08 | 881 | 868 | 174.0 |
| A | 3 | 137 | 7741 | 39.5 | 881 | 868 | 174.0 |
| A | 0 | 226 | 7521 | 38.24 | 881 | 868 | 174.0 |
| B | 3 | 64 | 1388751 | 9055.29 | 828 | 809 | 153.3 |
| B | 10 | 245 | 237945 | 1547.14 | 828 | 809 | 153.3 |
| B | 4 | 52 | 30652 | 194.7 | 828 | 809 | 153.3 |
| C | 14 | 238 | 137720 | 710.71 | 835 | 840 | 192.6 |
| C | 3 | 233 | 94180 | 484.64 | 835 | 840 | 192.6 |
| C | 0 | 207 | 8095 | 37.67 | 835 | 840 | 192.6 |
| D | 1 | 52 | 409378 | 2018.7 | 855 | 833 | 202.4 |
| D | 7 | 69 | 83587 | 408.9 | 855 | 833 | 202.4 |
| D | 13 | 104 | 52487 | 255.23 | 855 | 833 | 202.4 |
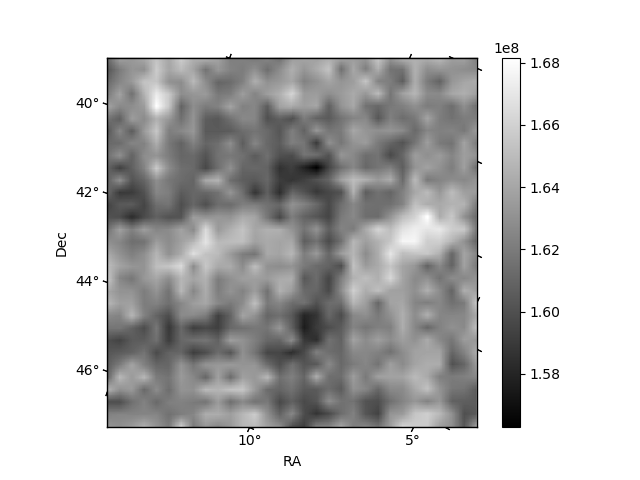
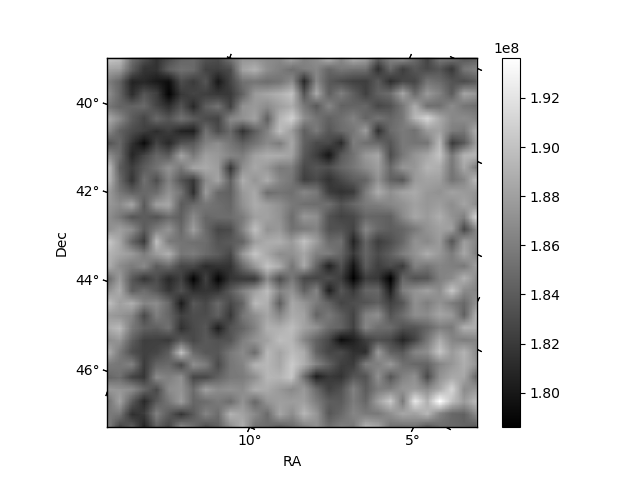
Histogram calculated using DETX and DETY for each event in the final _common_clean file
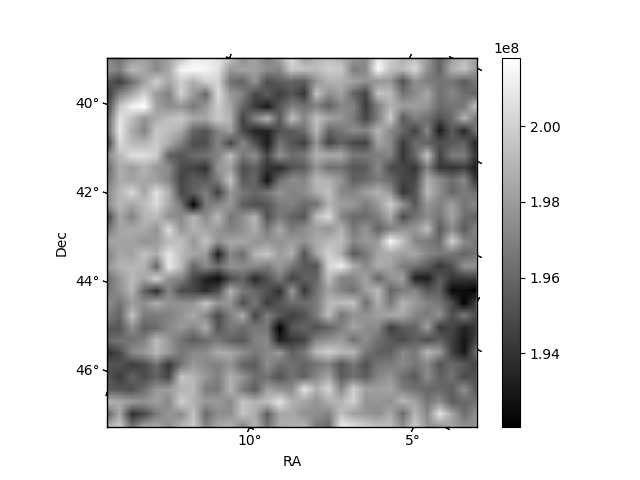
| Quadrant A |  |
 |
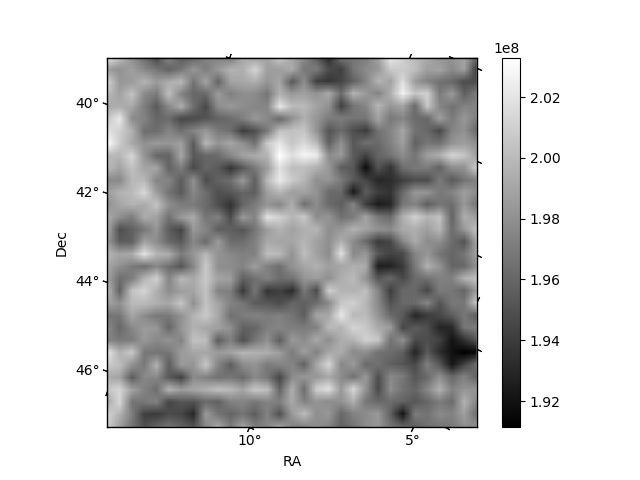
Quadrant B |
|---|---|---|---|
| Quadrant D | 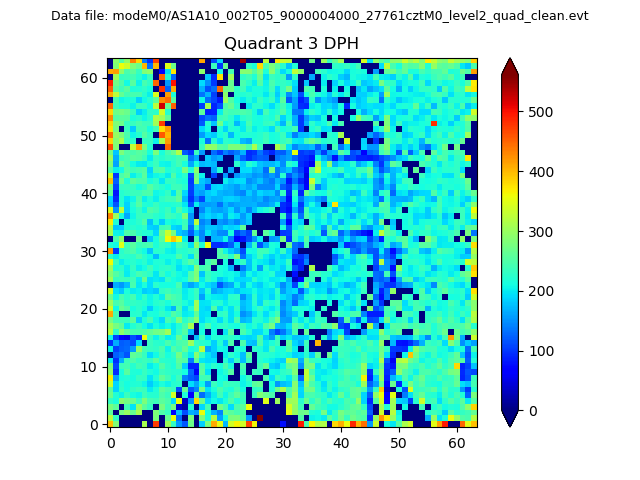 |
 |
Quadrant C |
| Plot type | Count rate plots | Images |
|---|---|---|
| Comparison with Poisson distribution Blue bars denote a histogram of data divided into 1 sec bins. Red curve is a Poisson curve with rate = median count rate of data. |
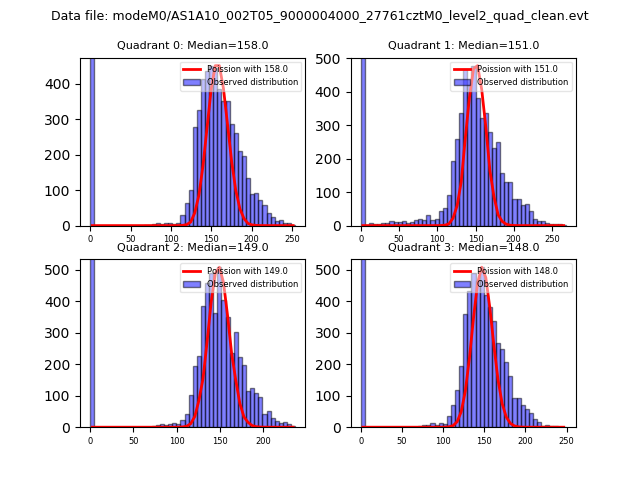 |
 |
| Quadrant-wise count rates Data is divided into 100 sec bins |
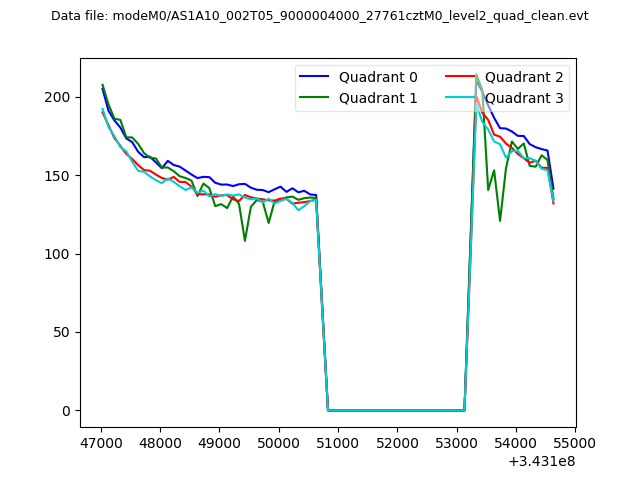 |
|
| Module-wise count rates for Quadrant A Data is divided into 100 sec bins |
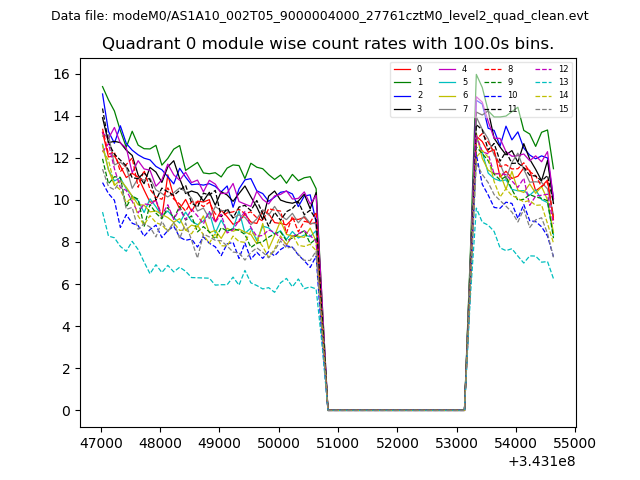 |
 |
| Module-wise count rates for Quadrant B Data is divided into 100 sec bins |
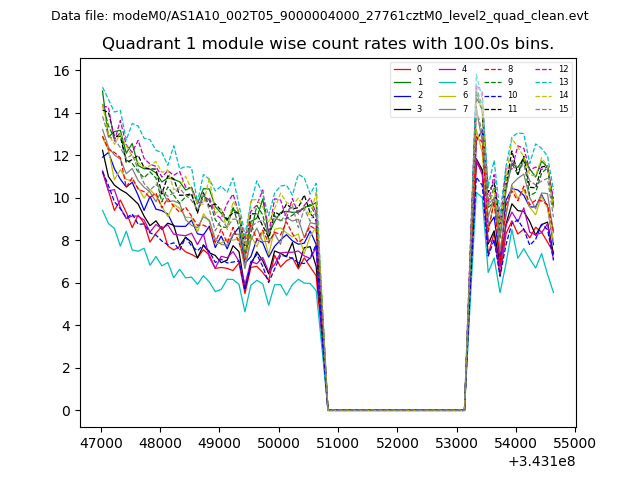 |
 |
| Module-wise count rates for Quadrant C Data is divided into 100 sec bins |
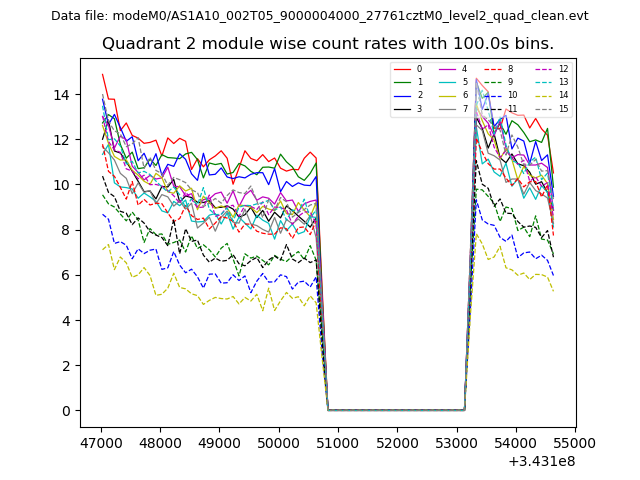 |
 |
| Module-wise count rates for Quadrant D Data is divided into 100 sec bins |
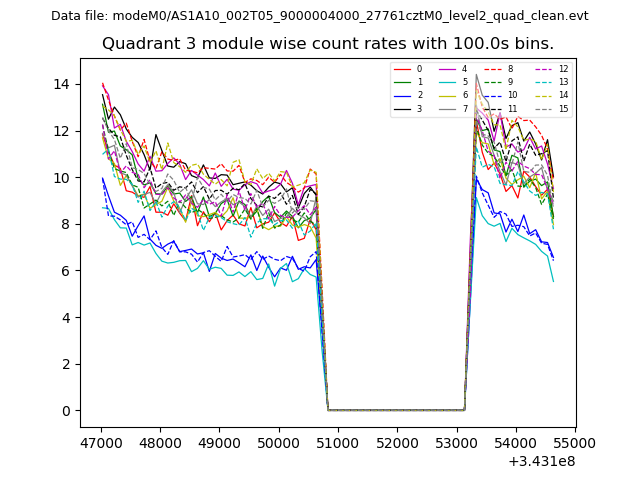 |
 |
| Parameter | Plot |
|---|---|
| CZT HV Monitor | 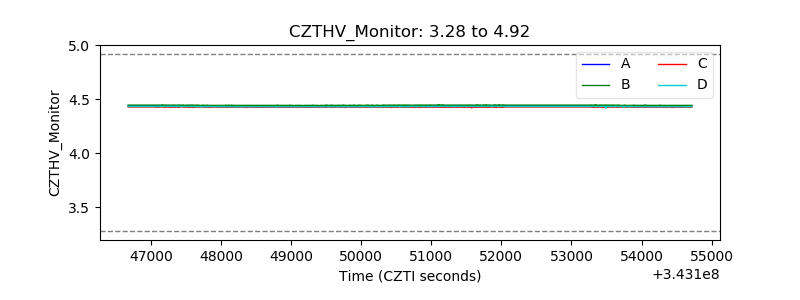 |
| D_VDD | 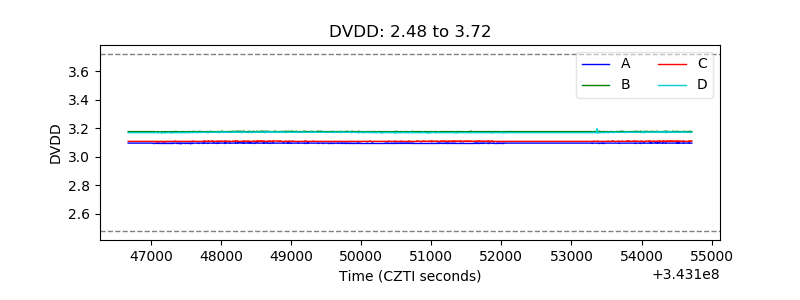 |
| Temperature 1 |  |
| Veto HV Monitor | 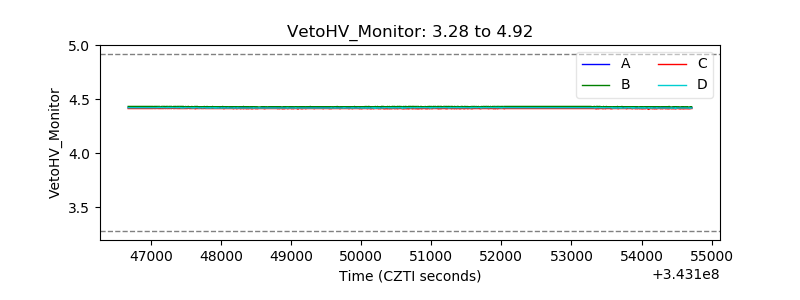 |
| Veto LLD |  |
| Alpha Counter | 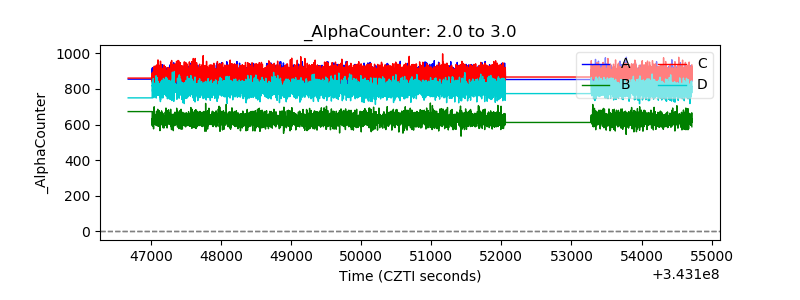 |
| _CPM_Rate | 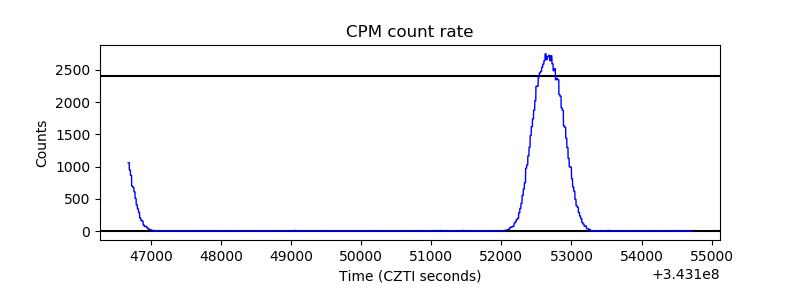 |
| CZT Counter | 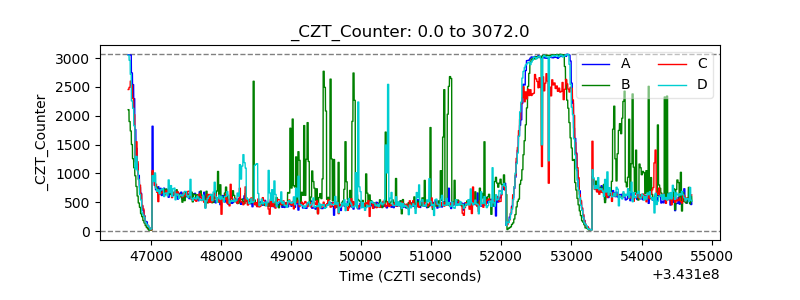 |
| +2.5 Volts monitor |  |
| +5 Volts monitor | 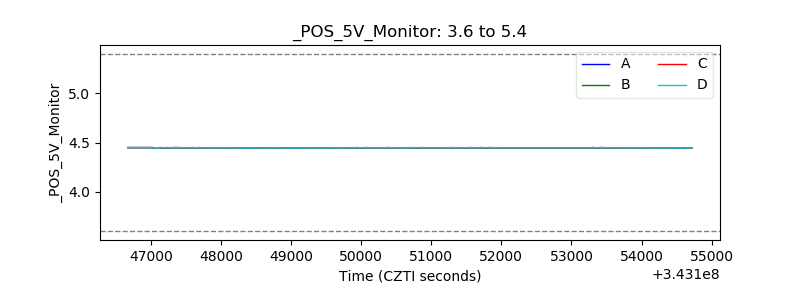 |
| _ROLL_ROT | 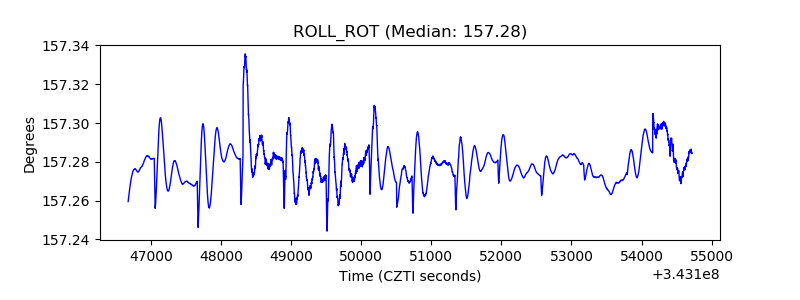 |
| _Roll_DEC | 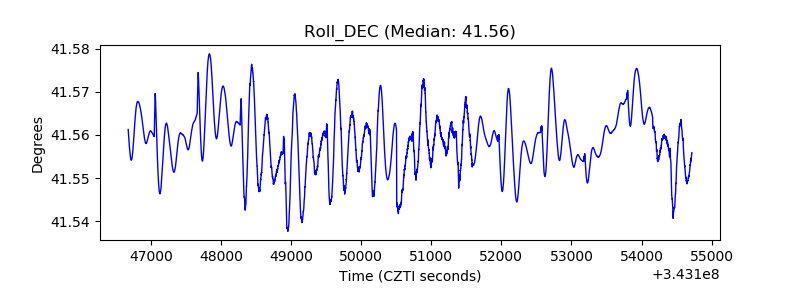 |
| _Roll_RA | 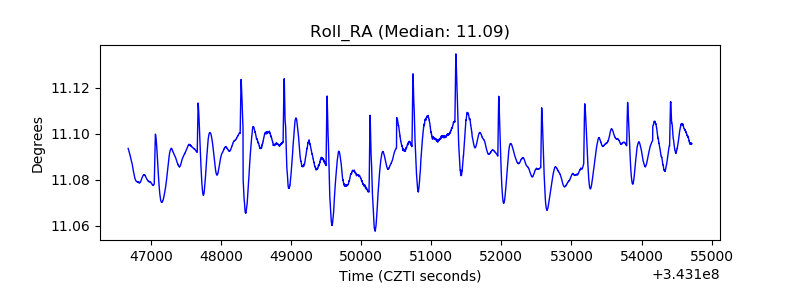 |
| Veto Counter | 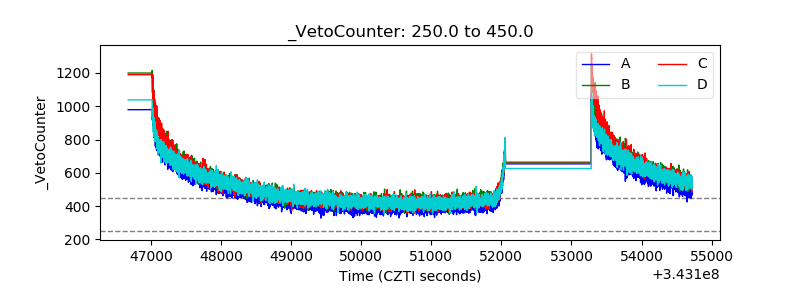 |