| Param | Original file | Final file |
|---|---|---|
| Filename | modeM0/AS1A10_002T05_9000004000_27762cztM0_level2.evt | modeM0/AS1A10_002T05_9000004000_27762cztM0_level2_quad_clean.evt |
| Size (bytes) | 570,320,640 | 112,947,840 |
| Size | 543.9 MB | 107.7 MB |
| Events in quadrant A | 3,359,534 | 780,738 |
| Events in quadrant B | 5,456,810 | 746,749 |
| Events in quadrant C | 3,712,597 | 742,807 |
| Events in quadrant D | 4,320,092 | 714,156 |
| Mode M9 | |||
|---|---|---|---|
| Quadrant | BADHDUFLAG | Total packets | Discarded packets |
| A | 0 | 13 | 0 |
| B | 0 | 14 | 0 |
| C | 0 | 14 | 0 |
| D | 0 | 14 | 0 |
| Mode M0 | |||
|---|---|---|---|
| Quadrant | BADHDUFLAG | Total packets | Discarded packets |
| A | 0 | 14003 | 0 |
| B | 0 | 20505 | 0 |
| C | 0 | 15193 | 0 |
| D | 0 | 16961 | 0 |
| Quadrant | Total seconds | Saturated seconds | Saturation percentage |
|---|---|---|---|
| A | 6254 | 41 | 0.655580% |
| B | 6254 | 633 | 10.121522% |
| C | 6254 | 115 | 1.838823% |
| D | 6254 | 377 | 6.028142% |
Noise dominated data is calculated using 1-second bins in cleaned event files. If a bin has >2000 counts, and if more than 50% of those come from <1% of pixels, then it is considered to be noise-dominated and hence unusable.
| Quadrant | # 1 sec bins | Bins with >0 counts | Bins with >2000 counts | High rate bins dominated by noise | Noise dominated (total time) | Noise dominated (detector-on time) | Marked lightcurve |
|---|---|---|---|---|---|---|---|
| A | 7574 | 6255 | 4 | 4 | 0.05% | 0.06% | 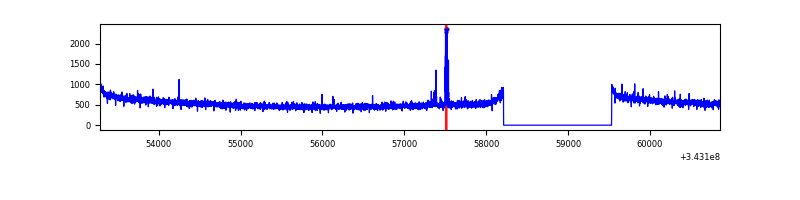 |
| B | 7573 | 6254 | 287 | 287 | 3.79% | 4.59% | 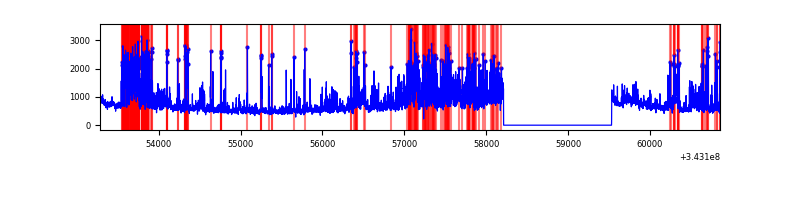 |
| C | 7574 | 6255 | 10 | 10 | 0.13% | 0.16% | 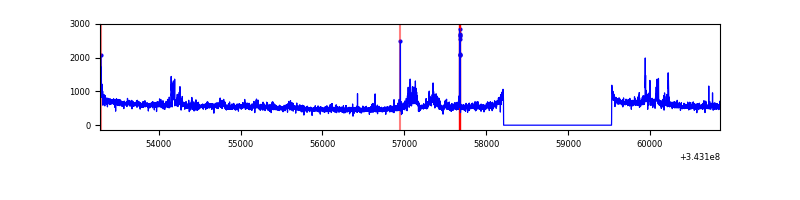 |
| D | 7574 | 6255 | 317 | 317 | 4.19% | 5.07% | 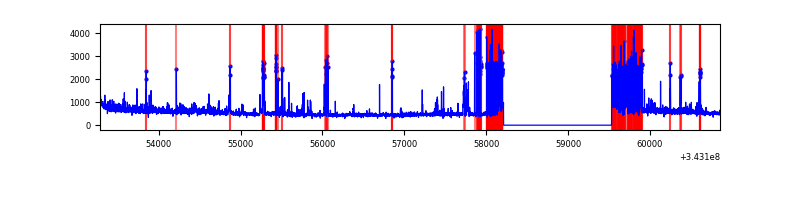 |
Top three noisy pixels from each quadrant. If the there are fewer than three noisy pixels in the level2.evt file, extra rows are filled as -1
| Pixel properties | Quadrant properties | ||||||
|---|---|---|---|---|---|---|---|
| Quadrant | DetID | PixID | Counts | Sigma | Mean | Median | Sigma |
| A | 14 | 235 | 35662 | 206.08 | 862 | 848 | 168.9 |
| A | 13 | 254 | 10473 | 56.97 | 862 | 848 | 168.9 |
| A | 0 | 226 | 7437 | 39.0 | 862 | 848 | 168.9 |
| B | 3 | 64 | 2209630 | 14915.57 | 813 | 796 | 148.1 |
| B | 10 | 245 | 22584 | 147.13 | 813 | 796 | 148.1 |
| B | 4 | 52 | 20523 | 133.21 | 813 | 796 | 148.1 |
| C | 3 | 233 | 362287 | 1905.73 | 822 | 830 | 189.7 |
| C | 14 | 238 | 134783 | 706.25 | 822 | 830 | 189.7 |
| C | 0 | 207 | 9285 | 44.58 | 822 | 830 | 189.7 |
| D | 1 | 52 | 1080373 | 5756.61 | 805 | 790 | 187.5 |
| D | 2 | 250 | 65790 | 346.6 | 805 | 790 | 187.5 |
| D | 13 | 104 | 59292 | 311.95 | 805 | 790 | 187.5 |
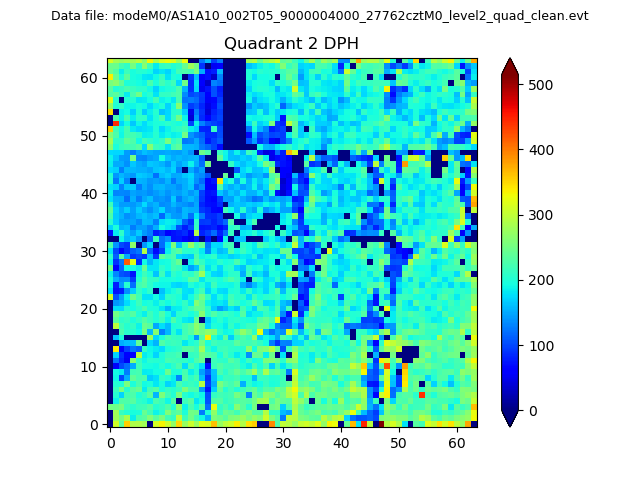
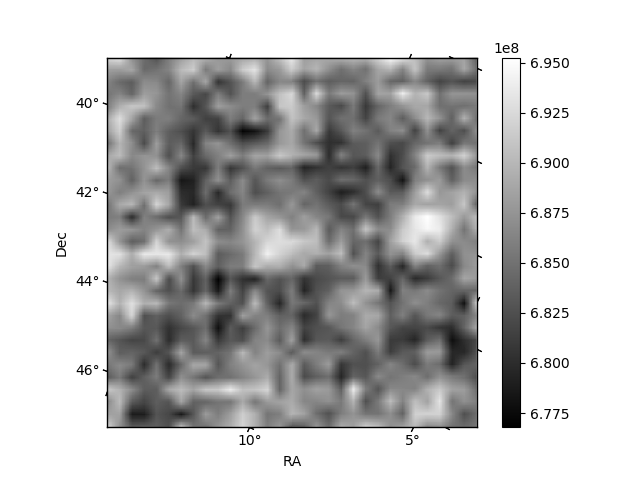
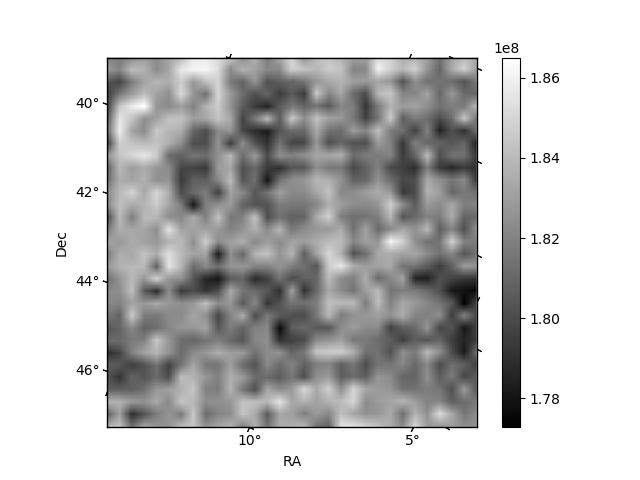
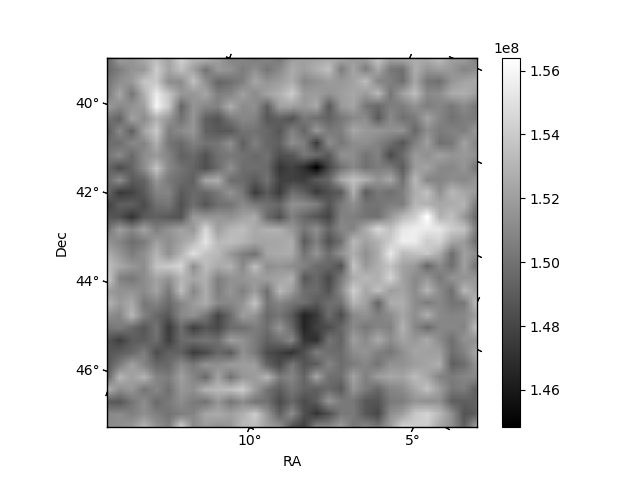
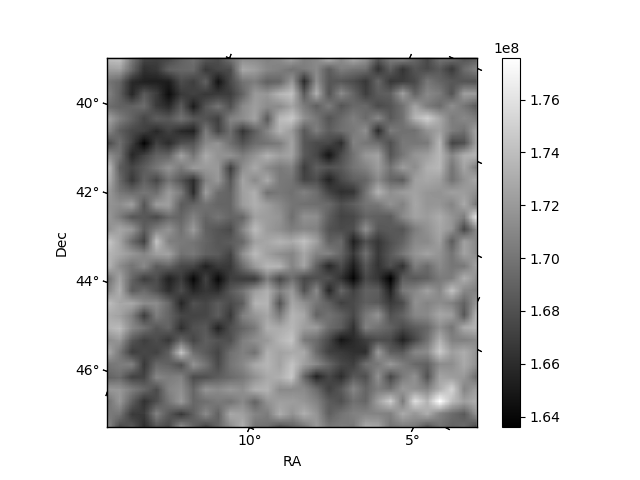
Histogram calculated using DETX and DETY for each event in the final _common_clean file
| Quadrant A | 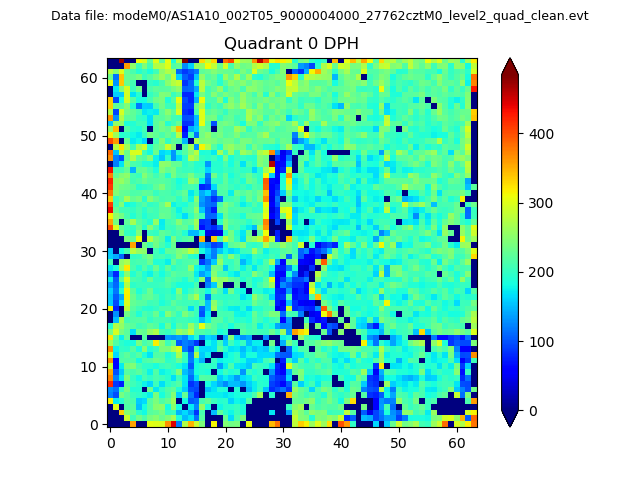 |
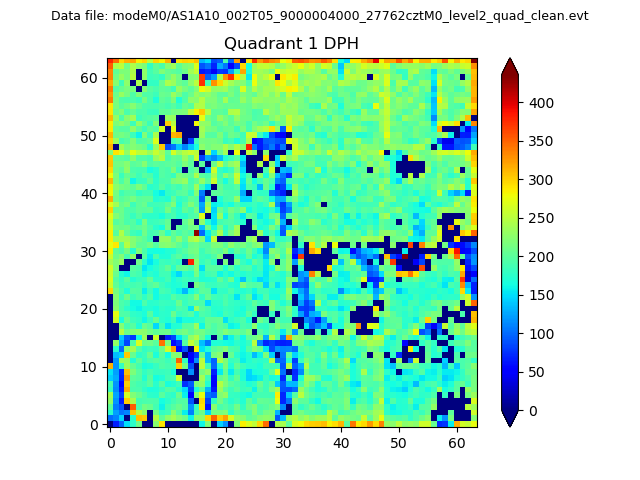 |
Quadrant B |
|---|---|---|---|
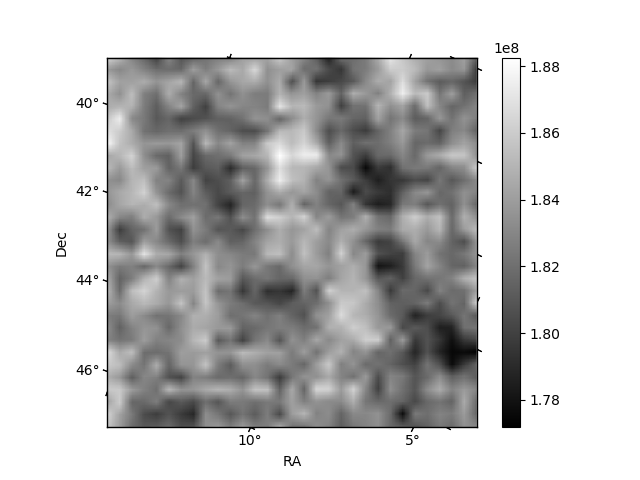
| Quadrant D | 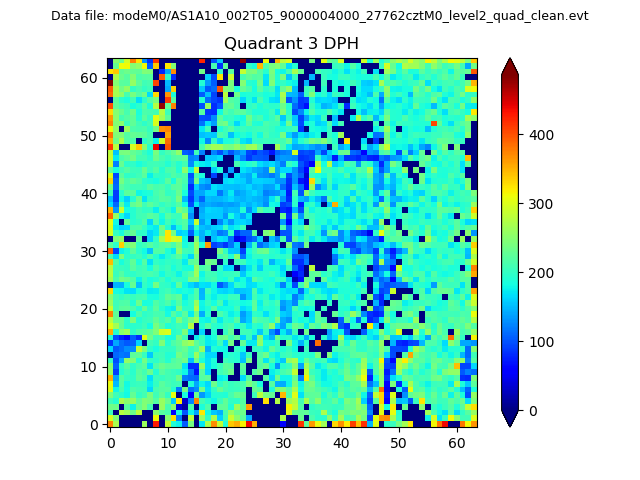 |
 |
Quadrant C |
| Plot type | Count rate plots | Images |
|---|---|---|
| Comparison with Poisson distribution Blue bars denote a histogram of data divided into 1 sec bins. Red curve is a Poisson curve with rate = median count rate of data. |
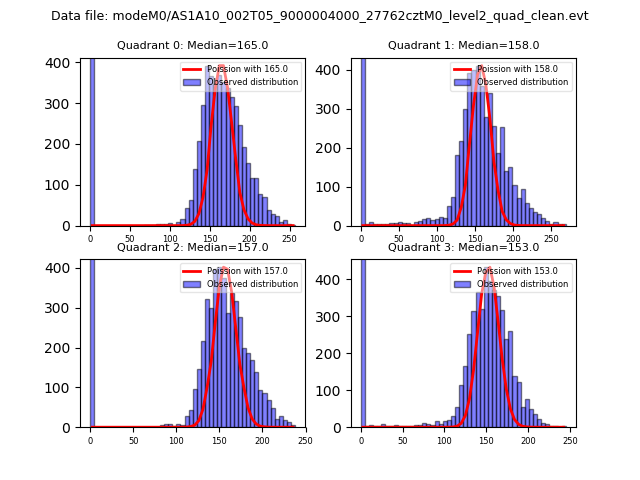 |
 |
| Quadrant-wise count rates Data is divided into 100 sec bins |
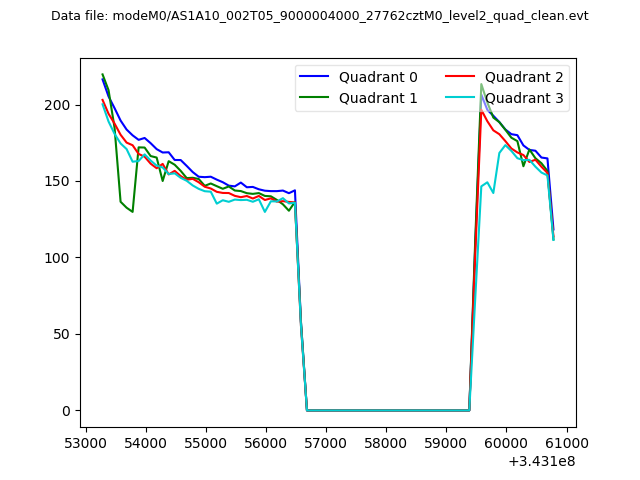 |
|
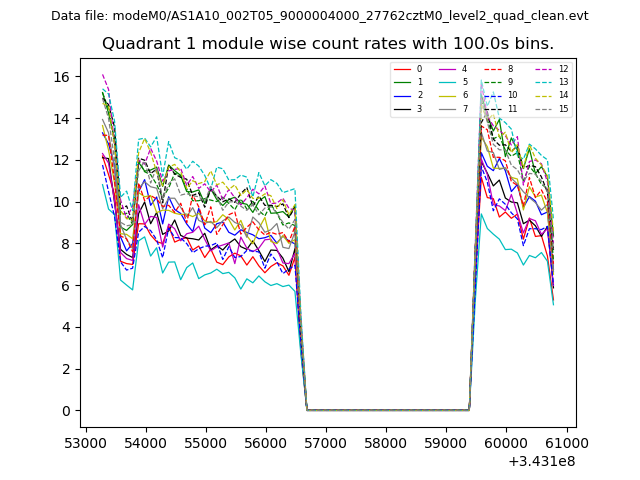
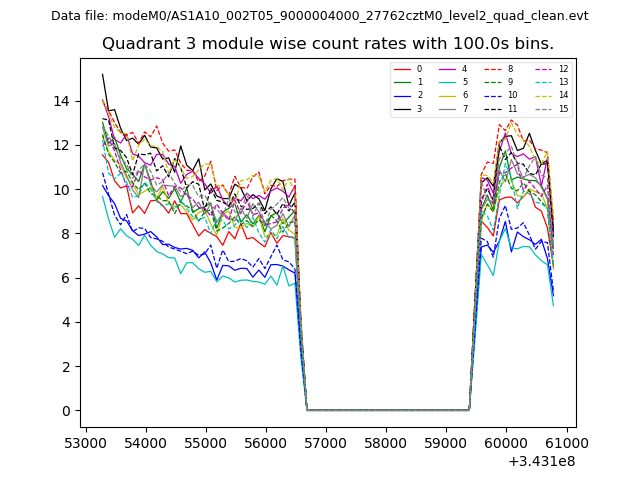
| Module-wise count rates for Quadrant A Data is divided into 100 sec bins |
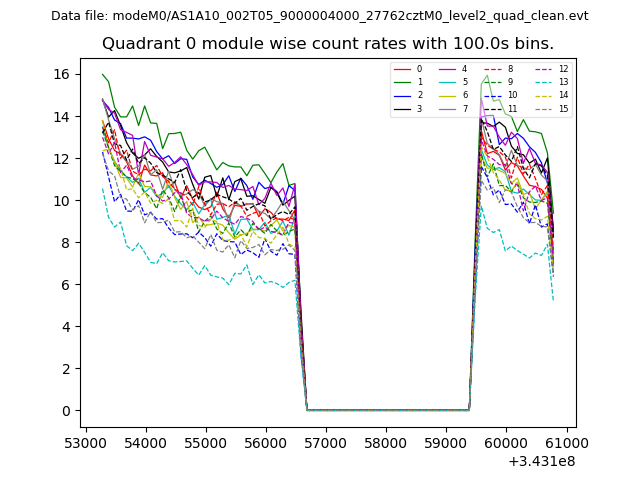 |
 |
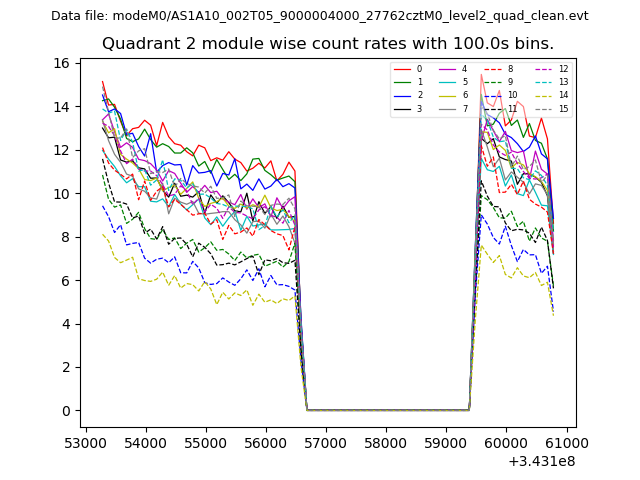
| Module-wise count rates for Quadrant B Data is divided into 100 sec bins |
 |
 |
| Module-wise count rates for Quadrant C Data is divided into 100 sec bins |
 |
 |
| Module-wise count rates for Quadrant D Data is divided into 100 sec bins |
 |
 |
| Parameter | Plot |
|---|---|
| CZT HV Monitor | 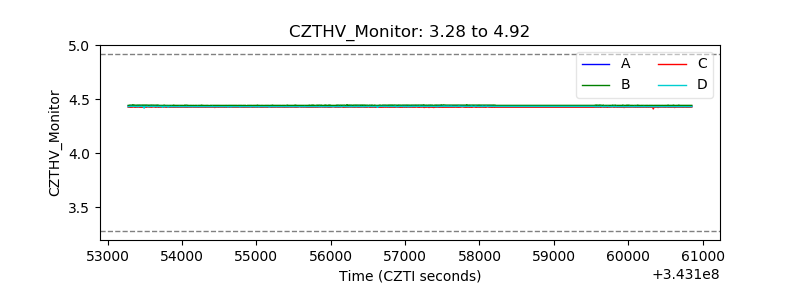 |
| D_VDD | 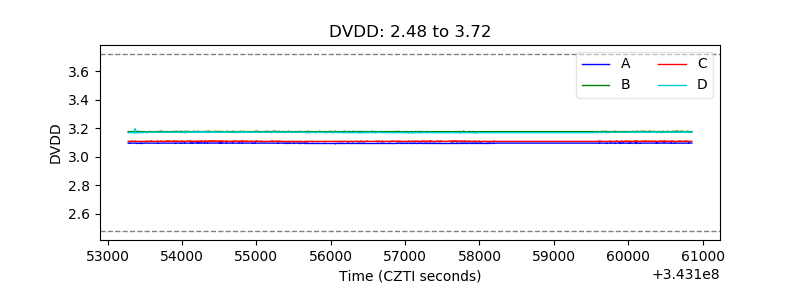 |
| Temperature 1 | 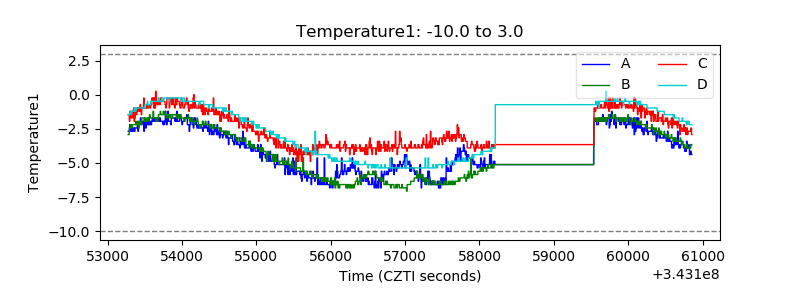 |
| Veto HV Monitor | 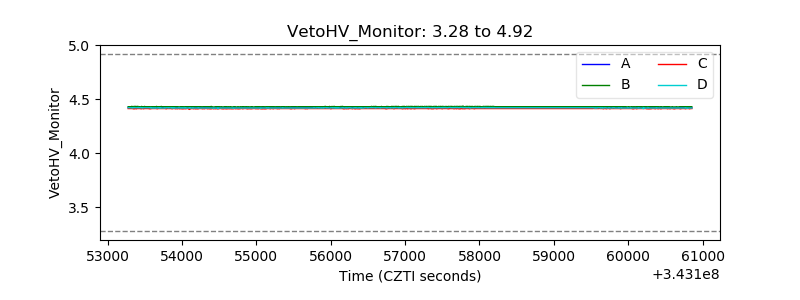 |
| Veto LLD | 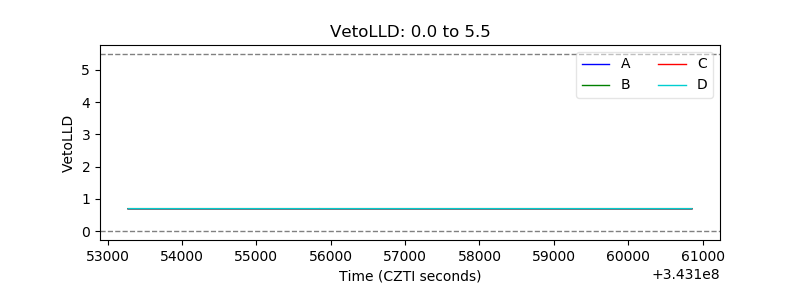 |
| Alpha Counter | 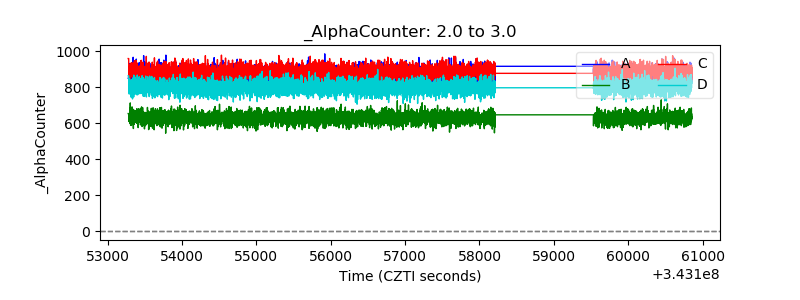 |
| _CPM_Rate | 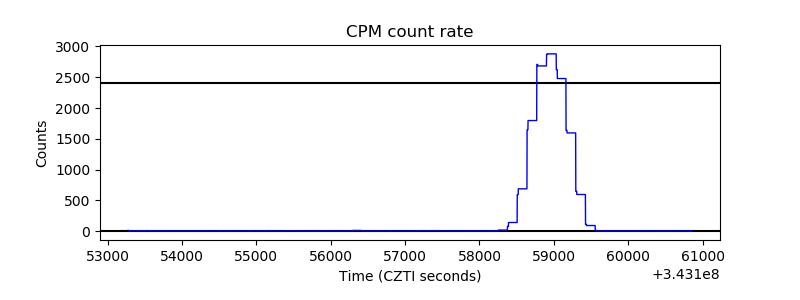 |
| CZT Counter | 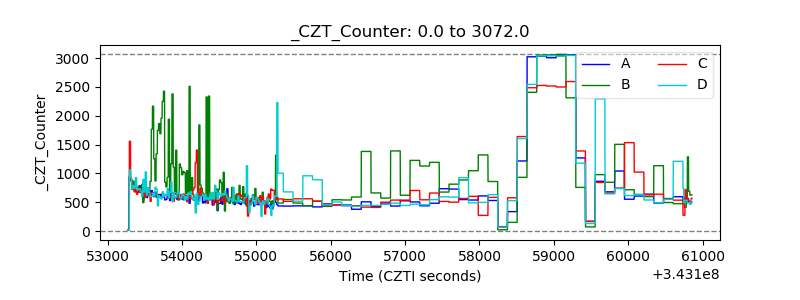 |
| +2.5 Volts monitor | 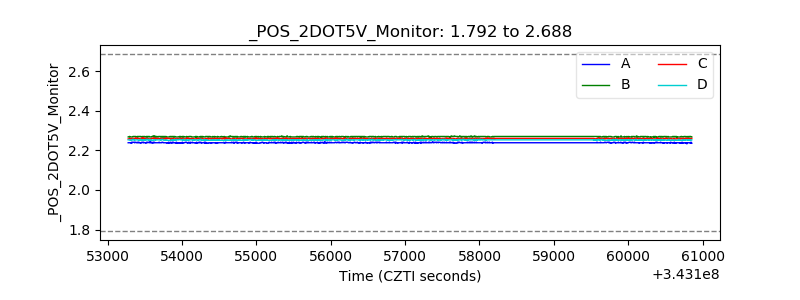 |
| +5 Volts monitor | 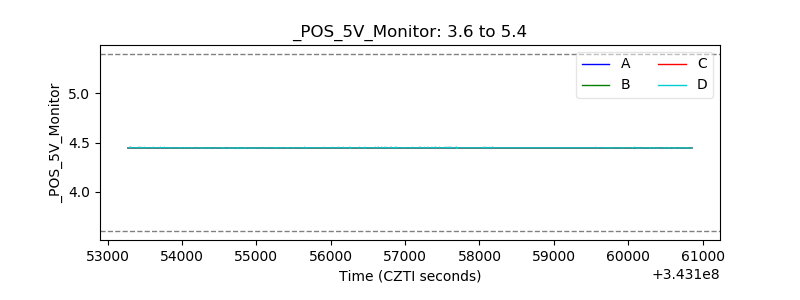 |
| _ROLL_ROT | 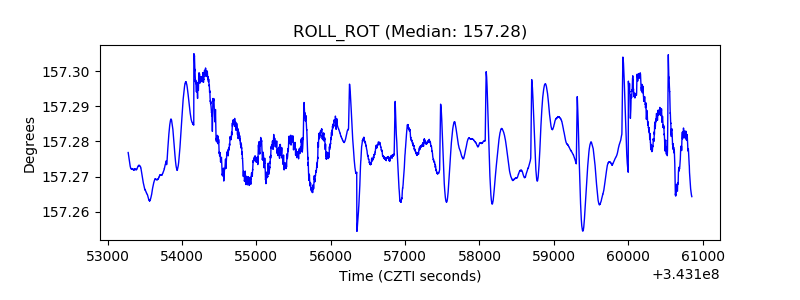 |
| _Roll_DEC |  |
| _Roll_RA | 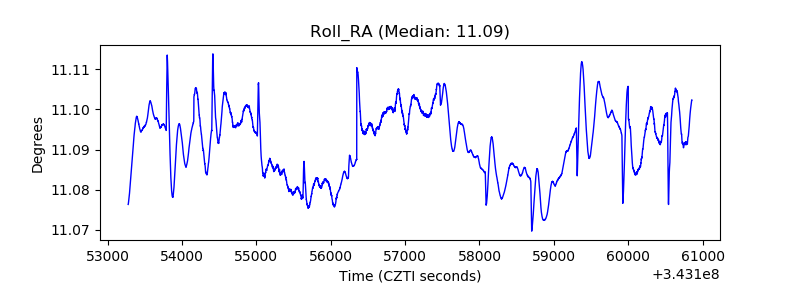 |
| Veto Counter | 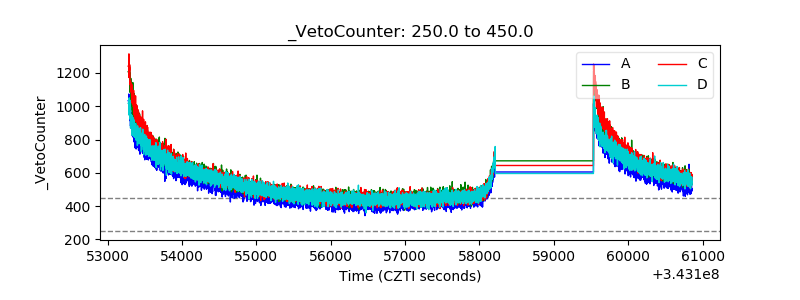 |