| Param | Original file | Final file |
|---|---|---|
| Filename | modeM0/AS1A10_002T05_9000004000_27763cztM0_level2.evt | modeM0/AS1A10_002T05_9000004000_27763cztM0_level2_quad_clean.evt |
| Size (bytes) | 139,826,880 | 35,199,360 |
| Size | 133.3 MB | 33.6 MB |
| Events in quadrant A | 828,942 | 252,577 |
| Events in quadrant B | 1,191,715 | 245,835 |
| Events in quadrant C | 907,193 | 241,061 |
| Events in quadrant D | 1,209,141 | 221,636 |
| Mode M0 | |||
|---|---|---|---|
| Quadrant | BADHDUFLAG | Total packets | Discarded packets |
| A | 0 | 3380 | 0 |
| B | 0 | 4539 | 0 |
| C | 0 | 3689 | 0 |
| D | 0 | 4486 | 0 |
| Quadrant | Total seconds | Saturated seconds | Saturation percentage |
|---|---|---|---|
| A | 1402 | 4 | 0.285307% |
| B | 1403 | 90 | 6.414825% |
| C | 1403 | 26 | 1.853172% |
| D | 1403 | 161 | 11.475410% |
Noise dominated data is calculated using 1-second bins in cleaned event files. If a bin has >2000 counts, and if more than 50% of those come from <1% of pixels, then it is considered to be noise-dominated and hence unusable.
| Quadrant | # 1 sec bins | Bins with >0 counts | Bins with >2000 counts | High rate bins dominated by noise | Noise dominated (total time) | Noise dominated (detector-on time) | Marked lightcurve |
|---|---|---|---|---|---|---|---|
| A | 1402 | 1402 | 0 | 0 | 0.00% | 0.00% | 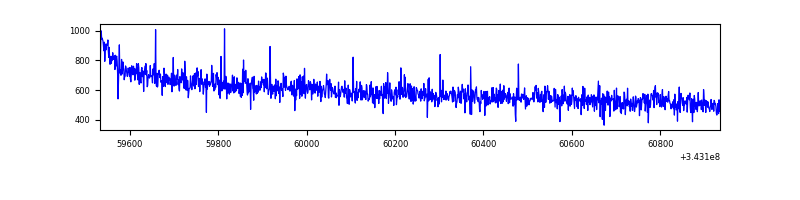 |
| B | 1403 | 1403 | 55 | 55 | 3.92% | 3.92% | 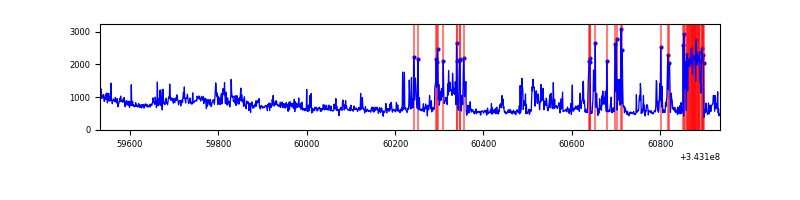 |
| C | 1403 | 1403 | 0 | 0 | 0.00% | 0.00% | 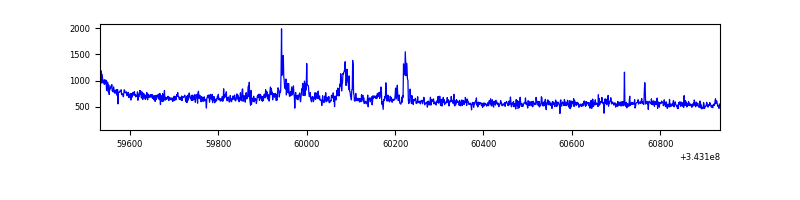 |
| D | 1403 | 1403 | 132 | 132 | 9.41% | 9.41% | 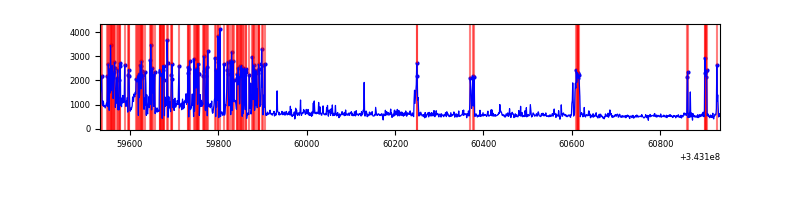 |
Top three noisy pixels from each quadrant. If the there are fewer than three noisy pixels in the level2.evt file, extra rows are filled as -1
| Pixel properties | Quadrant properties | ||||||
|---|---|---|---|---|---|---|---|
| Quadrant | DetID | PixID | Counts | Sigma | Mean | Median | Sigma |
| A | 13 | 254 | 2468 | 51.62 | 214 | 211 | 43.7 |
| A | 0 | 226 | 1994 | 40.78 | 214 | 211 | 43.7 |
| A | 3 | 137 | 1702 | 34.1 | 214 | 211 | 43.7 |
| B | 3 | 64 | 382218 | 9830.42 | 204 | 199 | 38.9 |
| B | 4 | 52 | 5185 | 128.3 | 204 | 199 | 38.9 |
| B | 12 | 111 | 4034 | 98.69 | 204 | 199 | 38.9 |
| C | 3 | 233 | 70972 | 1448.99 | 205 | 206 | 48.8 |
| C | 14 | 238 | 33603 | 683.83 | 205 | 206 | 48.8 |
| C | 12 | 249 | 2044 | 37.63 | 205 | 206 | 48.8 |
| D | 1 | 52 | 433980 | 9211.2 | 196 | 191 | 47.1 |
| D | 2 | 250 | 16114 | 338.11 | 196 | 191 | 47.1 |
| D | 2 | 234 | 6305 | 129.83 | 196 | 191 | 47.1 |
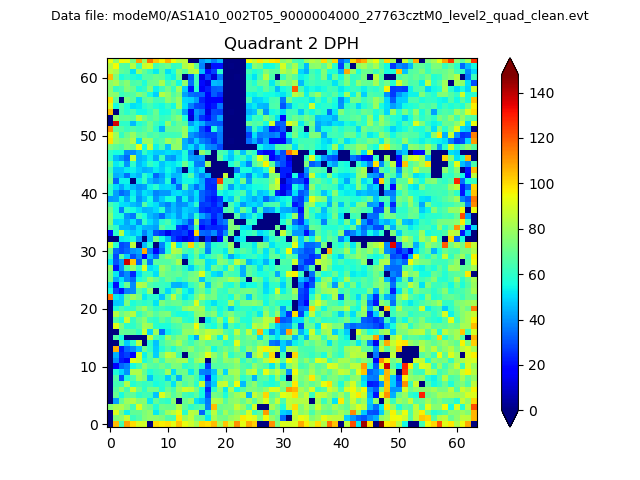
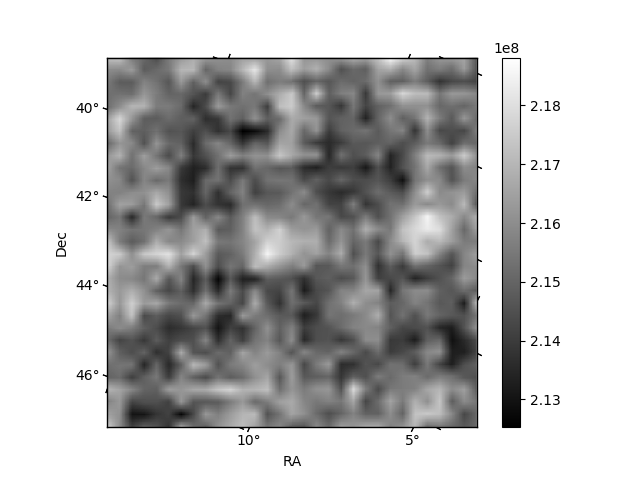
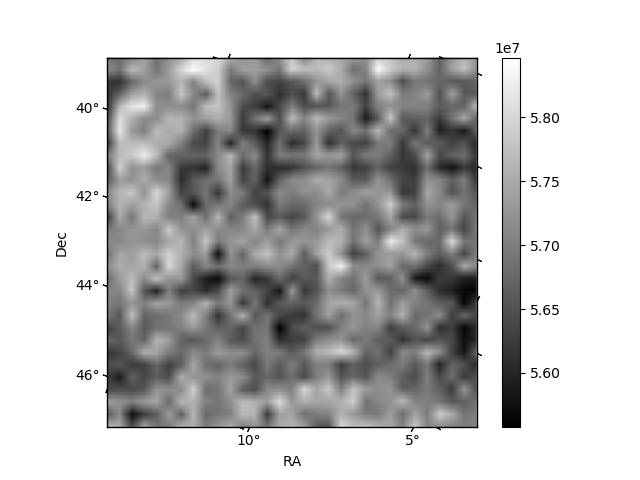
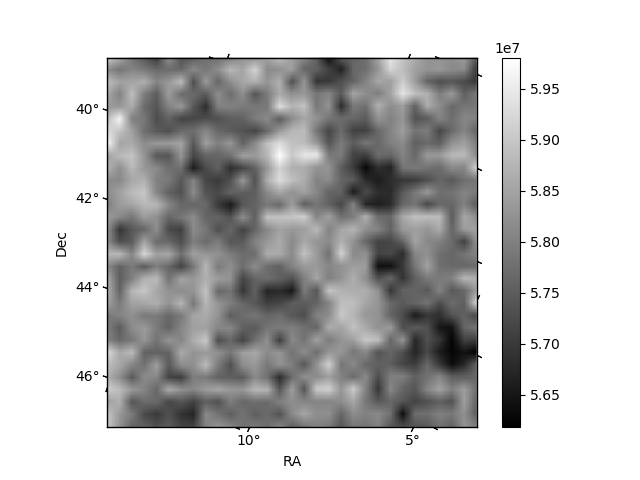
Histogram calculated using DETX and DETY for each event in the final _common_clean file
| Quadrant A | 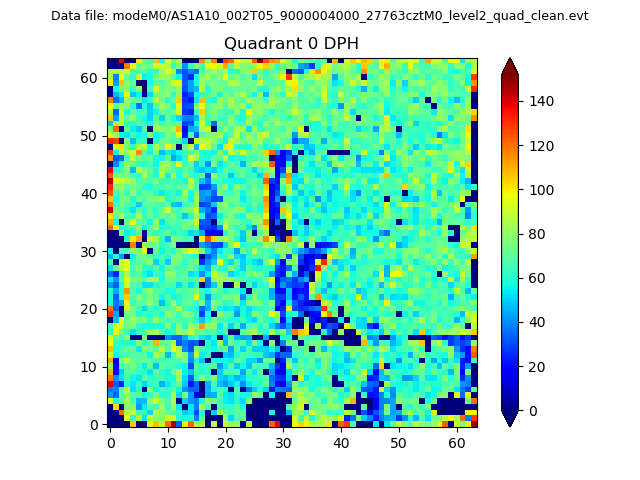 |
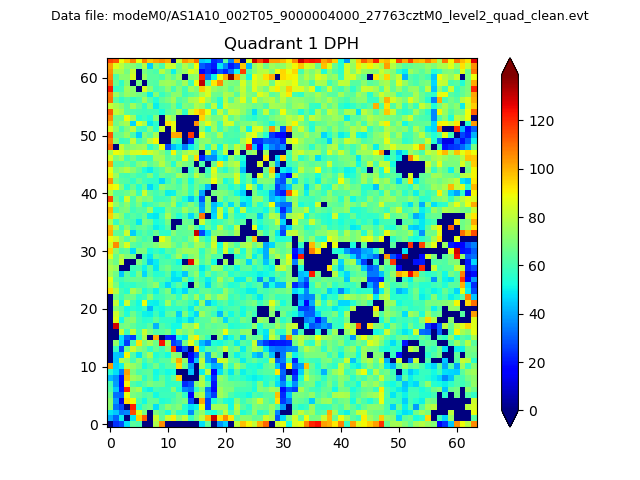 |
Quadrant B |
|---|---|---|---|
| Quadrant D | 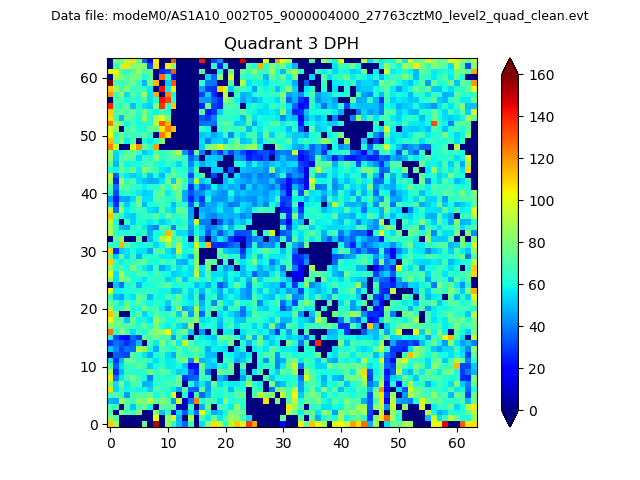 |
 |
Quadrant C |
| Plot type | Count rate plots | Images |
|---|---|---|
| Comparison with Poisson distribution Blue bars denote a histogram of data divided into 1 sec bins. Red curve is a Poisson curve with rate = median count rate of data. |
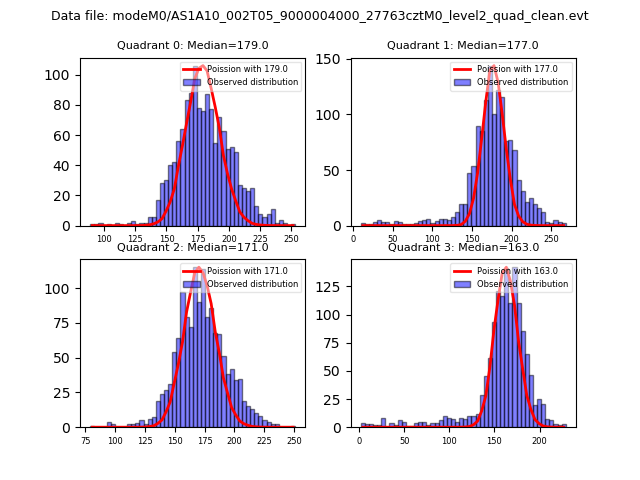 |
 |
| Quadrant-wise count rates Data is divided into 100 sec bins |
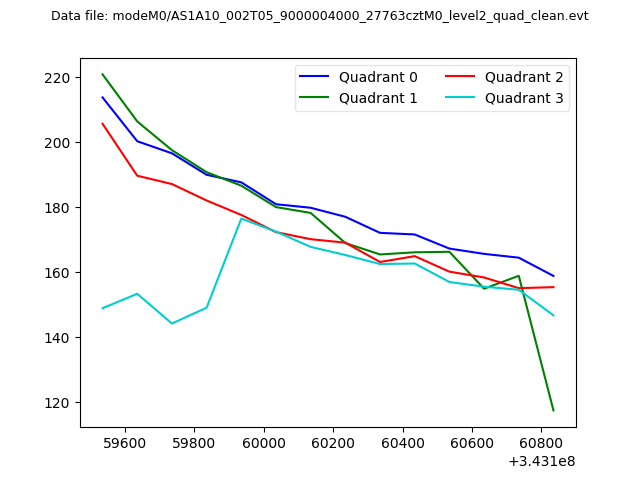 |
|
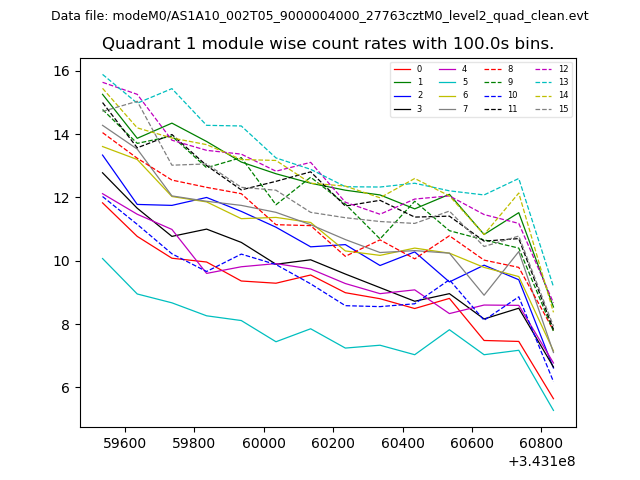
| Module-wise count rates for Quadrant A Data is divided into 100 sec bins |
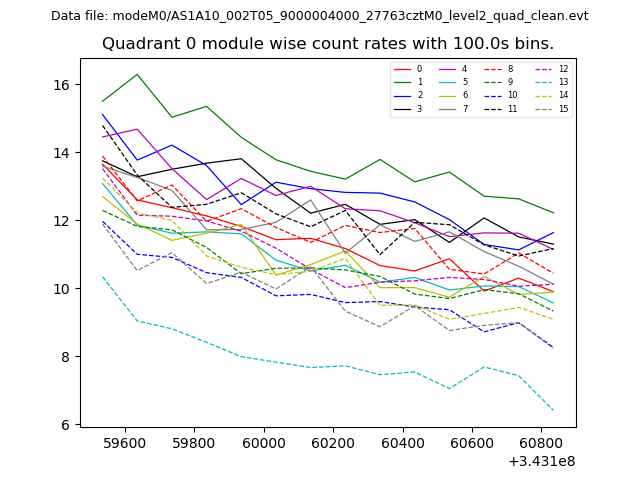 |
 |
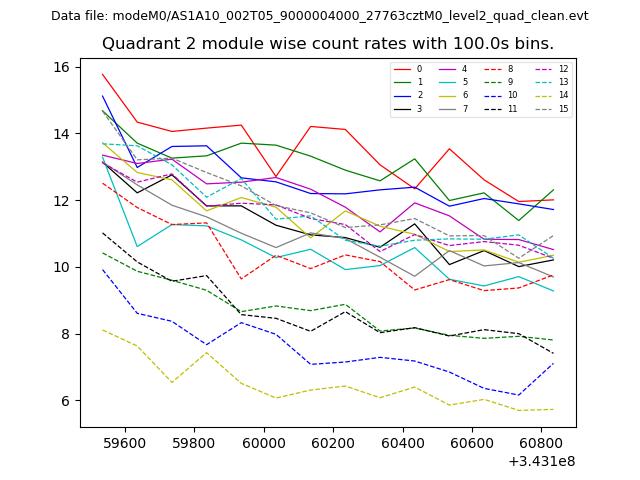
| Module-wise count rates for Quadrant B Data is divided into 100 sec bins |
 |
 |
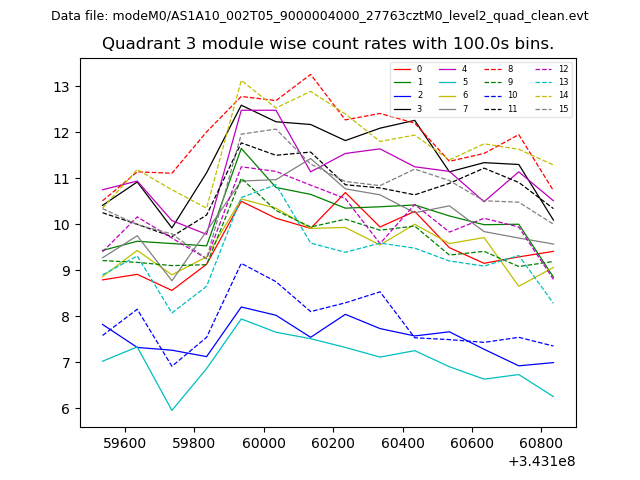
| Module-wise count rates for Quadrant C Data is divided into 100 sec bins |
 |
 |
| Module-wise count rates for Quadrant D Data is divided into 100 sec bins |
 |
 |
| Parameter | Plot |
|---|---|
| CZT HV Monitor | 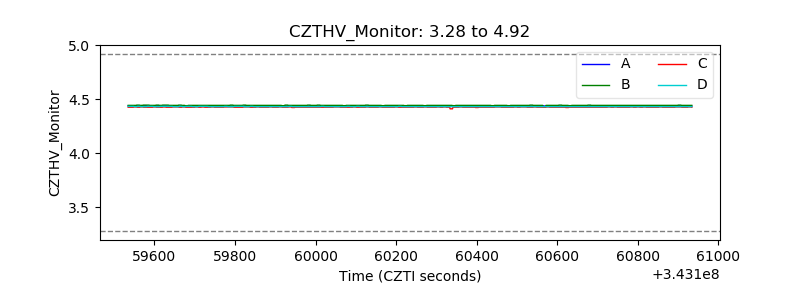 |
| D_VDD | 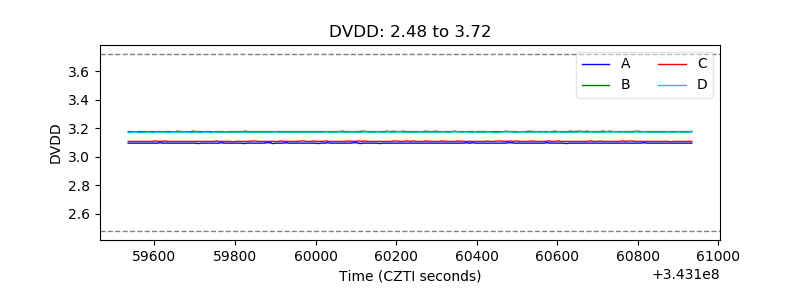 |
| Temperature 1 | 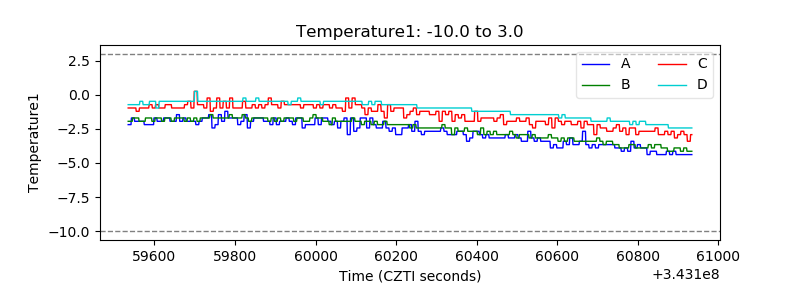 |
| Veto HV Monitor | 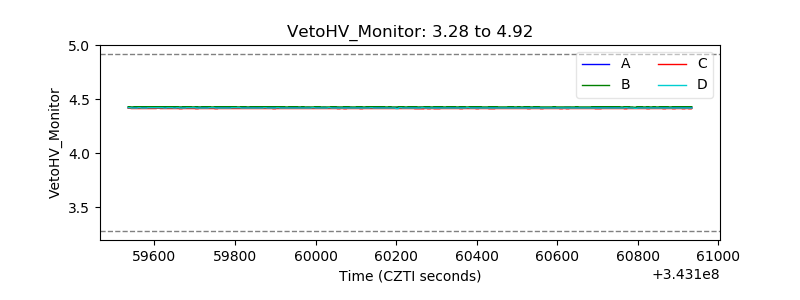 |
| Veto LLD | 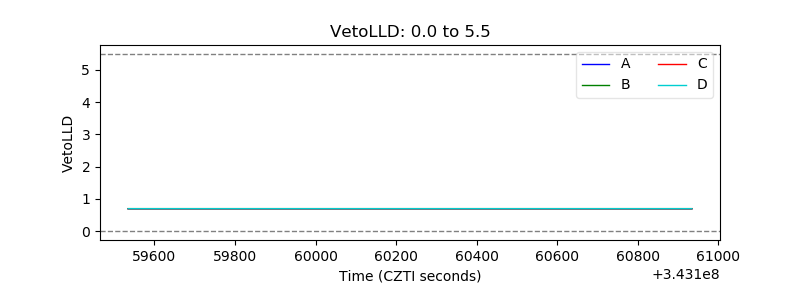 |
| Alpha Counter | 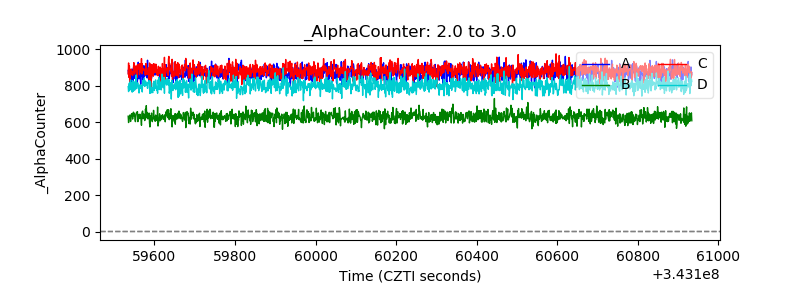 |
| _CPM_Rate | 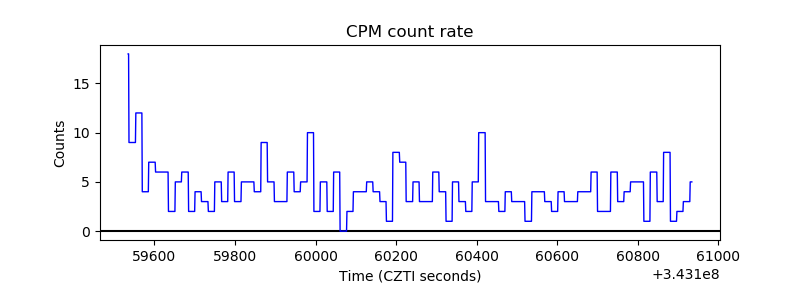 |
| CZT Counter | 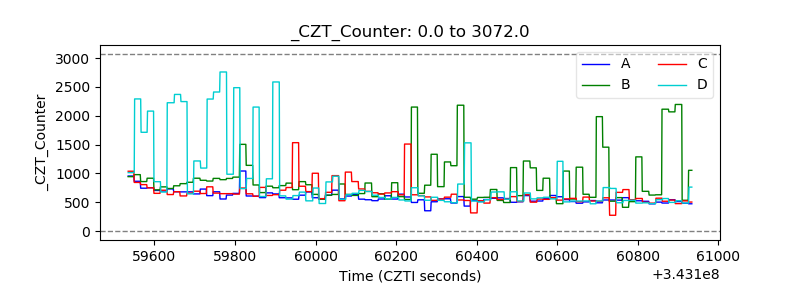 |
| +2.5 Volts monitor |  |
| +5 Volts monitor |  |
| _ROLL_ROT | 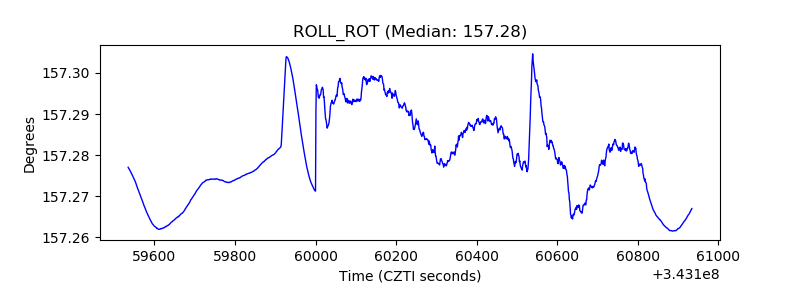 |
| _Roll_DEC | 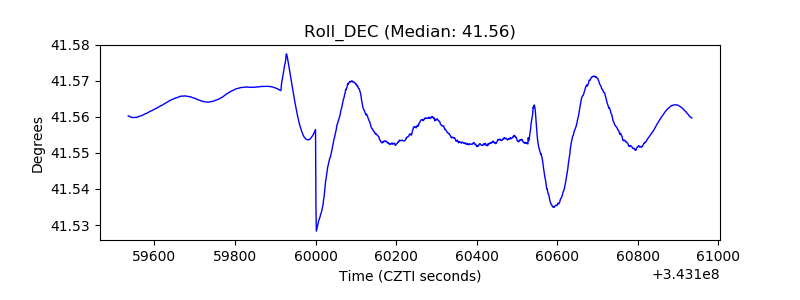 |
| _Roll_RA | 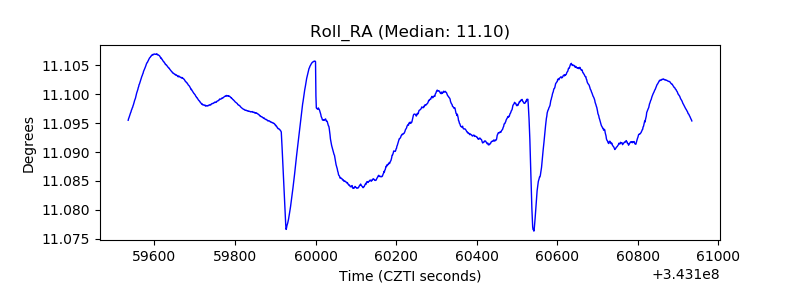 |
| Veto Counter | 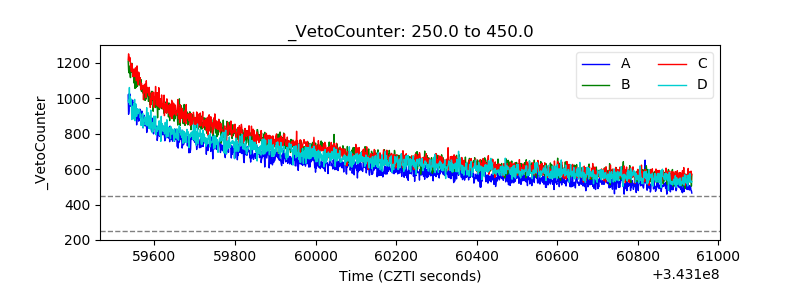 |