| Param | Original file | Final file |
|---|---|---|
| Filename | modeM0/AS1A09_038T35_9000004006cztM0_level2.fits | modeM0/AS1A09_038T35_9000004006cztM0_level2_quad_clean.evt |
| Size (bytes) | 93,608,640 | 113,938,560 |
| Size | 89.3 MB | 108.7 MB |
| Events in quadrant A | 573,834 | 730,165 |
| Events in quadrant B | 541,812 | 725,947 |
| Events in quadrant C | 558,710 | 688,988 |
| Events in quadrant D | 490,074 | 634,448 |
| Mode SS | |||
|---|---|---|---|
| Quadrant | BADHDUFLAG | Total packets | Discarded packets |
| A | 0 | 200 | 0 |
| B | 0 | 200 | 0 |
| C | 0 | 200 | 0 |
| D | 0 | 200 | 0 |
| Mode M9 | |||
|---|---|---|---|
| Quadrant | BADHDUFLAG | Total packets | Discarded packets |
| A | 0 | 16 | 0 |
| B | 0 | 16 | 0 |
| C | 0 | 16 | 0 |
| D | 0 | 16 | 0 |
| Mode M0 | |||
|---|---|---|---|
| Quadrant | BADHDUFLAG | Total packets | Discarded packets |
| A | 0 | 21489 | 0 |
| B | 0 | 25151 | 0 |
| C | 0 | 22234 | 0 |
| D | 0 | 21935 | 0 |
| Quadrant | Total seconds | Saturated seconds | Saturation percentage |
|---|---|---|---|
| A | 9661 | 167 | 1.728600% |
| B | 9661 | 460 | 4.761412% |
| C | 9661 | 187 | 1.935617% |
| D | 9661 | 171 | 1.770003% |
Noise dominated data is calculated using 1-second bins in cleaned event files. If a bin has >2000 counts, and if more than 50% of those come from <1% of pixels, then it is considered to be noise-dominated and hence unusable.
| Quadrant | # 1 sec bins | Bins with >0 counts | Bins with >2000 counts | High rate bins dominated by noise | Noise dominated (total time) | Noise dominated (detector-on time) | Marked lightcurve |
|---|---|---|---|---|---|---|---|
| A | 11356 | 9661 | 0 | 0 | 0.00% | 0.00% |  |
| B | 11356 | 9659 | 0 | 0 | 0.00% | 0.00% |  |
| C | 11356 | 9661 | 0 | 0 | 0.00% | 0.00% |  |
| D | 11356 | 9661 | 0 | 0 | 0.00% | 0.00% |  |
Top three noisy pixels from each quadrant. If the there are fewer than three noisy pixels in the level2.evt file, extra rows are filled as -1
| Pixel properties | Quadrant properties | ||||||
|---|---|---|---|---|---|---|---|
| Quadrant | DetID | PixID | Counts | Sigma | Mean | Median | Sigma |
| A | 0 | 29 | 568 | 10.96 | 149 | 141 | 39.0 |
| A | 7 | 110 | 503 | 9.29 | 149 | 141 | 39.0 |
| A | 0 | 30 | 455 | 8.06 | 149 | 141 | 39.0 |
| B | 2 | 9 | 458 | 10.56 | 143 | 136 | 30.5 |
| B | 2 | 8 | 395 | 8.49 | 143 | 136 | 30.5 |
| B | 5 | 128 | 372 | 7.74 | 143 | 136 | 30.5 |
| C | 3 | 126 | 379 | 6.17 | 147 | 138 | 39.0 |
| C | 12 | 241 | 376 | 6.09 | 147 | 138 | 39.0 |
| C | 7 | 111 | 374 | 6.04 | 147 | 138 | 39.0 |
| D | 3 | 14 | 389 | 6.73 | 139 | 127 | 39.0 |
| D | 10 | 189 | 382 | 6.55 | 139 | 127 | 39.0 |
| D | 7 | 3 | 362 | 6.03 | 139 | 127 | 39.0 |
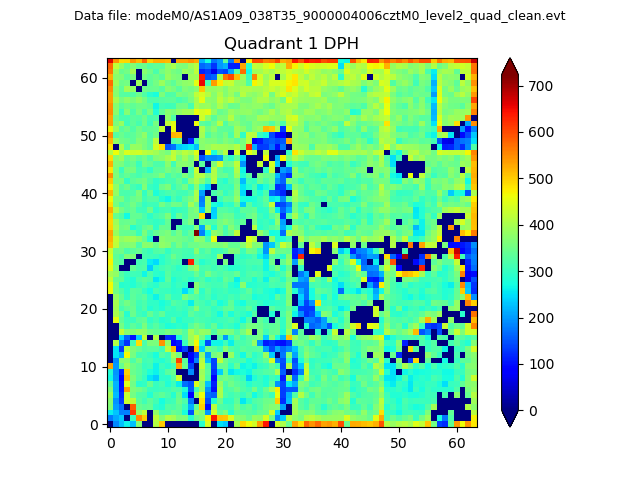
Histogram calculated using DETX and DETY for each event in the final _common_clean file
| Quadrant A |  |
 |
Quadrant B |
|---|---|---|---|
| Quadrant D |  |
 |
Quadrant C |
| Plot type | Count rate plots | Images |
|---|---|---|
| Comparison with Poisson distribution Blue bars denote a histogram of data divided into 1 sec bins. Red curve is a Poisson curve with rate = median count rate of data. |
 |
 |
| Quadrant-wise count rates Data is divided into 100 sec bins |
 |
|
| Module-wise count rates for Quadrant A Data is divided into 100 sec bins |
 |
 |
| Module-wise count rates for Quadrant B Data is divided into 100 sec bins |
 |
 |
| Module-wise count rates for Quadrant C Data is divided into 100 sec bins |
 |
 |
| Module-wise count rates for Quadrant D Data is divided into 100 sec bins |
 |
 |
| Parameter | Plot |
|---|---|
| CZT HV Monitor |  |
| D_VDD |  |
| Temperature 1 |  |
| Veto HV Monitor |  |
| Veto LLD |  |
| Alpha Counter |  |
| _CPM_Rate |  |
| CZT Counter |  |
| +2.5 Volts monitor |  |
| +5 Volts monitor |  |
| _ROLL_ROT |  |
| _Roll_DEC |  |
| _Roll_RA |  |
| Veto Counter |  |