| Param | Original file | Final file |
|---|---|---|
| Filename | modeM0/AS1A09_038T35_9000004006_27766cztM0_level2.evt | modeM0/AS1A09_038T35_9000004006_27766cztM0_level2_quad_clean.evt |
| Size (bytes) | 488,272,320 | 122,587,200 |
| Size | 465.7 MB | 116.9 MB |
| Events in quadrant A | 3,511,187 | 832,672 |
| Events in quadrant B | 3,670,793 | 844,680 |
| Events in quadrant C | 3,764,931 | 800,171 |
| Events in quadrant D | 3,405,398 | 788,306 |
| Mode M9 | |||
|---|---|---|---|
| Quadrant | BADHDUFLAG | Total packets | Discarded packets |
| A | 0 | 6 | 0 |
| B | 0 | 7 | 0 |
| C | 0 | 7 | 0 |
| D | 0 | 7 | 0 |
| Mode M0 | |||
|---|---|---|---|
| Quadrant | BADHDUFLAG | Total packets | Discarded packets |
| A | 0 | 14848 | 0 |
| B | 0 | 15072 | 0 |
| C | 0 | 15284 | 0 |
| D | 0 | 14672 | 0 |
| Quadrant | Total seconds | Saturated seconds | Saturation percentage |
|---|---|---|---|
| A | 6397 | 161 | 2.516805% |
| B | 6397 | 191 | 2.985775% |
| C | 6397 | 158 | 2.469908% |
| D | 6397 | 151 | 2.360481% |
Noise dominated data is calculated using 1-second bins in cleaned event files. If a bin has >2000 counts, and if more than 50% of those come from <1% of pixels, then it is considered to be noise-dominated and hence unusable.
| Quadrant | # 1 sec bins | Bins with >0 counts | Bins with >2000 counts | High rate bins dominated by noise | Noise dominated (total time) | Noise dominated (detector-on time) | Marked lightcurve |
|---|---|---|---|---|---|---|---|
| A | 7057 | 6398 | 49 | 49 | 0.69% | 0.77% | 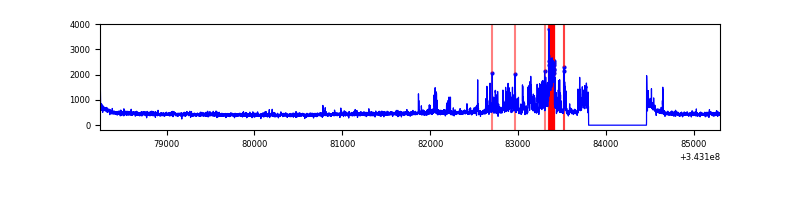 |
| B | 7057 | 6398 | 87 | 87 | 1.23% | 1.36% | 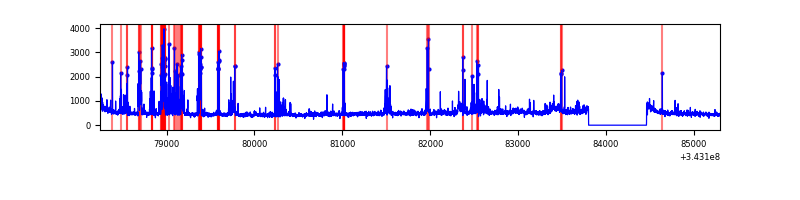 |
| C | 7057 | 6398 | 16 | 16 | 0.23% | 0.25% | 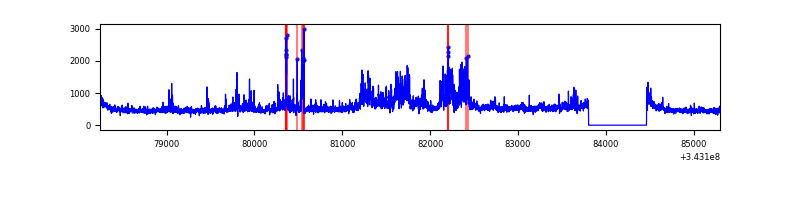 |
| D | 7057 | 6398 | 123 | 123 | 1.74% | 1.92% | 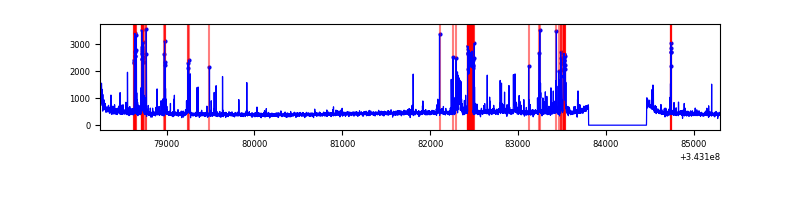 |
Top three noisy pixels from each quadrant. If the there are fewer than three noisy pixels in the level2.evt file, extra rows are filled as -1
| Pixel properties | Quadrant properties | ||||||
|---|---|---|---|---|---|---|---|
| Quadrant | DetID | PixID | Counts | Sigma | Mean | Median | Sigma |
| A | 13 | 170 | 490211 | 3202.06 | 758 | 742 | 152.9 |
| A | 6 | 16 | 81791 | 530.21 | 758 | 742 | 152.9 |
| A | 8 | 192 | 12945 | 79.83 | 758 | 742 | 152.9 |
| B | 3 | 64 | 450095 | 3143.0 | 759 | 740 | 143.0 |
| B | 10 | 245 | 120263 | 836.0 | 759 | 740 | 143.0 |
| B | 0 | 190 | 52710 | 363.5 | 759 | 740 | 143.0 |
| C | 3 | 233 | 804353 | 4716.69 | 729 | 733 | 170.4 |
| C | 14 | 238 | 117740 | 686.75 | 729 | 733 | 170.4 |
| C | 13 | 61 | 5133 | 25.82 | 729 | 733 | 170.4 |
| D | 1 | 52 | 222693 | 1276.88 | 729 | 707 | 173.9 |
| D | 2 | 250 | 175916 | 1007.81 | 729 | 707 | 173.9 |
| D | 7 | 69 | 88990 | 507.81 | 729 | 707 | 173.9 |
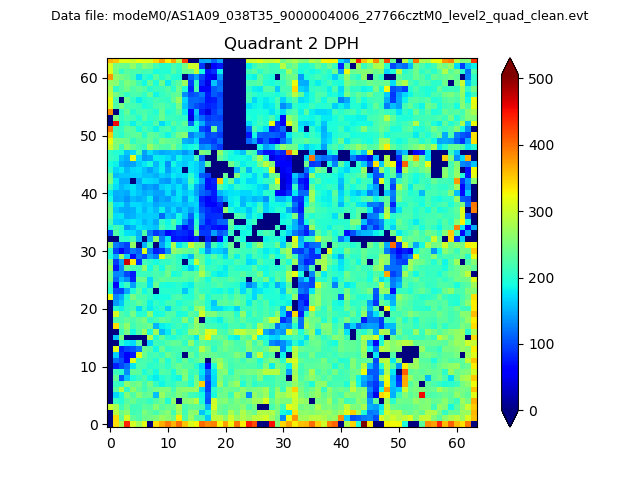
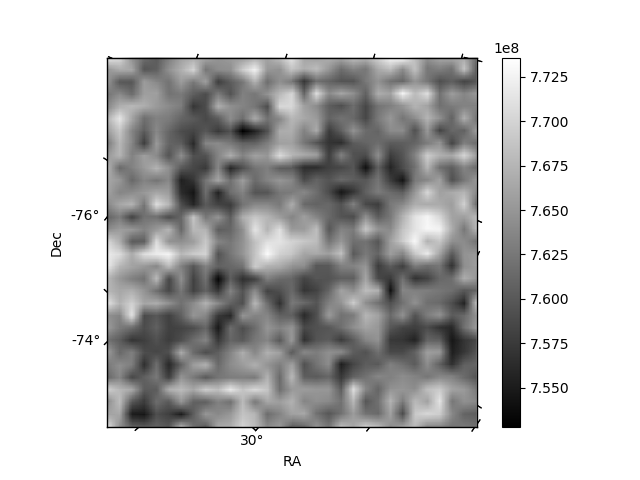
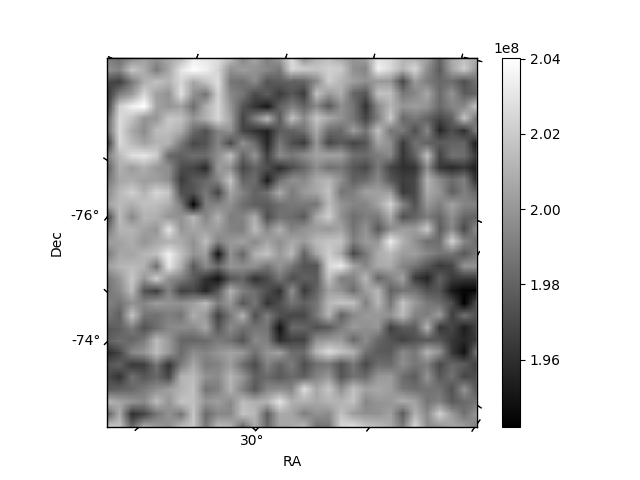
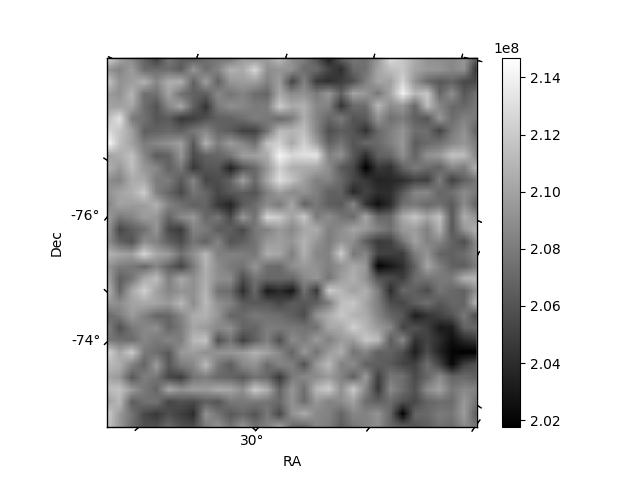
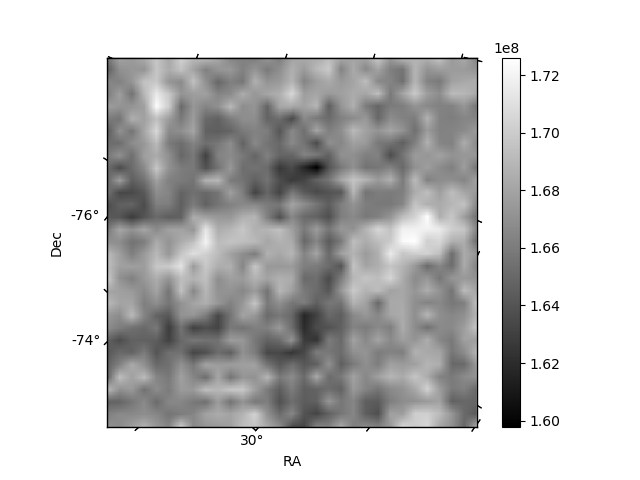
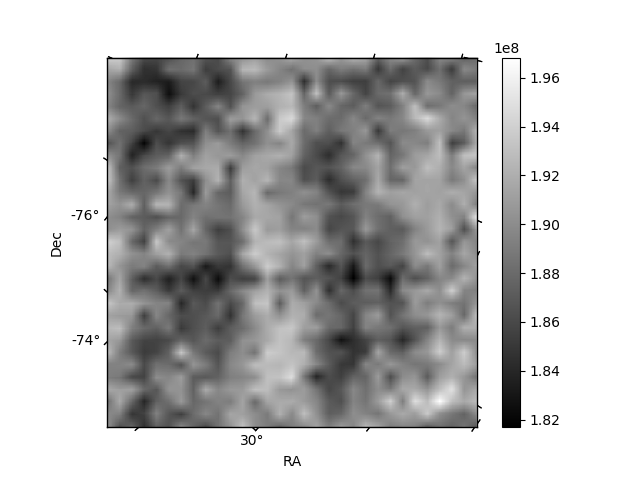
Histogram calculated using DETX and DETY for each event in the final _common_clean file
| Quadrant A | 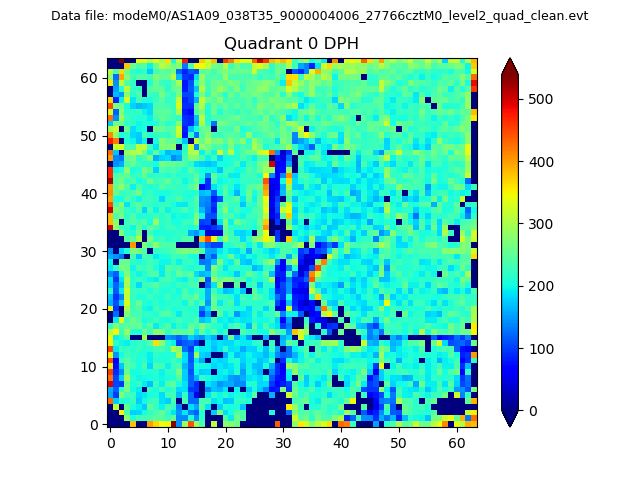 |
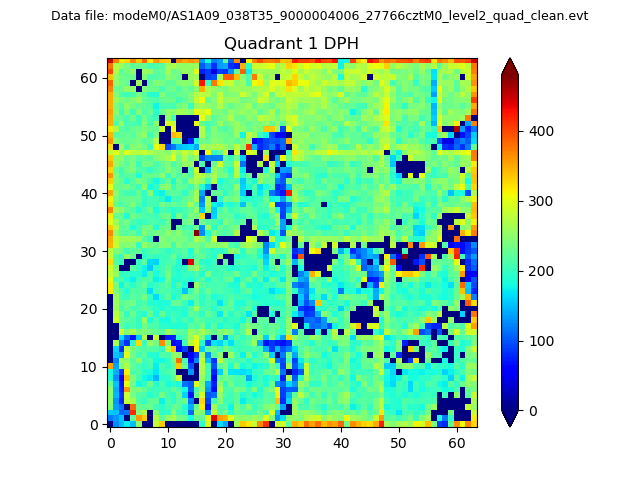 |
Quadrant B |
|---|---|---|---|
| Quadrant D | 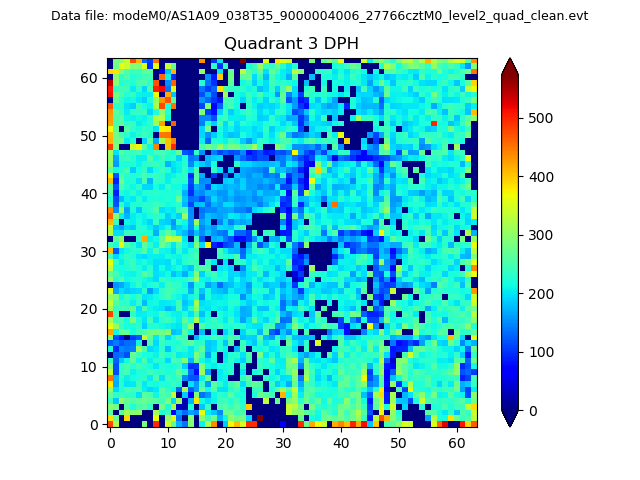 |
 |
Quadrant C |
| Plot type | Count rate plots | Images |
|---|---|---|
| Comparison with Poisson distribution Blue bars denote a histogram of data divided into 1 sec bins. Red curve is a Poisson curve with rate = median count rate of data. |
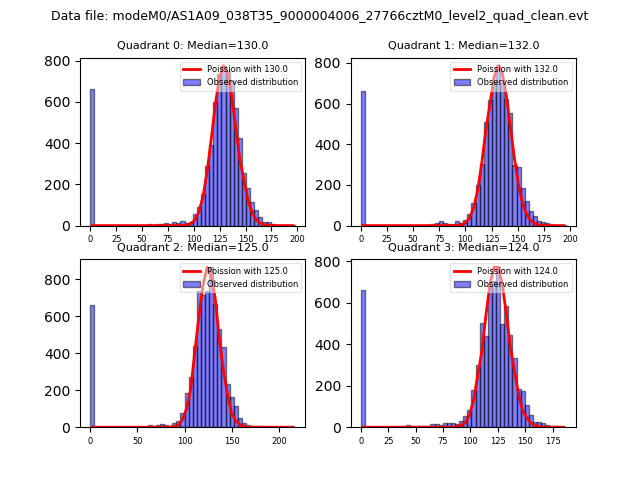 |
 |
| Quadrant-wise count rates Data is divided into 100 sec bins |
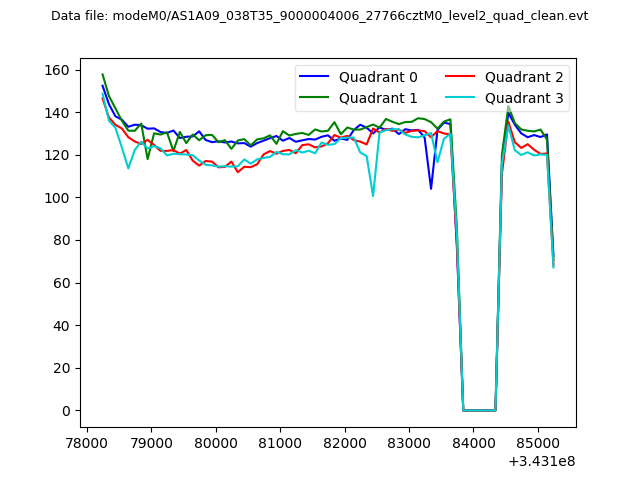 |
|
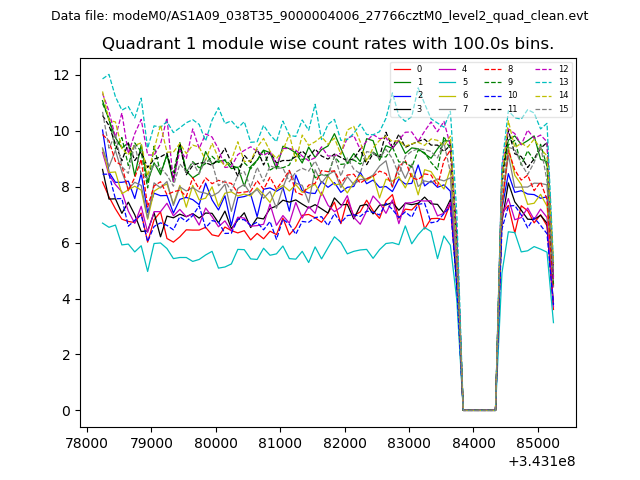
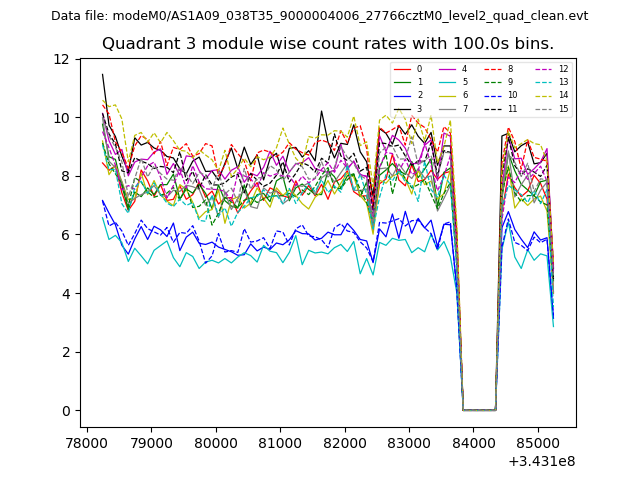
| Module-wise count rates for Quadrant A Data is divided into 100 sec bins |
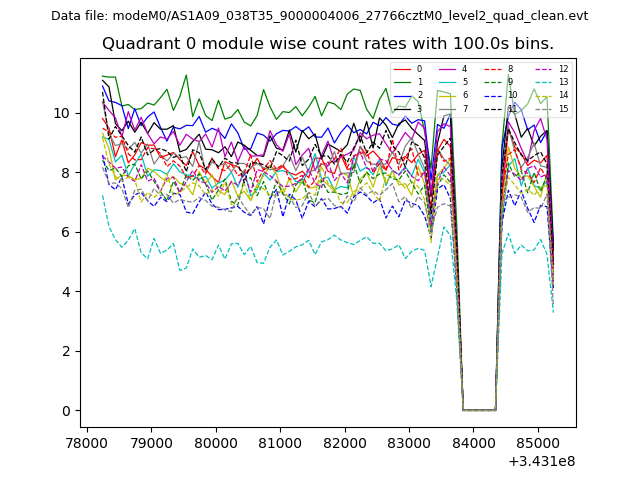 |
 |
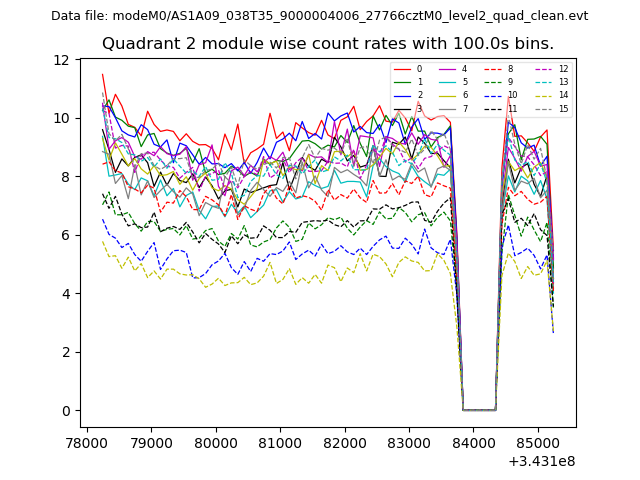
| Module-wise count rates for Quadrant B Data is divided into 100 sec bins |
 |
 |
| Module-wise count rates for Quadrant C Data is divided into 100 sec bins |
 |
 |
| Module-wise count rates for Quadrant D Data is divided into 100 sec bins |
 |
 |
| Parameter | Plot |
|---|---|
| CZT HV Monitor | 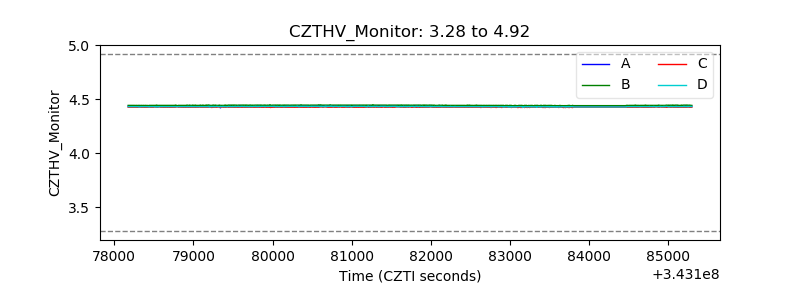 |
| D_VDD | 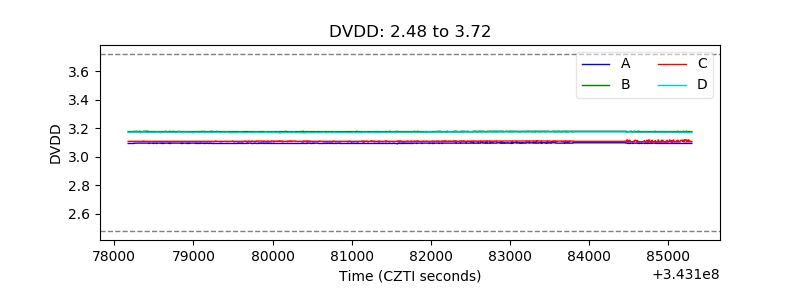 |
| Temperature 1 | 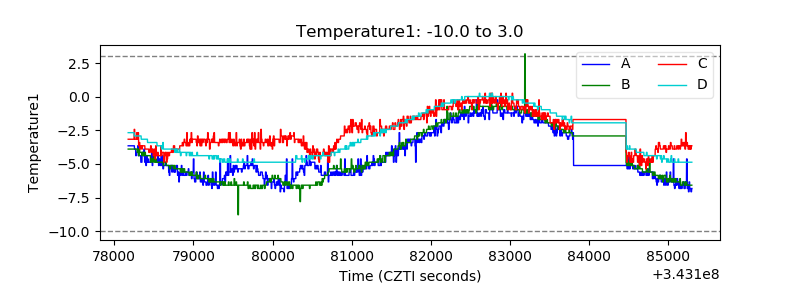 |
| Veto HV Monitor | 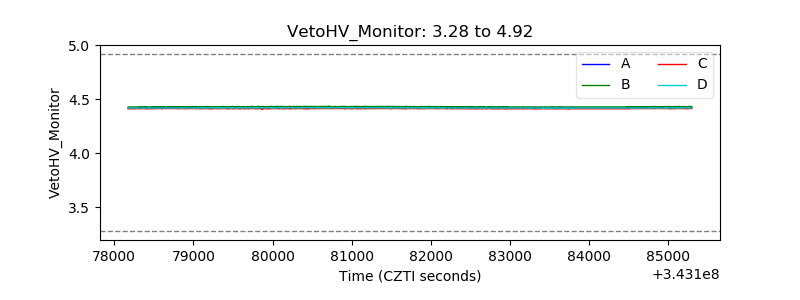 |
| Veto LLD | 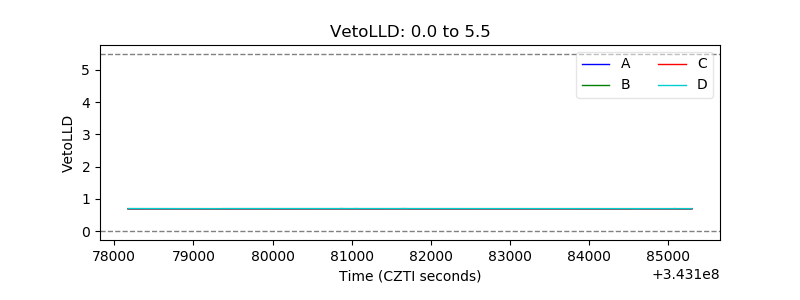 |
| Alpha Counter | 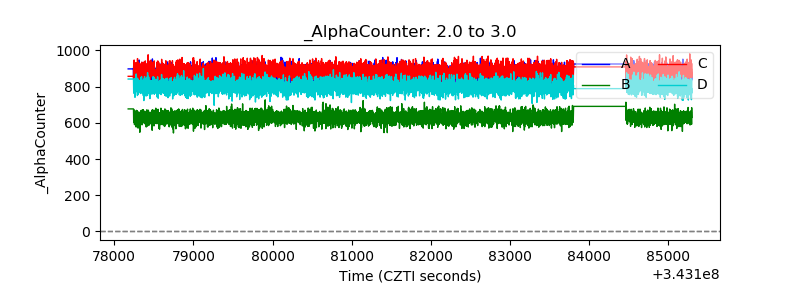 |
| _CPM_Rate | 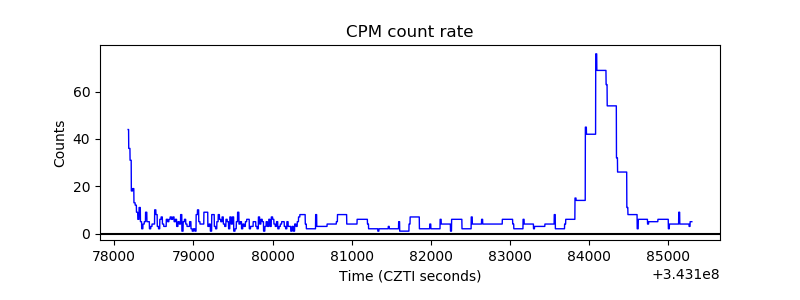 |
| CZT Counter | 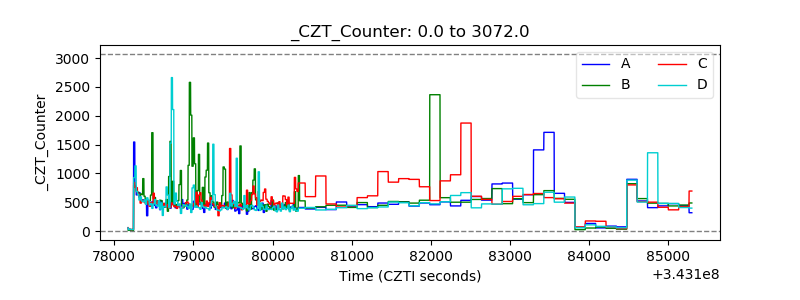 |
| +2.5 Volts monitor |  |
| +5 Volts monitor |  |
| _ROLL_ROT | 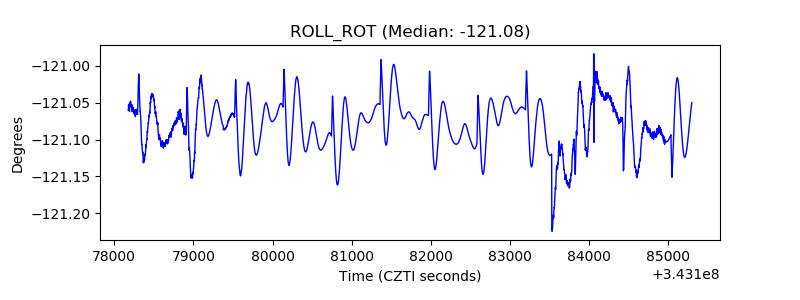 |
| _Roll_DEC | 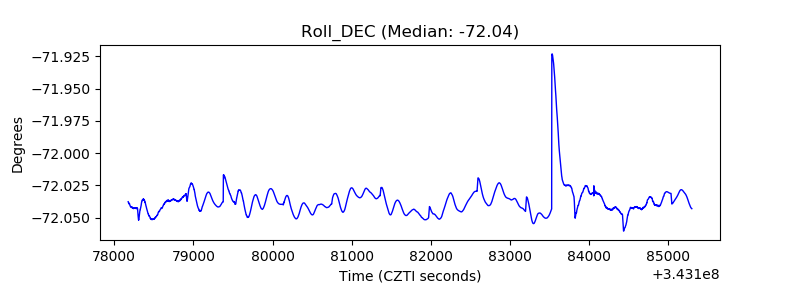 |
| _Roll_RA | 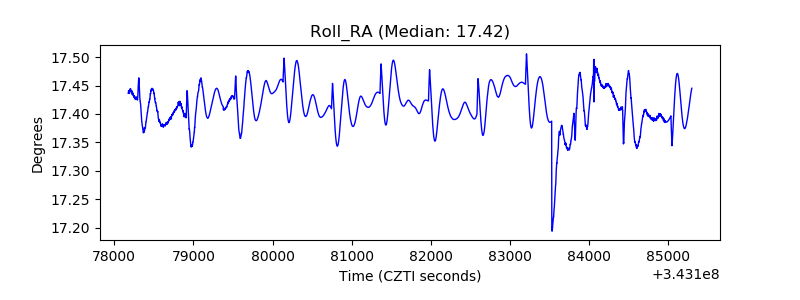 |
| Veto Counter | 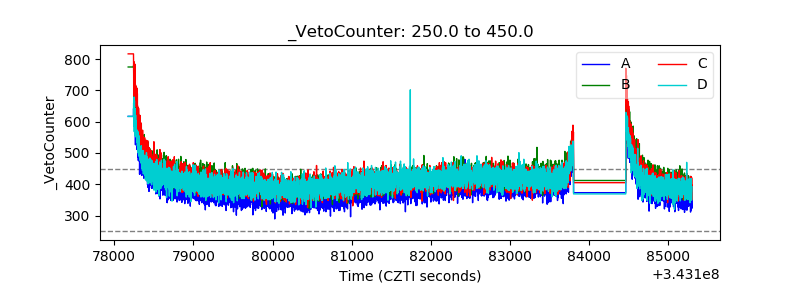 |