| Param | Original file | Final file |
|---|---|---|
| Filename | modeM0/AS1A09_038T35_9000004006_27767cztM0_level2.evt | modeM0/AS1A09_038T35_9000004006_27767cztM0_level2_quad_clean.evt |
| Size (bytes) | 39,827,520 | 12,340,800 |
| Size | 38.0 MB | 11.8 MB |
| Events in quadrant A | 282,193 | 82,423 |
| Events in quadrant B | 298,735 | 83,303 |
| Events in quadrant C | 289,131 | 77,992 |
| Events in quadrant D | 288,948 | 76,904 |
| Mode M0 | |||
|---|---|---|---|
| Quadrant | BADHDUFLAG | Total packets | Discarded packets |
| A | 0 | 1277 | 0 |
| B | 0 | 1288 | 0 |
| C | 0 | 1280 | 0 |
| D | 0 | 1335 | 0 |
| Quadrant | Total seconds | Saturated seconds | Saturation percentage |
|---|---|---|---|
| A | 638 | 0 | 0.000000% |
| B | 638 | 1 | 0.156740% |
| C | 638 | 1 | 0.156740% |
| D | 639 | 5 | 0.782473% |
Noise dominated data is calculated using 1-second bins in cleaned event files. If a bin has >2000 counts, and if more than 50% of those come from <1% of pixels, then it is considered to be noise-dominated and hence unusable.
| Quadrant | # 1 sec bins | Bins with >0 counts | Bins with >2000 counts | High rate bins dominated by noise | Noise dominated (total time) | Noise dominated (detector-on time) | Marked lightcurve |
|---|---|---|---|---|---|---|---|
| A | 638 | 638 | 0 | 0 | 0.00% | 0.00% | 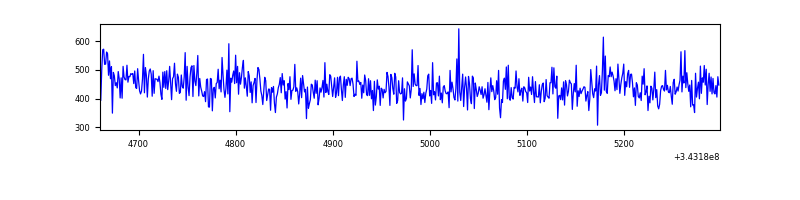 |
| B | 638 | 638 | 0 | 0 | 0.00% | 0.00% | 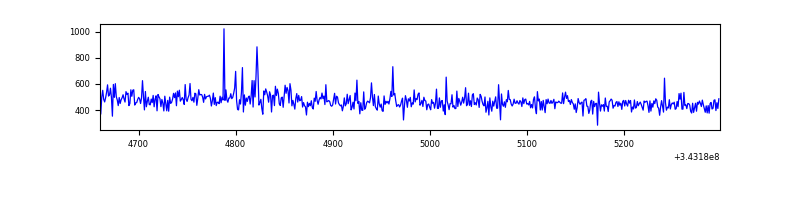 |
| C | 638 | 638 | 0 | 0 | 0.00% | 0.00% | 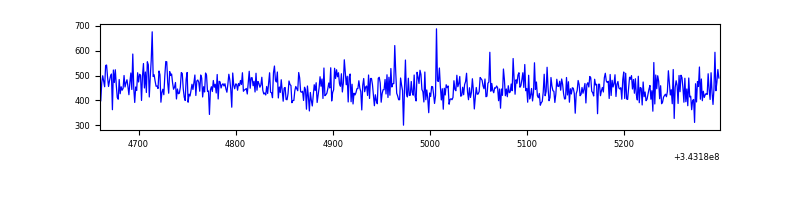 |
| D | 639 | 639 | 5 | 5 | 0.78% | 0.78% | 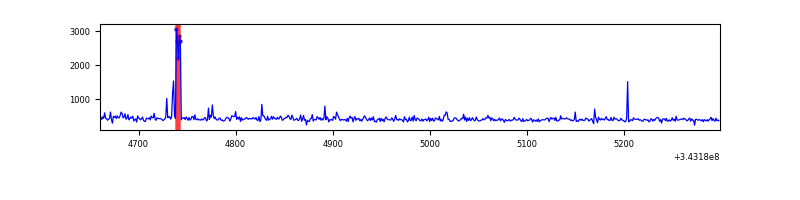 |
Top three noisy pixels from each quadrant. If the there are fewer than three noisy pixels in the level2.evt file, extra rows are filled as -1
| Pixel properties | Quadrant properties | ||||||
|---|---|---|---|---|---|---|---|
| Quadrant | DetID | PixID | Counts | Sigma | Mean | Median | Sigma |
| A | 13 | 170 | 3720 | 217.38 | 72 | 70 | 16.8 |
| A | 13 | 254 | 1314 | 74.09 | 72 | 70 | 16.8 |
| A | 3 | 137 | 664 | 35.38 | 72 | 70 | 16.8 |
| B | 3 | 64 | 4208 | 254.94 | 74 | 72 | 16.2 |
| B | 0 | 230 | 2286 | 136.47 | 74 | 72 | 16.2 |
| B | 12 | 111 | 1778 | 105.16 | 74 | 72 | 16.2 |
| C | 14 | 238 | 11164 | 607.38 | 69 | 69 | 18.3 |
| C | 3 | 233 | 3276 | 175.56 | 69 | 69 | 18.3 |
| C | 8 | 128 | 2096 | 110.97 | 69 | 69 | 18.3 |
| D | 7 | 38 | 14898 | 792.14 | 68 | 65 | 18.7 |
| D | 1 | 52 | 5986 | 316.21 | 68 | 65 | 18.7 |
| D | 2 | 250 | 3429 | 179.65 | 68 | 65 | 18.7 |
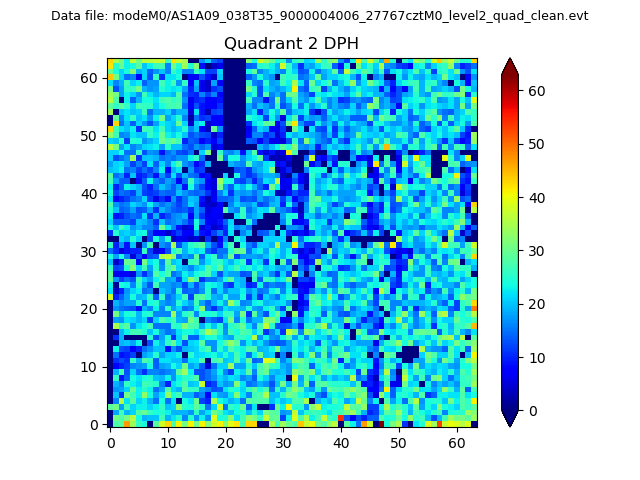
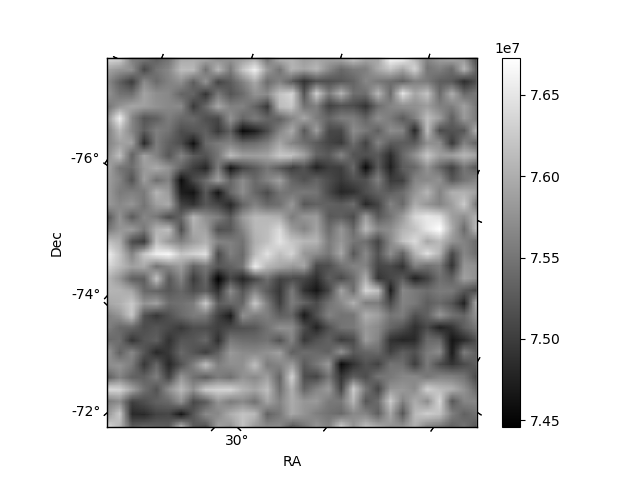
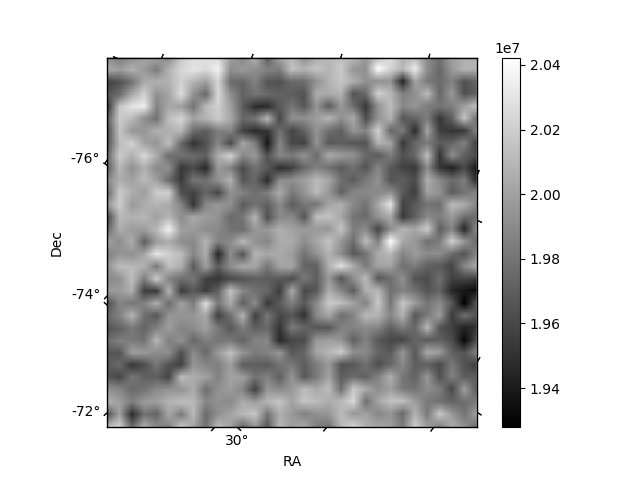
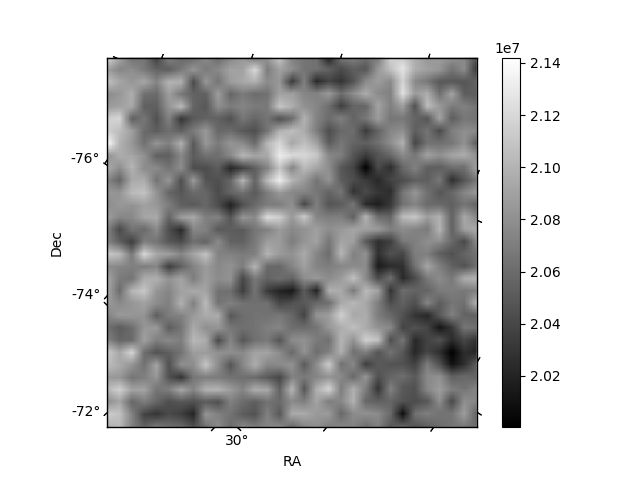
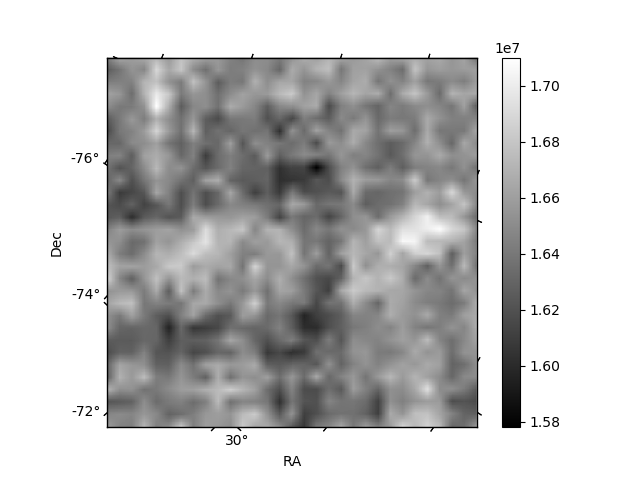
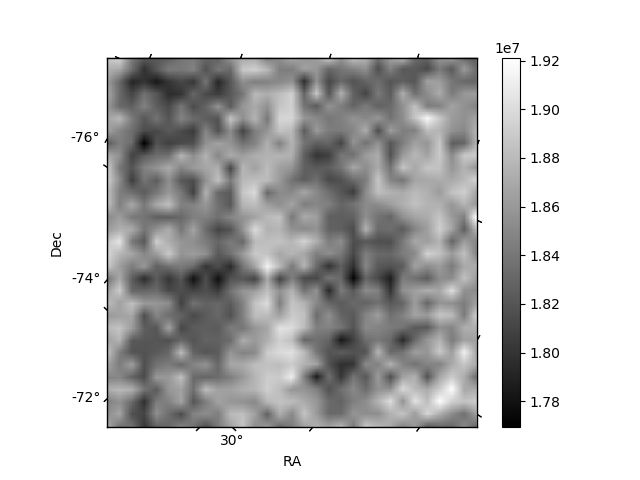
Histogram calculated using DETX and DETY for each event in the final _common_clean file
| Quadrant A | 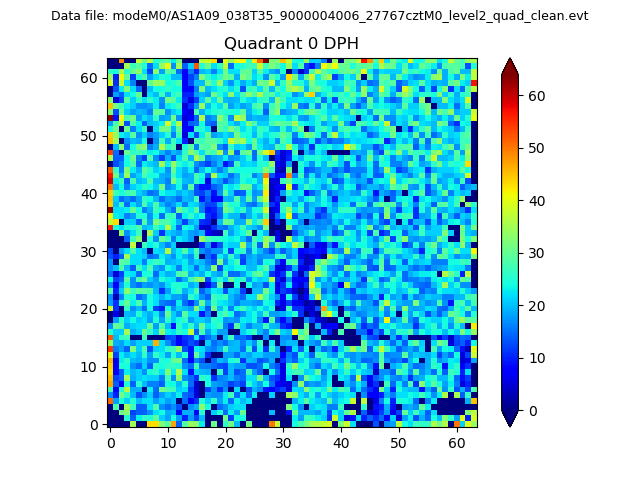 |
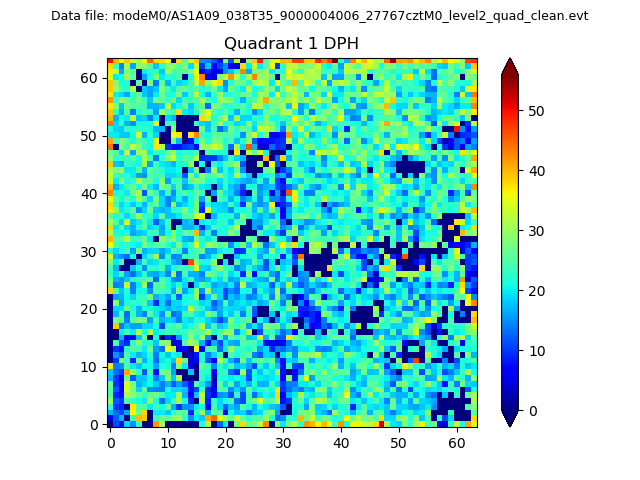 |
Quadrant B |
|---|---|---|---|
| Quadrant D | 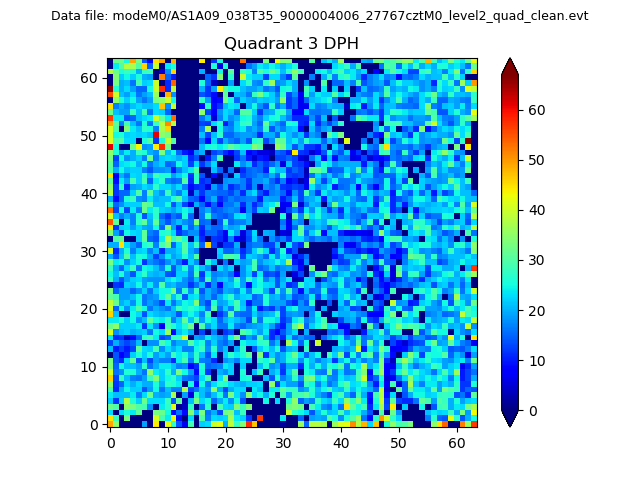 |
 |
Quadrant C |
| Plot type | Count rate plots | Images |
|---|---|---|
| Comparison with Poisson distribution Blue bars denote a histogram of data divided into 1 sec bins. Red curve is a Poisson curve with rate = median count rate of data. |
 |
 |
| Quadrant-wise count rates Data is divided into 100 sec bins |
 |
|
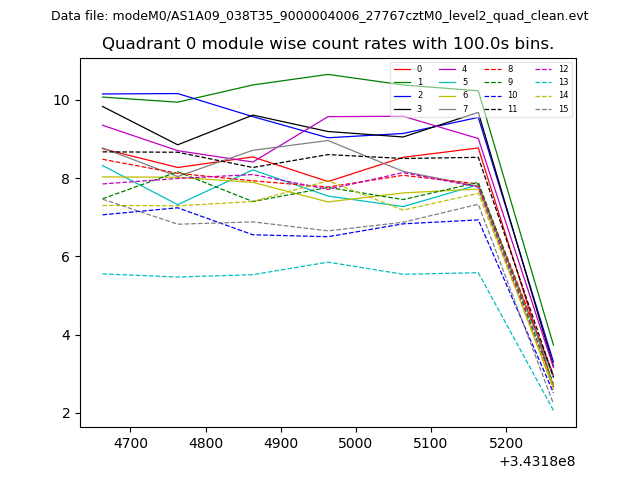
| Module-wise count rates for Quadrant A Data is divided into 100 sec bins |
 |
 |
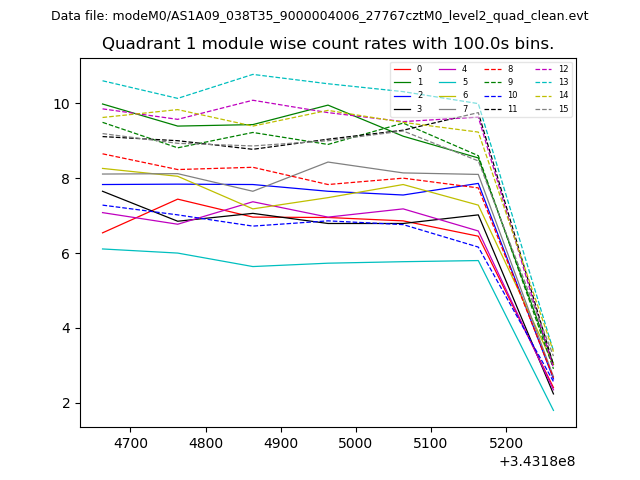
| Module-wise count rates for Quadrant B Data is divided into 100 sec bins |
 |
 |
| Module-wise count rates for Quadrant C Data is divided into 100 sec bins |
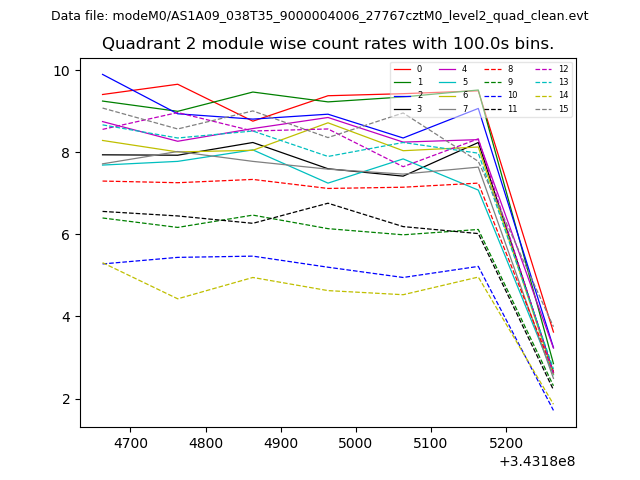 |
 |
| Module-wise count rates for Quadrant D Data is divided into 100 sec bins |
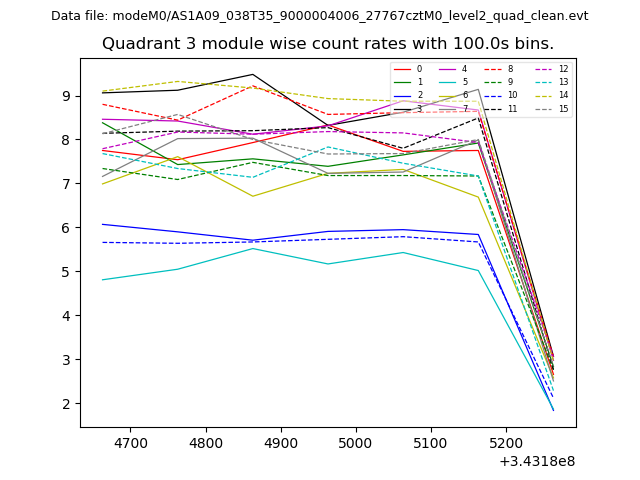 |
 |
| Parameter | Plot |
|---|---|
| CZT HV Monitor | 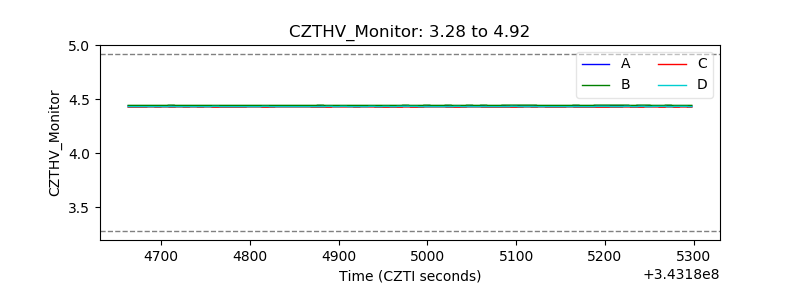 |
| D_VDD | 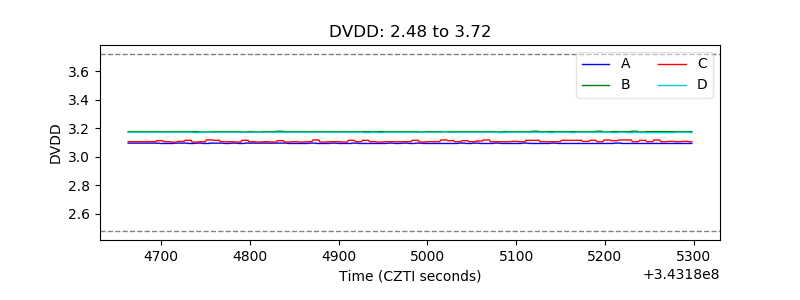 |
| Temperature 1 | 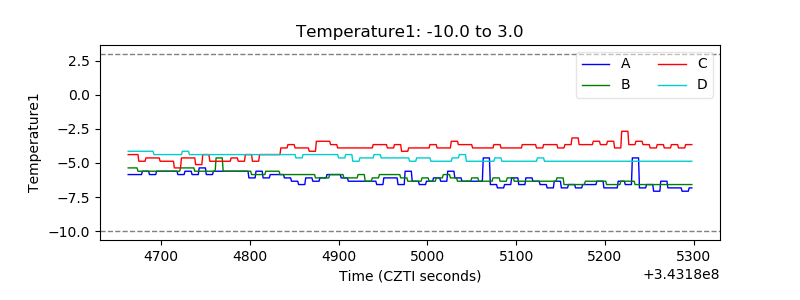 |
| Veto HV Monitor | 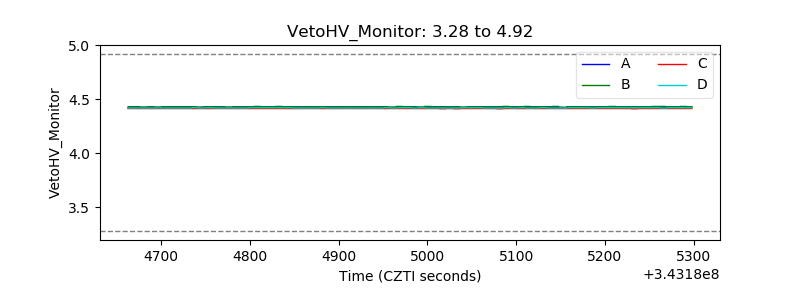 |
| Veto LLD | 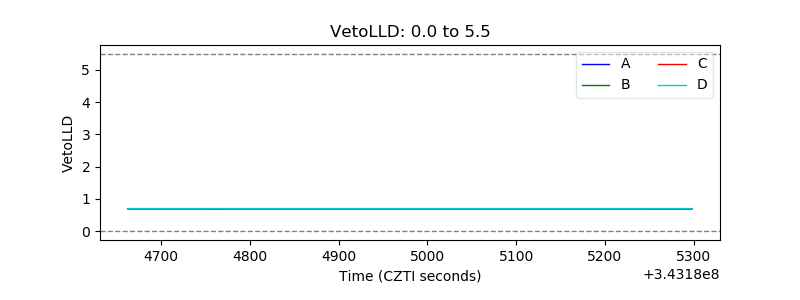 |
| Alpha Counter | 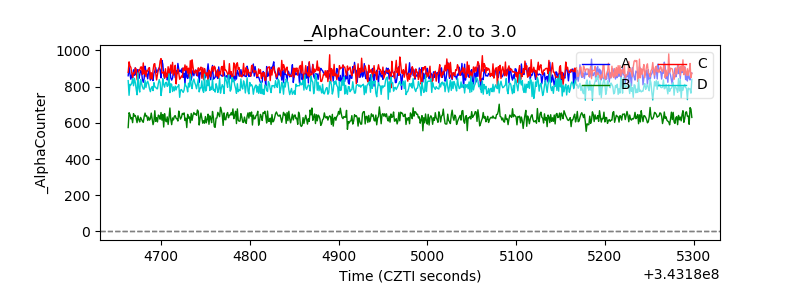 |
| _CPM_Rate |  |
| CZT Counter | 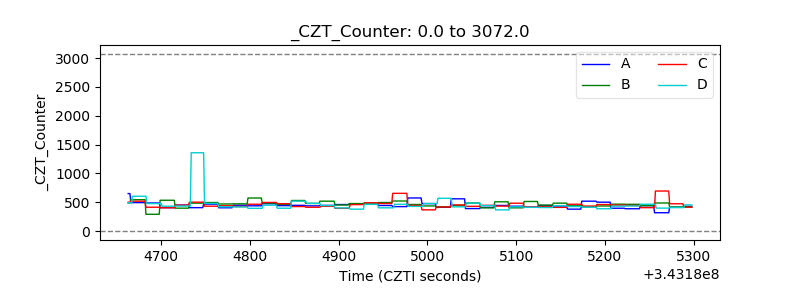 |
| +2.5 Volts monitor |  |
| +5 Volts monitor |  |
| _ROLL_ROT | 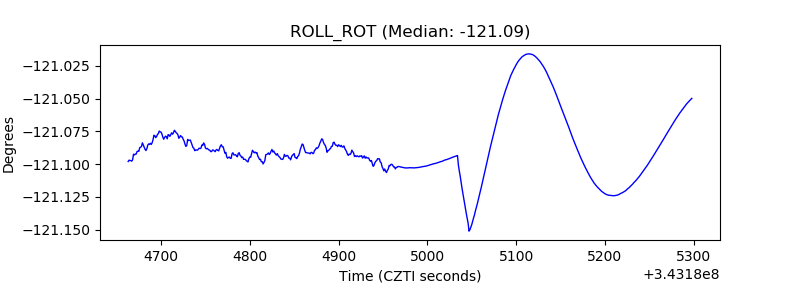 |
| _Roll_DEC | 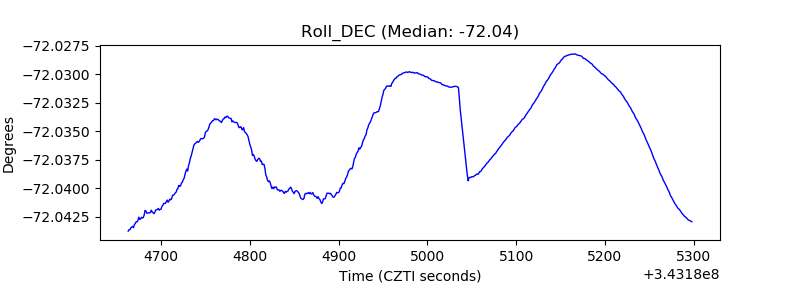 |
| _Roll_RA | 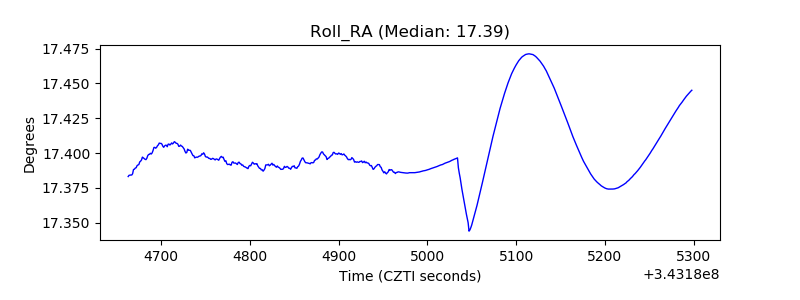 |
| Veto Counter | 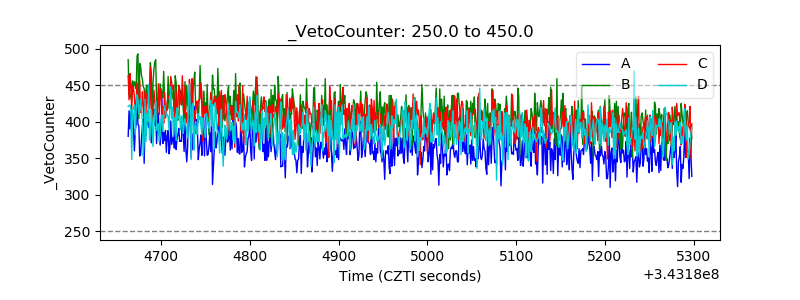 |